Introduction
Owing to its unusual magnetic and electronic transport properties, the narrow-gap semiconductor FeSb2 has been one of the extensively studied compounds in the past few decades.[Reference Holseth and Kjekshus1–Reference Petrovic, Kim, Bud'ko, Goldman and Canfield4] The renewed interest in this compound came after Bentien et al.[Reference Bentien, Johnsen, Madsen, Iversen and Steglich5] reported a colossal value of the Seebeck coefficient of –45,000 µV/K with a record high value of the power factor (PF) of 2300 µW/K2/cm at around 10 K in single crystal samples, which may make this material a potential candidate for the Peltier cooling applications at very low temperature near 10 K. Despite the huge PF value, the dimensionless figure of merit (ZT) values for single crystal samples are limited by a very high thermal conductivity κ ~ 500 W/m/K at ~10 K. In our earlier work,[Reference Zhao, Pokharel, Zhu, Chen, Lukas, Qing, Opeil, Chen and Ren6] we were able to reduce the thermal conductivity by three orders of magnitude to 0.5 W/m/K in achieving a peak ZT value of ~0.013 at ~50 K in nanocomposite samples. However, the Seebeck coefficient in the nanocomposites is severely degraded at low temperatures when compared with that of the single crystal counterpart. For optimized samples with κ = 0.40 W/m/K and ρ = 1.2 × 10⁻⁴ Ω m at 50 K, a Seebeck coefficient of –970 µV/K is required to achieve a ZT value of 1. Unfortunately, the measured value of the Seebeck coefficient at 50 K was only – 109 µV/K. Therefore, it is important to know the origin of the large Seebeck coefficient in this system to further improve ZT.
The classical theory of thermoelectricity is based on the assumption that the flow of charge carriers and phonons can be treated independently. Under this assumption, the Seebeck coefficient arises due solely to spontaneous electron diffusion. However, when the two flows are linked, the effect of electron–phonon scattering should be taken into account. Hence, in general, the Seebeck coefficient is given as the sum of two independent contributions[Reference Herring7]
 $$\; S=S_{\rm d}+S_{\rm p}\comma \;$$
where S d is the conventional electron-diffusion part and S p is the phonon-drag contribution. The diffusion part is caused by the spatial variation of the electronic occupation in the presence of a thermal gradient, whereas the drag part arises due to the interaction between anisotropic lattice vibrations and mobile charge carriers. Herring[Reference Herring7] showed that the higher than expected value of thermopower in germanium[Reference Geballe and Hull8] and other semiconductors could be explained assuming that the carriers are preferentially scattered by the phonons toward the cold end of the sample. The dragging of some of the charge carriers along the thermal gradient gives rise to an additional thermoelectric electromotive force (emf). Because the additional emf and the emf induced by diffusion have the same sign, the overall phonon-drag effect is to increase the Seebeck coefficient. Generally, this effect becomes stronger at lower temperatures where the phonon mean free path becomes longer.
The origin of the colossal Seebeck coefficient in FeSb2 at low temperature is not completely understood yet. Several authors[Reference Bentien, Johnsen, Madsen, Iversen and Steglich5, Reference Sun, Oeschler, Johnsen, Iversen and Steglich9–Reference Sun, Søndergaard, Sun, Johnsen, Iversen and Steglich12] suggested a strong electron–electron correlation as a possible cause. Other authors,[Reference Takahashi, Okazaki, Yasui and Terasaki13, Reference Tomczak, Haule, Miyake, Georges and Kotliar14] however, surmised that the origin of the colossal value of the Seebeck coefficient is not due to electron–electron correlations but due to the phonon drag effect. In this paper, we study the thermoelectric properties of FeSb2 nanocomposites and present evidence of a substantial phonon-drag contribution to the Seebeck coefficient in FeSb2.
Experimental
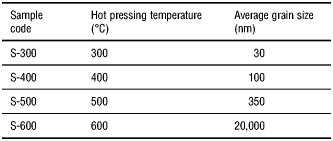
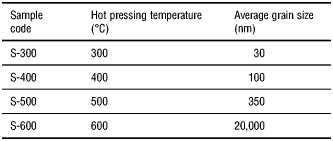
Nanostructured FeSb2 samples were synthesized by first forming an ingot through melting and solidification. The ingot was ball milled and hot pressed at different temperatures to obtain the nanocomposite samples with different grain sizes ranging from nanometers to micrometers. The labels given to the different samples and the corresponding processing parameters are shown in Table I. The Seebeck coefficient (S), electrical resistivity (ρ), thermal conductivity (κ), and Hall coefficient (R H) were measured on a Physical Property Measurement System (PPMS) from Quantum Design Inc. (San Diego, CA). Sample preparation and measurements were performed in the manner described in Ref. Reference Zhao, Pokharel, Zhu, Chen, Lukas, Qing, Opeil, Chen and Ren6.
Assigned IDs, processing temperature, and average grain sizes estimated from the SEM images for the four nanocomposite FeSb2 samples.
Results and discussions
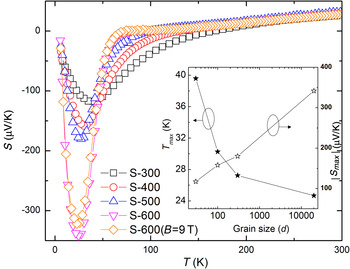
Figure 1 shows the temperature dependence of the Seebeck coefficient for our four nanocomposite samples. Sample S-600 was measured both in magnetic fields of 0 and 9 T. The Seebeck coefficients of all samples are significantly smaller than that of a single crystal at low temperature, whereas at high temperature the values are comparable. A room temperature value of S ~ 26 µV/K was observed for all our samples. This value is comparable to S ~ 31 µV/K reported for the single crystal.[Reference Abrikosov and Petrova15] A decrease in the Seebeck coefficient at low temperature in polycrystal,[Reference Bentien, Madsen, Johnsen and Iversen11] thin films[Reference Sun, Johnsen, Eklund, Sillassen, Bøttiger, Oeschler, Sun, Steglich and Iversen16] and arsenic-substituted FeSb2 single crystals[Reference Sun, Oeschler, Johnsen, Iversen and Steglich9] was reported earlier. As shown in the inset of Fig. 1, the peak value of the Seebeck coefficient (S max) decreases with decreasing grain size. This is expected for the phonon-drag effect, because the non-electronic scattering (grain boundary scattering in the case of nanocomposites) reduces the phonon mean free path, which in turn decreases the phonon-drag contribution. A similar conclusion was drawn in Ref. Reference Tomczak, Haule, Miyake, Georges and Kotliar14. Yet another example of the reduction of phonon mean free path decreasing phonon drag contribution was shown by Weber et al.[Reference Weber, Lehr and Gmelin17] It was demonstrated, using point contacts, that when the contact size becomes comparable to the mean free path of the relevant phonons, the phonon-drag part of the thermopower is suppressed by the boundary scattering. Here, we also note that the temperature profile of the Seebeck coefficient for the samples with larger grains follows the typical behavior of phonon-drag system as suggested by Blatt.[Reference Blatt18]
Temperature dependence of the Seebeck coefficient for the four samples. Sample S-600 was measured both at 0 and 9 T magnetic fields. Inset: The grain size dependence of the peak value (S max) and the peak position (T max) of the Seebeck coefficient.

The Seebeck peaks shift to the higher temperature when the grain size decreases (inset of Fig. 1). This type of size-dependent shift in the Seebeck peak is one of the characteristics of the phonon-drag-dominated systems, as pointed out previously.[Reference Geballe and Hull8, Reference Hou, Gu, Chen and He19, Reference Issi and Boxus20]
Usually, a small magnetothermopower is expected for the phonon-drag dominated system. For sample S-600 at 25 K, we observed a relative change in the Seebeck coefficient, (S(9T) − S(0T))/S(0T) = 0.059. This small value supports the non-electronic origin of the large Seebeck coefficient in this sample.
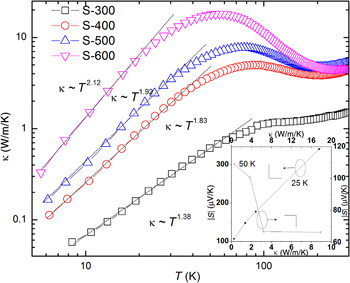
Figure 2 shows the temperature dependence of the thermal conductivity (κ) for the four samples. Calculations based on the Wiedemann–Franz law show that below 50 K, more than 97% of the total thermal conductivity comes from the lattice contribution. For large-grained samples, a temperature dependence of the form κ ~ T 2 is nearly obeyed at temperatures below 50 K. Weber et al.[Reference Weber and Gmelin21] reported a similar T 2 behavior in silicon below 20 K that they attribute to strong electron-phonon scattering. As the grain size decreases, we find a gradual deviation from the T 2 law. This can be understood as follows: for a large-grained sample, the number of available phonons interacting with the carriers is large which causes significant phonon-drag. As the grain size decreases the number of relevant phonons decreases and as a result the preferential scattering of electrons by phonons becomes weaker. Evidence for electron–phonon coupling in FeSb2 single crystals was also reported by Perucchi et al.[Reference Perucchi, Degiorgi, Hu, Petrovic and Mitrović22] who found a large change in phonon lifetimes using optical spectroscopy. Lazarevic et al.[Reference Lazarević, Popović, Hu and Petrovic23] later suggested that the electron–phonon coupling is temperature dependent below 40 K.
Temperature dependence of the thermal conductivity for the four samples. Fitting to the power law was done for all the samples below 50 K. Inset: Seebeck coefficient as a function of thermal conductivity at 25 and 50 K.

The inset of Fig. 2 shows the change in the Seebeck coefficient with thermal conductivity for 25 and 50 K. At 25 K, the Seebeck coefficient increases linearly with the thermal conductivity. The linear relationship is expected because in a phonon-drag dominated system S p is expected to follow the same temperature dependence as the phonon heat capacity so that S p and the lattice thermal conductivity (κ l) are linearly related. This indicates that phonons play a significant role in determining the Seebeck coefficient values of our samples at around 25 K. At 50 K, however, the Seebeck coefficient decreases with increasing thermal conductivity without any obvious trend. This is an indication that the phonon-mean free path decreases and the phonon-drag effect becomes weak at higher temperature.
Significant phonon drag effects are expected to occur when the dominant phonons acquire sufficient momentum to scatter carriers across the Fermi surface.[Reference Morelli24] In a rough approximation, $\; T_{{\rm max}} \approx {\textstyle{1 \over {10}}}\theta _D $, where T max is the temperature at which the phonon drag peak occurs and θ D is the Debye temperature. For rutile TiO2,[Reference Tang, Wang, Zhao and Li25]θ D is 450–780 K and the Seebeck peak occurs at 10–30 K. For bismuth,[Reference Issi and Boxus20] another well-known phonon drag system, θ D is 119 K, whereas the Seebeck peak occurs at 2–3 K. For the FeSb2 polycrystal, θ D ≈ 330 − 350K was reported in Ref. Reference Bentien, Madsen, Johnsen and Iversen11 and 256 K in Ref. Reference Petrovic, Lee, Vogt, Lazarov, Bud'ko and Canfield26. The Seebeck peak in single crystal occurs at around 10 K. For our sample S-600, the peak occurs at 25 K. Hence, comparing with the other phonon drag systems, the scaling between T max and θ D in FeSb2 is consistent with the phonon-drag picture.
Following Herring,[Reference Herring7] the electron-diffusion part of the Seebeck coefficient, in μV/K, for a semiconductor is given by
 $$S_{\rm d}=\mp \; 86.2\left[{{\rm ln}\displaystyle{{4.7 \times 10^{15} } \over n}+\displaystyle{3 \over 2}{\rm ln}\displaystyle{{m^{\ast} } \over m}+\displaystyle{{\vert \Delta E\vert } \over {kT}}+\displaystyle{3 \over 2}{\rm ln}T} \right]\comma \;$$
where n is the charge carrier density expressed in cm−3, m and m* are the bare and effective masses of the electron, respectively, and ΔE is the average energy of the transported electrons relative to the band edge. In Eq. (2), the upper and lower signs are for n-type and p-type materials, respectively.
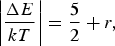
For the case of lattice scattering by long wavelength phonons, |ΔE| /kT can be approximated by[Reference Herring7]
 $$\left\vert {\displaystyle{{\Delta E} \over {kT}}} \right\vert =\displaystyle{5 \over 2}+r\comma \;$$
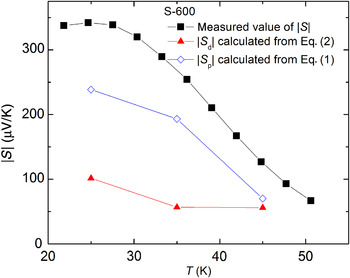
where the scattering parameter r is taken to be −1/2. S d was calculated taking m* = m and using the charge carrier density (n) calculated from the Hall-coefficient measurements. The diffusion part was then subtracted from the total measured Seebeck coefficient to obtain the drag contribution shown in Fig. 3. For S-600 at 25 K, we find the diffusion value, S d = −110 µV/K. Using Eq. (1), S p was calculated to be −238 µV/K. However, for S-300 the calculated diffusion contribution turned out to be slightly larger than the measured values. Hence, no significant phonon drag contribution is expected for this sample. This is understandable, because the phonon mean free path for sample S-300 is drastically reduced so that the dominant phonons do not carry sufficient momentum to scatter carriers. Moreover, the phonon drag is expected to weaken with increasing carrier concentration and, in fact, it has been proposed that a saturation effect occurs at high concentration level. The overestimation of the diffusion part of the Seebeck coefficient in S-300 is probably due, in part, to the approximations made in the above calculations.

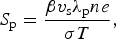
The phonon-drag thermopower for semiconductors, in the first-order approximation, can be written as[Reference Herring7]
 $$\; S_{\rm p}=\displaystyle{{\beta v_{\rm s} \lambda _{\rm p} ne} \over {\sigma T}}\comma \;$$
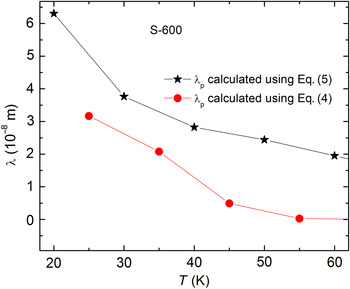
where v s is the velocity of sound, λp the mean free path of the interacting phonons, n the charge carrier density, σ the electrical conductivity, T is the absolute temperature, and β is the dimensionless parameter with its value ranging from 0 to 1 depending upon the strength of the interaction. Equation (4) can be used to find approximate values of the mean free path of t phonons interacting with the electrons. The mean free path of an average phonon can also be estimated from the lattice thermal conductivity based on kinetic theory[Reference Ziman27]
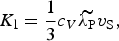 $$K_{\rm l}=\displaystyle{1 \over 3}c_V \widetilde{\lambda _{\rm P} }v_{\rm S}\comma \;$$
where K l is the lattice thermal conductivity and c V the phonon contribution to the total specific heat capacity. The lattice contribution of the total thermal conductivity was calculated assuming κtotal = κl + κe and κe = LσT, where κe is the electronic contribution to the total thermal conductivity. The Lorenz number in the free electron model, L = 2.45 × 10⁻⁸ W/K2/Ω was used, c V was calculated using C P − γT = βT 3 with γ = 3.98 × 10⁻³/JK2/mol, as reported in Ref. Reference Bentien, Madsen, Johnsen and Iversen11, and the C P values were obtained from the same reference. Figure 4 shows the temperature dependence of the two length scales for samples S-600. It turns out that with ʋ s = 3116 m/s and β = 0.5, the two length scales, which come from two independent calculations, are of the same order of magnitude and more importantly they behave roughly the same way as a function of temperature. This suggests that similar wavelength phonons are playing a role in both the thermal conductivity and the phonon-drag effect. A similar analysis was performed in Ref. Reference Thurber and Mante28 to describe the unusually large Seebeck coefficient in rutile TiO2 at low temperature.

According to Keyes et al.[Reference Keyes, Heikes and Ure29] the value of the figure of merit (Z p) that can be reached using phonon drag is rather low. Based on their argument, Goldsmid[Reference Goldsmid30] shows that Z pT is less than ¼ for a bulk thermoelectric material. Ivanov et al.[Reference Ivanov and Rowe31] reported recently a similar conclusion for low-dimensional structures. These conclusions are consistent with our earlier work[Reference Zhao, Pokharel, Zhu, Chen, Lukas, Qing, Opeil, Chen and Ren6] where, despite the dramatic reduction in the thermal conductivity by three orders of magnitude, ZT values were not improved significantly Fig. 3(d) in Ref. [Reference Zhao, Pokharel, Zhu, Chen, Lukas, Qing, Opeil, Chen and Ren6].
Finally, our nanocomposite data and analysis of phonon drag do not support other mechanisms that might explain the large Seebeck effects reported by Bentien et al.[Reference Bentien, Johnsen, Madsen, Iversen and Steglich5] Although one cannot preclude the presence of electron–electron correlation effects, their role in this phenomenon may be a minor one. The recent analysis of electron correlations using a hybrid functional approach of Becke[Reference Becke32] and Hegin's GW functional approach[Reference Hedin33] by Tomczak et al.[Reference Tomczak, Haule, Miyake, Georges and Kotliar14] suggest that the high thermopower in FeSb2 should not be understood in the context of local correlations, but rather by utilizing vertex corrections to the transport coefficients. Such vertex corrections describe the phonon-drag effect. The phonon-drag effects in FeSb2 are similar to those described in p-type Ge by Geballe and Hull.[Reference Geballe and Hull8] In a similar vein the study of magnetoresistance and Hall effect by Takahashi et al.[Reference Takahashi, Okazaki, Yasui and Terasaki13] concludes that the large Seebeck coefficient in FeSb2 is unlikely to originate from electron–electron correlations because they have an insignificant effect on the Seebeck coefficient in the low-temperature insulating regime. Our data on FeSb2 nanocomposite supports their conjecture that the phonon-drag effect plays an essential role in enhancing the Seebeck coefficient in the low-temperature regime, as shown in other semiconductor materials e.g., InSb[Reference Frederikse and Mielczarek34] and weakly P doped Si.[Reference Weber and Gmelin21]
Conclusions
To summarize, in this paper we analyzed qualitatively and quantitatively several indicators of the presence of substantial electron–phonon interaction in FeSb2 at low temperature. Our analysis indicates that a significant phonon-drag effect must take place in coarse-grained samples at low temperature. As the grain size decreases, the phonon drag effect becomes weaker, causing a much smaller peak value of the Seebeck coefficient in fine-grained samples. Based on these results we conclude that the phonon drag plays a significant role in the colossal value of the Seebeck coefficient in FeSb2 single crystals. Therefore, the ZT values of FeSb2 nanocomposite cannot be improved significantly even though the thermal conductivity can be drastically reduced.
Acknowledgments
The authors would like to thank J. Heremans, K. Kempa, and R. Farrell, S.J. for helpful discussions and comments on the manuscript. C.O. acknowledges financial support from the Trustees of Boston College. We gratefully acknowledge funding for this work by the Department of Defense, United States Air Force Office of Scientific Research, Multi-University Research Initiative (MURI) Program under Contract No. FA9550-10-1-0533.