Implications
In countries like Ireland, where grazed grass is abundantly available, inclusion of grass silage followed by a period of grazed grass, before finishing on a high energy concentrate diet, decreases production costs in late maturing suckler bull production systems (PS) but the bulls may not meet the market-specific requirements in terms of carcass fat cover. It may be more appropriate, therefore, to rear early maturing breed types in such PS as the bulls have higher carcass fat scores and marbling fat, and yield more tender and juicier beef.
Introduction
In Ireland, late maturing (LM) breed types account for 85% of the suckler beef herd while the remaining 15% are early maturing (EM) breed types (McGee, Reference Mezgebo, Moloney, O’Riordan, McGee, Richardson and Monahan2012). Traditionally, the male beef cattle population was dominated by steers, but more recently the proportion of bulls has increased as steers are less efficient in nutrient utilisation than bulls when reared similarly (O’Riordan et al., Reference Oddy, Harper, Greenwood and McDonagh2011). However, producing beef from suckler bulls, which usually involves provision of a high concentrate ration for a prolonged period, is usually less profitable because of the higher cost of concentrates compared with grass silage or grazed grass diets (Finneran et al., Reference Finneran, Crosson, O’Kiely, Shalloo, Forristal and Wallace2011). Incorporating a grazing period before finishing on a concentrate diet has been shown to reduce the production costs of LM suckler bulls (O’Riordan et al., Reference Oddy, Harper, Greenwood and McDonagh2011) with little impact on eating quality of the beef (Mezgebo et al., Reference Moloney and Richardson2016).
However, while it is economically viable to incorporate a grazing period in the LM suckler bull PS, the bulls may not meet the market requirements in terms of adequate carcass fat cover at a particular carcass weight (O’Riordan et al., Reference Oddy, Harper, Greenwood and McDonagh2011). Carcass fat cover and colour are important parameters for the beef industry as they influence the quality and consumer acceptability of beef (Moloney and Richardson, Reference Monin and Ouali2013). Even though LM predominate in the suckler herds in Ireland, EM may be more suitable for a grass-based PS because when managed to a particular slaughter weight and/or age, EM have a higher genetic potential to deposit fat than LM (Keane, Reference Keane2011).
Recently, the influence, on beef quality characteristics, of incorporating a grazing period before indoor finishing on a concentrate diet in the LM suckler bull PS was evaluated (Mezgebo et al., Reference Moloney and Richardson2016). However, to our knowledge, little is known about the effect of incorporating a grazing period in EM suckler bull PS on the quality of the beef. Therefore, the aim of this study was to determine the influences of breed maturity and inclusion of a period of grazed grass in a suckler bull PS on the compositional, biochemical and organoleptic characteristics of beef. It was hypothesised that LM could be replaced by EM, to achieve adequate fat cover and product quality specifications, in a suckler bull beef PS.
Material and methods
Animals and management
As part of a larger study described by Marren et al. (Reference McCormick2013), 28 spring-born (mean birth date 30 March) EM (Aberdeen Angus and Hereford sired calves) and 28 spring-born (mean birth date 8 March) LM (Charolais and Limousin sired calves) weaned suckler bulls were purchased at livestock markets in Ireland at ~8 months of age, acclimatised to slatted floor accommodation and offered grass silage ad libitum plus 2 kg/head per day of a barley-based concentrate. Bulls were randomly assigned (1 December) within breed maturity to a two breed types (B)×two PS factorial arrangement of treatments, balanced for sire breed and initial weight. The two PS were: (1) ad libitum concentrates (870 g/kg rolled barley, 60 g/kg soya bean meal, 50 g/kg molasses and 20 g/kg minerals and vitamins) plus ad libitum grass silage (GS) (dry matter digestibility 700 g/kg) (C), and (2) GS plus 2 kg concentrate daily during the winter (123-day duration) followed by 99 days at pasture and then an indoor finishing period on C (GSPC). Bulls were slaughtered at a commercial slaughter plant (Kepak Group, Clonee, County Meath, Ireland) on reaching a mean live weight estimated to achieve a target carcass weight of 380 kg. The study was carried out under license from the Irish Government and with the approval of Teagasc, the Agricultural and Food Development Authority.
Carcass grading and muscle tissue collection
Post slaughter, carcasses were weighed and graded for conformation according to the EU Beef Carcass Classification Scheme as described in Mezgebo et al. (Reference Moloney and Richardson2016). At 1 h post-slaughter, a sample (ca. 20 g) of longissimus thoracis (LT) muscle tissue was taken (from 9th rib), snap frozen in liquid nitrogen and maintained at −80°C for muscle metabolic enzyme activity and muscle typing analyses.
Muscle pH and temperature measurement
Muscle pH was measured at 2, 3.5, 5 and 48 h postmortem by making a scalpel incision in the muscle at the 10th rib and inserting a glass electrode (Model EC-2010-06; Amagruss Electrodes Ltd, Westport, County Mayo, Ireland) attached to a portable pH meter (Model no. 250A; Orion Research Inc., Boston, MA, USA) ~4.0 cm into the muscle. The temperature was recorded simultaneously and used to make a temperature compensated pH measurement.
Fat and muscle colour measurements
A detailed procedure is given in Mezgebo et al. (Reference Moloney and Richardson2016). Briefly, at 48 h postmortem, carcasses were cut at the 5/6th rib interface before subcutaneous fat and muscle colour measurements. Subcutaneous fat colour (i.e. L, a, b colour coordinates) was measured using a Miniscan XE Plus (Hunter Associates Laboratory Inc., Reston, VA, USA) at two positions: (1) the lower round/rump region and (2) 13th rib region. Chroma/saturation (C) and hue angle (h°) values were calculated from the ‘a’ and ‘b’ values. For muscle colour measurement, the cut surface of the muscle was first allowed to bloom for 1 h. Muscle colour grade was also subjectively assessed on the chilled carcass using Meat Standards Australia colour sticks (Anon, 2005). A portion of LT muscle (13 cm in length, from the 10th rib region) was excised, vacuum packed, aged for 14 days at 2°C, and finally frozen and stored at −18°C before compositional, collagen and sensory analysis.
Proximate composition, collagen content and sensory analyses
Moisture, intramuscular fat (IMF) and protein contents of the LT muscle were determined using the SMART System 5 microwave moisture drying oven, NMR SMART Trac rapid fat analyser (CEM Corporation, Matthews, NC, USA) and LECO FP328 (LECO Corp., St. Joseph, MI, USA) protein analyser, respectively (AOAC, 1990). Collagen content (i.e. total and soluble) was determined by quantitative determination of hydroxyproline by a colorimetric reaction (Kolar, Reference Maltin, Lobley, Grant, Miller, Kyle, Horgan, Matthews and Sinclair1990). Sensory analysis was carried out using a 10-person trained taste panel who had been selected for their sensory acuity; a detailed procedure is given in Mezgebo et al. (Reference Moloney and Richardson2016).
Muscle metabolic enzyme activity and muscle contractile and metabolic type
Glycolytic enzyme activities (lactate dehydrogenase (LDH) and phosphofructokinase (PFK)) and oxidative enzyme activities (isocitrate dehydrogenase (ICDH), citrate synthase (CS) and cytochrome c oxidase (COX)) were quantified spectrophotometrically according to Jurie et al. (Reference Jurie, Robelin, Picard and Geay2006). Muscle typing was assessed by determination of relative proportions of myosin heavy chains (MyHC) isoforms types I, IIA and IIX using high-resolution mini-gel electrophoresis as described by Picard et al. (Reference Priolo, Micol and Agabriel2011).
Statistical analysis
Data were subjected to analysis of variance using the GLM procedure of SPSS (IBM SPSS Statistics Version 20; International Business Machines (IBM) Corporation, Armonk, NY, USA) where the B, PS and their interaction were regarded as fixed factors. For data relating to sensory analysis, assessor and session effects were also included as fixed factors. The sensory data were also analysed using IMF as an overall linear covariate. Means were considered significant at P<0.05.
Results
Production and carcass traits
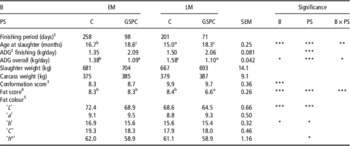
Production, carcass and subcutaneous fat colour data are presented in Table 1. There was an interaction (P<0.001) between B and PS with respect to age at slaughter. Thus for C bulls, age at slaughter was higher for EM than for LM, but for GSPC bulls, age at slaughter was similar for EM and LM. The ADG indoor (i.e. during finishing on the concentrate diet) was lower (P<0.001) for C than for GSPC. There was an interaction (P<0.05) between B and PS with respect to ADG overall. Thus for C bulls, ADG overall was lower for EM than for LM, but for GSPC bulls, ADG overall was similar for EM and LM. Conformation score was lower (P<0.001) for EM than for LM. There was an interaction (P<0.001) between B and PS with respect to fat score. Thus for C bulls, fat score was similar for EM and LM, but for GSPC bulls, fat score was higher for EM than for LM. Subcutaneous fat ‘L’ and ‘b’ values were higher (P<0.05) for EM than for LM, and for C than for GSPC. ‘h°’ value was higher (P<0.05) for C than for GSPC bulls.
Production, carcass and subcutaneous fat colour data of bulls from two breed types (B) (EM, LM), raised on two production systems (PS) (C, GSPC)

EM=early maturing; LM=late maturing; C=concentrate; GSPC=grass silage followed by pasture and then concentrate.
a,b,cMeans within rows (where interaction exists), assigned different superscripts differ significantly (P<0.05).
1 Days on ad libitum concentrates before slaughter.
2 Average daily live weight gain.
3 Conformation classes E+ (highest) to P− (lowest), (E+ is 15).
4 Fat score classes 5+ (highest) to 1− (lowest), (5+ is 15).
5 Subcutaneous fat colour:‘L’=lightness, 0 (black) to 100 (white); ‘a’=redness, +a (red) to –a (green); ‘b’=yellowness, +b (yellow) to –b (blue); ‘C’=chroma, higher ‘C’ values higher colour saturation; ‘h°’=hue, 0/360° is red, 90° is yellow, 180° is green and 270° is blue colour.
*P<0.05, **P<0.01, ***P<0.001.
Muscle pH, temperature, colour, proximate composition and collagen data
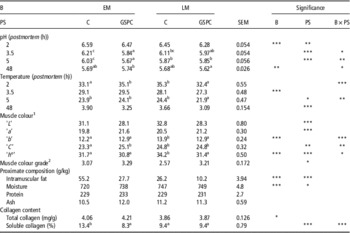
Muscle pH, temperature, colour, proximate composition and collagen data are presented in Table 2. At 2 h postmortem, muscle pH was higher for EM than for LM (P<0.001), and for C than for GSPC (P<0.01). There was an interaction (P<0.05) between B and PS with respect to pH at 3.5 h postmortem. Thus for EM, pH at 3.5 h was higher for C than for GSPC, but for LM, pH at 3.5 h was similar for C and GSPC. There was an interaction (P<0.01) between B and PS with respect to pH at 5 h postmortem. Thus for C bulls, pH at 5 h was higher for EM than for LM, but for GSPC bulls, pH at 5 h was lower for EM than for LM. There was an interaction (P<0.05) between B and PS with respect to ultimate pH (pHu), that is 48 h postmortem. Thus for C bulls, pHu was similar for EM and LM, but for GSPC bulls, pHu was higher for EM than for LM. There was an interaction (P<0.001) between B and PS with respect to muscle temperature at 2 h postmortem. Thus for C bulls, muscle temperature at 2 h was lower for EM than for LM, but for GSPC bulls, muscle temperature at 2 h was higher for EM than for LM. At 3.5 h postmortem, muscle temperature was higher (P<0.001) for EM than for LM. There was an interaction between B and PS with respect to muscle temperature at 5 h postmortem. Thus for C bulls, muscle temperature at 5 h postmortem was similar for EM and LM, but for GSPC bulls, muscle temperature at 5 h postmortem was higher (P<0.01) for EM than for LM. At 48 h postmortem, muscle temperature was higher (P<0.001) for C than for GSPC.
Postmortem pH and temperature, colour, proximate composition and collagen content of longissimus thoracis muscle from bulls from two breed types (B) (EM, LM), raised on two production systems (PS) (C, GSPC)

EM=early maturing; LM=late maturing; C=concentrate; GSPC=grass silage followed by pasture and then concentrate.
a,b,cMeans within rows (where interaction exists), assigned different superscripts differ significantly (P<0.05).
1 Muscle colour: ‘L’=lightness, 0 (black) to 100 (white); ‘a’=redness, +a (red) to –a (green); ‘b’=yellowness, +b (yellow) to –b (blue); ‘C’=chroma, higher ‘C’ values higher colour saturation; ‘h°’=hue, 0/360° is red, 90° is yellow, 180° is green and 270° is blue colour.
2 Muscle colour grades: 1 (extremely bright red) to 9 (extremely dark red).
*P<0.05, **P<0.01, ***P<0.001.
For muscle colour, ‘L’ value was higher (P<0.001) for C than for GSPC, and ‘a’ value was higher (P<0.001) for GSPC than for C. There was an interaction (P<0.05) between B and PS with respect to ‘b’, ‘C’ and ‘h°’ values. Thus for C bulls, ‘b’, ‘C’ and ‘h°’ values were lower for EM than for LM, but for GSPC bulls, ‘b’, ‘C’ and ‘h°’ values were similar for EM and LM. Muscle colour grade was higher (P<0.05) for GSPC than for C. The IMF content was higher (P<0.001) for EM than for LM, and for C than for GSPC. Moisture content was higher for LM than for EM (P<0.001), and for GSPC than for C (P<0.05). Total collagen was higher (P<0.05) for EM than for LM. There was an interaction (P<0.05) between B and PS with respect to percentage of soluble collagen. Thus for C bulls, percentage of soluble collagen was higher for EM than for LM, but for GSPC bulls, percentage of soluble collagen was similar for EM and LM.
Muscle metabolic enzyme activity and muscle contractile and metabolic type
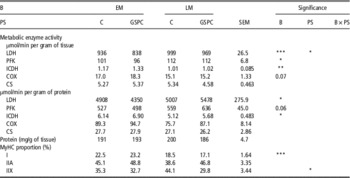
Muscle metabolic enzyme activity and MyHC proportion data are presented in Table 3. When enzyme activity was expressed as µmol/min per gram of tissue, LDH activity was higher for LM than for EM (P<0.001), and for C than for GSPC bulls (P<0.05); PFK activity was higher (P<0.05) for LM than for EM; ICDH activity was higher (P<0.01) for EM than for LM and COX activity tended to be higher (P<0.07) for EM than for LM. When enzyme activity was expressed as µmol/min per gram of protein, similar trends were observed although significance (P<0.05) was only reached in the case of the breed type effects on LDH and ICDH activities. Type I MyHC proportion was higher (P<0.001) for EM than for LM. Type IIX MyHC proportion was higher (P<0.05) for C than for GSPC.
Metabolic enzyme activity and myosin heavy chains (MyHC) proportion of longissimus thoracis muscle from bulls from two breed types (B) (EM, LM), raised on two production systems (PS) (C, GSPC)

EM=early maturing; LM=late maturing; C=concentrate; GSPC=grass silage followed by pasture and then concentrate; LDH=lactate dehydrogenase; PFK=phosphofructokinase; ICDH=isocitrate dehydrogenase; COX=cytochrome c oxidase; CS=citrate synthase; I=oxidative; IIA=oxido-glycolytic; IIX=glycolytic.
*P<0.05, **P<0.01, ***P<0.001.
Sensory characteristics
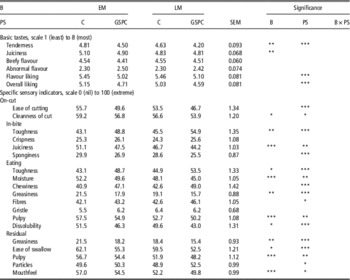
Muscle sensory data are presented in Table 4. Tenderness, flavour liking and overall liking were higher (P<0.001) for C than for GSPC. Tenderness and juiciness were higher (P<0.01) for EM than for LM. Ease of cutting (P<0.001) and cleanness of cut (P<0.05) were higher for C than for GSPC. Clean cut was higher (P<0.05) for EM than for LM. Toughness (both during in-bite and eating) was higher for GSPC than for C (P<0.001), and for LM than EM (P<0.05). Juiciness (during in-bite) was higher for C than for GSPC (P<0.01), and for EM than for LM (P<0.001). Sponginess was higher (P<0.001) for C than for GSPC. Moisture, greasiness and pulpiness (both during eating and residual), dissolubility, ease of swallow and mouthfeel were higher (P<0.05) for C than GSPC, and for EM than LM. Chewiness, fibrousness and residual particles were higher (P<0.05) for GSPC than for C. When the sensory data were analysed using IMF as a covariate, only beefy flavour was lower (P<0.05) and moisture and pulpiness (during eating) were higher (P<0.05) for EM than for LM (mean values of 4.39 v. 4.59, 50.8 v. 46.9 and 55.8 v. 52.0 for beefy flavour, moisture and pulpiness, respectively). Ease of swallow was higher (P<0.05) for C than GSPC (mean values of 60.0 v. 54.7).
Sensory characteristics of longissimus thoracis muscle from bulls from two breed types (B) (EM, LM), raised on two production systems (PS) (C, GSPC)

EM=early maturing; LM=late maturing; C=concentrate; GSPC=grass silage followed by pasture and then concentrate.
*P<0.05, **P<0.01, ***P<0.001.
Discussion
The bulls were slaughtered on reaching a mean group live weight estimated to achieve a target carcass weight of 380 kg which is required by some markets (Bord Bia, 2011). To reach the same target carcass weight, the LM bulls reared in the C, PS grew faster generally (i.e. higher ADG overall), reached the desired live weight earlier and therefore were slaughtered at a younger age compared with that of EM bulls on the same PS. This confirms that LM are better converters of a high energy diet to carcass weight (Keane, Reference Keane2011). However, when reared on the GSPC system, both breed types grew at a slower rate overall and took longer to reach the target live weight. Before slaughter (i.e. finishing period), the GSPC bulls grew faster compared with C bulls. The higher growth rate before slaughter for the GSPC bulls suggests compensatory growth during the indoor period as they had received a low energy diets (i.e. grass at pasture) before the finishing period compared with C bulls (Hornick et al., Reference Hornick, Van Eenaeme, Gérard, Dufrasne and Istasse2000).
When managed to the same carcass weight, carcasses from LM are characterised by having relatively more muscle and less fat compared with carcasses from EM (Keane, Reference Keane2011; O’Riordan et al., Reference Oddy, Harper, Greenwood and McDonagh2011). In the present study, the better carcass conformation of the LM bulls compared with the EM bulls can be attributed to a higher degree of muscularity in the LM carcasses. Fat score, which is a measure of subcutaneous fat thickness or degree of finish, was similar between EM and LM in the C group possibly because of rapid growth due to the high energy diet of the C diet. However, in the GSPC bulls, carcasses of the LM were leaner even though both breed types were finished on the same concentrate diet. In this case, it appears that during the concentrate finishing period the LM were physiologically ‘younger’ and therefore were depositing less fat than the physiologically ‘older’ EM (Warriss, Reference Warriss2010). With regard to subcutaneous fat colour, the higher lightness of fat from EM compared with LM, and for C compared with GSPC bulls may be attributed to the higher fat scores (i.e. subcutaneous fat thickness over the muscle) of the carcasses of EM and C groups. Fat yellowness, often associated with grass diets due to accumulation of carotenoids (Dunne et al., Reference Dunne, O’Mara, Monahan and Moloney2006), and reported to negatively influence consumer acceptability (Cornforth, Reference Cornforth1994), was unexpectedly higher for C bulls compared with GSPC bulls. However, although differences in fat yellowness due to B and PS were significant (P<0.05), values were numerically quite similar, suggesting that these colour differences would probably not be perceived by consumers. In the case of PS this may be attributed to the similarity in diets in the immediate pre-slaughter period.
The extent of postmortem pH decline in a muscle depends on the glycogen concentration at slaughter which in turn depends on the animal’s physical activity, nutrition and/or stress before slaughter (Klont and Lambooy, Reference Kolar1995; Warriss, Reference Warriss2010). In the present study, the influence of pre-slaughter physical activity and stress on muscle glycogen level would likely be minimal as the bulls were finished indoors and therefore were familiar with pre-slaughter handling; in addition the animals were carefully managed during transport and lairage. However, early postmortem (i.e. 2, 3.5 and 5 h), a lower pH was recorded in the muscle from GSPC bulls compared with C bulls. This may be related to the higher growth rate of GSPC bulls during the finishing period compared with C bulls, whereby muscle is believed to become more glycolytic during periods of compensatory growth (Brandstetter et al., Reference Brandstetter, Picard and Geay1998). Similarly, a higher pHu (i.e. pH at 48 h postmortem) was recorded in the muscle from EM breed types than LM breed types; however, there was an interaction between B and PS whereby the difference was observed in GSPC bulls and not in C bulls. The lower pHu for LM GSPC bulls could possibly reflect a higher muscle glycolytic potential as LM breed types are often characterised by an accelerated lean tissue growth compared with EM breed types when reared similarly (Hocquette et al., Reference Hocquette, Ortigues-Marty, Pethick, Herpin and Fernandez1998), in this case to a similar carcass weight. In agreement, glycolytic enzyme activity (LDH and PFK) were higher in muscle from LM breed types, as discussed further below. The higher muscle temperature at 3.5 h postmortem for EM than LM bulls, and at 5 and 48 h postmortem for C than GSPC bulls is most probably related to the carcass fat score as carcasses from EM and C groups had higher fatness scores than LM and GSPC groups, respectively. This is due to the fact that carcasses with a thicker fat cover cool more slowly than carcasses with a thinner fat cover (Warriss, Reference Warriss2010).
With regard to muscle colour, the lower lightness, higher redness, colour saturation and muscle colour grade (i.e. the higher the value, the darker the muscle) for the GSPC bulls could be explained by the higher age at slaughter (15.9 v. 18.5 months for C v. GSPC, respectively) as muscle tissue becomes darker and redder with increasing slaughter age (Dunne et al., Reference Dunne, O’Mara, Monahan and Moloney2006). The lower proportion of Type IIX MyHC, a characteristic of white muscles, for the GSPC bulls could also be responsible for the lower lightness of their LT muscle (Henckel et al., Reference Henckel, Oksbjerg, Erlandsen, Bartongade and Bejerholm1997). The darker muscle from GSPC compared with C bulls could also be related to the physical activity during the pasture feeding period (Priolo et al., Reference Sinclair, Lobley, Horgan, Kyle, Porter, Matthews, Warkup and Maltin2001). However, it should be mentioned that the postmortem pH profile of each muscle was within an acceptable pH range (Warriss, Reference Warriss2010), and thus meat from either group could not be considered to have experienced the ‘dark cutting beef’ condition.
The higher IMF content for EM compared with LM may be related to the intrinsic variations in the physiology of the animals (Oddy et al., Reference Picard, Barboiron, Chadeyron and Jurie2001) whereby at a similar live weight, the EM bulls were physiologically ‘older’ and therefore were depositing more IMF than the LM bulls, which were ‘younger’ physiologically, and therefore were depositing less IMF. The higher IMF content for C bulls reflects the higher energy content of the concentrate diet throughout their life (Oddy et al., Reference Picard, Barboiron, Chadeyron and Jurie2001). The lower collagen solubility for GSPC bulls may be related to the greater age at slaughter (Blanco et al., Reference Blanco, Jurie, Micol, Agabriel, Picard and Garcia-Launay2013) and lower IMF content (Nishimura, Reference O’Riordan, Crosson and McGee2015) as an increase in slaughter age increases the proportion of mature collagen crosslinks which in turn leads to a decrease in solubility of the collagen (McCormick, Reference McGee1994).
The higher glycolytic enzyme activities (LDH and PFK) for LM could be related to the higher overall growth rate of these bulls as an increase in growth rate early in life (i.e. period of rapid growth from one to 12 months) and in the further growing stage until sexual maturity is associated with an increase in muscle LDH activity (i.e. glycolytic metabolism) and a decrease in ICDH activity (i.e. oxidative metabolism) (Jurie et al., Reference Jurie, Ortigues-Marty, Picard, Micol and Hocquette1995). A similar explanation could be offered for the tendency towards lower oxidative enzyme activities (P<0.07) of ICDH and COX, marker enzymes for tricarboxylic acid cycle and mitochondrial electron transport respectively, and lower proportion of slow twitch Type I oxidative MyHC in the muscle from LM. The higher LDH activity (per gram of tissue) and proportion of Type IIX (fast twitch glycolytic) MyHC for C bulls could be explained by the higher overall growth rate which is mainly attributed to the continued provision of concentrate diet which in turn results in a more glycolytic muscular metabolism (Brandstetter et al., Reference Brandstetter, Picard and Geay1998; Cassar-Malek et al., Reference Cassar-Malek, Hocquette, Jurie, Listrat, Jailler, Bauchart, Briand and Picard2004). In addition, such higher glycolytic metabolism in muscle could also be associated with the longer concentrate finishing period of the C group compared with the GSPC group (i.e. concentrate finishing period of 98 and 71 days for GSPC and 258 and 201 days for C bulls of EM and LM, respectively). Even though grazing on pasture is associated with an increase in oxidative metabolism of muscle mainly due to higher physical activity (Therkildsen et al., Reference Thompson1998), the C and GSPC groups had similar oxidative enzyme activities. However, this was not unexpected as all bulls were finished indoors on the same concentrate diets for at least 71 days. In the present study, the fast twitch Type IIB glycolytic muscle MyHC was expressed in only six bulls (one in EM of C, none in EM of GSPC, one in LM of C and four in LM of GSPC bulls, data not shown) in contrast to a study by Picard and Cassar-Malek (Reference Picard and Cassar-Malek2009) in Blonde d’Aquitaine cattle(a French beef breed) in which Type IIB MyHC was usually identified.
The effect of PS on sensory characteristics was in agreement with Mezgebo et al. (Reference Moloney and Richardson2016). The higher tenderness scores for C bulls may be related to their younger age at slaughter (Bures and Barton, Reference Bures and Barton2012), higher IMF (Thompson, Reference Warriss2004) and collagen solubility (Cross et al., Reference Cross, Carpenter and Smith1973). A similar explanation could be given for the higher sensory ratings for ease of cutting, cleanness of cut, juiciness (in-bite), sponginess, moisture, greasiness, pulpiness, dissolubility, ease of swallow and mouthfeel, and lower ratings in toughness, chewiness, fibrousness and residual particles for C bulls compared with GSPC bulls. The contribution of IMF to these differences was shown by the lack of significant differences in sensory ratings (except for ease of swallow) between PS when the data were adjusted for IMF. In addition, the higher LDH activity for the C bulls compared with GSPC bulls could also be linked to the higher tenderness ratings of the C bulls, as an increase in glycolytic characteristics of a muscle often leads to an increase in eating quality of meat mainly by accelerating the postmortem tenderisation process of the muscle (Maltin et al., Reference Marren, McGee, Moloney, Kelly and O’Riordan2001). The sensory analysis also showed that the sensory data ratings were internally consistent, especially for tenderness, that is higher tenderness score (during the basic taste) was consistent with the lower toughness scores (both during in-bite and eating). Even though all bulls were finished indoors, the lower flavour liking and overall liking ratings of beef from GSPC bulls could possibly be associated with the inclusion of grass diet before the finishing period as beef from pasture-based systems is often reported to be less preferred by consumers (Griebenow et al., Reference Griebenow, Martz and Morrow1997).
The higher sensory ratings in tenderness and juiciness, and associated higher scores in cleanness of cut, moisture, greasiness, pulpiness, dissolubility, ease of swallow and mouthfeel, and lower scores in toughness for EM could be related to their higher carcass fat cover and IMF content compared with LM. Similar findings were reported by Sinclair et al. (Reference Therkildsen, Vestergaard, Jensen, Andersen and Sejrsen2001) in beef from Aberdeen-Angus and Charolais breeds. In the current study, beef from LM was rated to be lower in tenderness, juiciness and related sensory quality attributes compared with beef from EM even though the LM were younger at slaughter. In addition, LM muscle had higher glycolytic (LDH and PFK) and lower oxidative (ICDH and COX) metabolic enzyme activities and lower Type I MyHC proportion than EM, and an increase in glycolytic (Maltin et al., Reference Marren, McGee, Moloney, Kelly and O’Riordan2001) and decrease in oxidative (Monin and Ouali, Reference Nishimura1991) characteristics of a muscle can lead to superior eating quality in meat. When IMF was included as a covariate in the sensory data analysis, most of the observed differences disappeared, confirming that IMF content was the major contributor to differences in meat tenderness and juiciness between EM and LM breeds (Sinclair et al., Reference Therkildsen, Vestergaard, Jensen, Andersen and Sejrsen2001).
Conclusion
When managed to a similar carcass weight EM were older at slaughter, had higher carcass fat scores and IMF content and produced beef that was rated more tender and juicier by trained sensory panellists than LM. Furthermore, C bulls were younger at slaughter, had higher carcass fat scores, IMF and soluble collagen content and produced beef rated more highly by a trained sensory panel than GSPC bulls. While variations in sensory characteristics due to breed maturity and dietary inclusion of grass silage followed by pasture exist, IMF contributed to much of the variation and it remains to be established whether or not the differences would be perceptible to untrained consumers.
Acknowledgements
The senior author acknowledges receipt of a Teagasc Walsh Fellowship. The contributions of Dr Alan Kelly (UCD), Mr Declan Marren (Teagasc Animal and Grassland Research and Innovation Centre, Grange) and Ms Karen Hussey (Teagasc Ashtown Food Research Centre) are also acknowledged. The assistance of staff and management at Kepak Group, Clonee, County Meath who facilitated sample collection and carcass measurement is greatly appreciated.