

1. Introduction
1.1 The proteasomal protein degradation pathway
The maintenance of cellular homeostasis requires the concerted action of multiple interconnected biochemical pathways, enabling the cell to perform its required functions and undergo appropriate developmental transitions, while responding to changing environments and stressors. Specifically, the proteins that comprise the cellular machinery, as well as the regulatory proteins that mediate their activity, must be maintained at appropriate levels to ensure proper functioning of the pathways they dictate. A major contributor to the flux of the proteome is the proteasome protein degradation system, which includes a complex network of ubiquitin (Ub) conjugating enzymes and the proteasome proteolytic machinery, that selectively degrades the tagged proteins into peptides, which can then be recycled for new protein synthesis (Glickman & Ciechanover, Reference Glickman and Ciechanover2002; Goldberg, Reference Goldberg2003). Several factors influence if a protein is targeted for degradation, such as genetic mutations and errors in protein synthesis (Kostova & Wolf, Reference Kostova and Wolf2003), or damage as a result of different external or endogenous stresses, such as oxidation or aging (Pickering & Davies, Reference Pickering and Davies2012). If misfolded, mutated and damaged proteins are not rapidly removed from the cell, they can cause further damage by forming toxic aggregates, which are known to contribute to neurodegenerative diseases such as Alzheimer's and Parkinson's disease (Schwartz & Ciechanover, Reference Schwartz and Ciechanover2009). In addition to abnormally folded proteins, the levels of many important regulatory proteins, such as cell cycle regulators and tumor suppressors, must be carefully balanced during normal development, as disruption of their equilibrium can contribute to tumor development and cancers (Schwartz & Ciechanover, Reference Schwartz and Ciechanover2009).
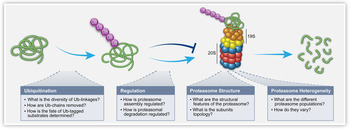
Protein degradation predominantly centers around the 26S proteasome, a 2·5 MDa protein complex responsible for recognizing and degrading proteins that have been targeted for destruction (Schwartz & Ciechanover, Reference Schwartz and Ciechanover2009). The 26S proteasome complex comprises the 19S regulatory particle (RP), responsible for the recognition and unfolding of proteasomal substrates, and the 20S core particle (CP), a barrel shaped catalytic entity that accepts the unfolded substrates and degrades them into small peptides (Fig. 1). Proteins are targeted for degradation by the 26S proteasome by the covalent linkage of Ub, a small 8·5 kDa regulatory protein, onto the substrate via a repetitive enzymatic cascade (Fang & Weissman, Reference Fang and Weissman2004). Once tagged with a poly-Ub chain, substrates are recognized by Ub receptors (UbRs); either ‘shuttling factors’, which direct the tagged proteins to the 26S proteasome, or integral subunits of the 19S RP itself. The poly-Ub chains are then removed by various deubiquitinating enzymes (DUBs), allowing recycling of Ub monomers, while the substrate is unfolded and directed to the 20S CP for degradation (Finley, Reference Finley2009) (Fig. 1).
Overview of the 26S proteasome protein degradation pathway. Proteins are tagged multiple times with Ub, leading to the formation of covalently attached poly-Ub chains on the substrate. These tagged substrates are then directed to the 26S proteasome, where they are recognized, deubiquitinated and unfolded by the 19S RP, followed by translocation to the 20S CP where they are degraded into peptides. For each of these stages the biological questions that were addressed using MS techniques are highlighted.

Our understanding of the finer details of this complicated and essential pathway has greatly improved in recent years, due in large to dramatic improvements in the technologies available for studying complex biological systems. Here, we will specifically discuss the contribution of mass spectrometry (MS). We will focus on distinct steps along the Ub-proteasome degradation pathway and describe the MS-based techniques that were applied to reveal novel biological input on these processes (Fig. 1).
1.2 A general overview of MS
The fundamental principle of MS is the measurement of the mass of a molecule, from which multiple levels and types of information can be gained. The foundation of the technique involves the ionization of molecules i.e. the transformation of molecules from solution to the gas phase. The generated ions are then focused into a beam and directed into a collision cell, wherein their dissociation can be induced. Subsequently, the masses of the intact ions and/or their fragments are mass analyzed based on their resulting mass to charge ratio (m/z). Below we provide a brief overview of these steps.
1.2.1 Sample preparation
Prior to MS analysis, different sample preparation methods can be utilized depending on the question being addressed. A substantial proportion of experiments require the identification, quantification and sequence analysis of individual proteins from a heterogeneous sample, such as whole cell protein extracts. One routine approach involves the bottom-up method, which utilizes enzymatically produced peptides of complex protein mixtures that are subjected to liquid chromatography (LC) separation and two steps of MS analysis. In the first MS acquisition, the masses of the intact peptides are determined, while the tandem MS (MS/MS) fragmentation process gives rise to cleavage products that break along peptide bonds, producing information on the identity and sequence of the protein as well as its modifications.
The most commonly used enzyme for digestion is trypsin, which is known to cleave peptides exclusively at the carboxyl side of lysine and arginine residues, thus generating unique, reproducible peptides, which can be identified by MS, and assigned to their parent proteins using advanced search algorithms and existing databases of known and predicted tryptic peptides (Gillet et al. Reference Gillet, Leitner and Aebersold2016; Vandermarliere et al. Reference Vandermarliere, Mueller and Martens2013). Tryptic digestion is a cornerstone of modern quantitative proteomics, and is often used in combination with other techniques to create advanced MS workflows that can address complex biological questions.
Alternatively, the top-down approach considers a protein sample without in-solution digestion, introducing into the mass spectrometer intact proteins or protein complexes. The major advantage of using this approach is its ability to maintain weak non-covalent interactions between proteins and associated biomolecules such as protein partners, drugs and cofactors (Sharon, Reference Sharon2013). This method provides details on the existence of multiple isoforms of single proteins as well as structural data on protein assemblies, revealing their subunit stoichiometry, protein composition, interaction partners, subunit topology and overall architecture.
1.2.2 Ionization methods
Two main methods exist for the ionization of biomolecules; electrospray ionization (ESI), in which aqueous protein solutions are subjected to strong electric currents, causing the ejection of liquid droplets into the gas phase, followed by desolvation and the accumulation of charge on the protein surface (Fenn et al. Reference Fenn, Mann, Meng, Wong and Whitehouse1989; Gaskell, Reference Gaskell1997; Wilm & Mann, Reference Wilm and Mann1996), and matrix-assisted laser desorption/ionization, where protein samples are applied to a dry crystalline matrix and volatilized by laser pulses (Karas & Hillenkamp, Reference Karas and Hillenkamp1988; Zenobi & Knochenmuss, Reference Zenobi and Knochenmuss1998). In general, ESI is the method of choice when studying complex protein samples, as it provides a more gentle ionization process which maintains non-covalent interactions (Loo, Reference Loo1997). In addition, the advent of nanoESI drastically reduced the required sample size and increased the tolerance of the ionization process to the presence of salts found in complex biological buffers (Juraschek et al. Reference Juraschek, Dülcks and Karas1999), thus allowing the analysis of protein complexes in their native state. The added advantage of ESI is the capacity to couple an LC column to the electrospray needle, a technique known as LC-MS. This permits the separation of peptides or proteins prior to their entry into the mass spectrometer, a method that is particularly relevant in the analysis of complex peptide samples. After the sample has been ionized, the generated ions then enter the mass spectrometer under high vacuum, and are separated based on their m/z by a mass analyzer.
1.2.3 Mass analyzers and MS/MS
Several types of mass analyzers can be used, such as quadrupole, time-of-flight, Fourier transform ion cyclotrons and ion traps, such as the Orbitrap. They each have different strengths and weaknesses, and have been previously reviewed in excellent detail (Aebersold & Mann, Reference Aebersold and Mann2003; Benesch et al. Reference Benesch, Ruotolo, Simmons and Robinson2007; Domon & Aebersold, Reference Domon and Aebersold2006). Each of these mass analyzers can be used independently, or they can be coupled together in tandem in a hybrid instrument, facilitating MS/MS analysis.
In MS/MS, after the ions have been separated in the first mass analyzer, specific ions, also known as precursor ions, can be selected and fragmented to produce product ions, which are then separated and detected by the second mass analyzer. Various fragmentation methods can be utilized depending on the required outcome, such as surface-induced dissociation (Cooks et al. Reference Cooks, Terwilliger, Ast, Beynon and Keough1975; Zhou & Wysocki, Reference Zhou and Wysocki2014), electron-capture dissociation (Zubarev & Kelleher, Reference Zubarev and Kelleher1998), electron transfer dissociation (Syka et al. Reference Syka, Coon, Schroeder, Shabanowitz and Hunt2004) or UV photodissociation (Brodbelt, Reference Brodbelt2014). However, the most commonly used method is collision-induced dissociation (CID), in which neutral gas molecules are collided with the selected ions increasing their internal energy. When analyzing peptides, as done in bottom-up proteomic approaches, this method breaks the peptide bonds, which in turn enables sequence identification. When used for the analysis of protein complexes, the CID approach leads to the disruption of non-covalent associations and consequently to the dissociation of individual subunits and generation of ‘stripped complexes’ (Benesch, Reference Benesch2009). Nevertheless, in both cases, the detection and identification of the precursor and product ions provides valuable information.
1.2.4 MS workflows for investigating the proteasome system
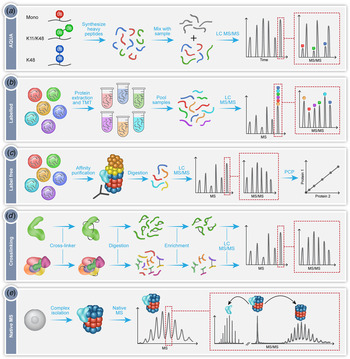
Here we will describe in detail several MS workflows that have been specially designed and adapted for the study of protein complexes, with a focus on their application for dissecting the details of the proteasome mediated degradation pathway. Specifically, we will describe recent advances in our understanding of the ubiquitination mechanism, the regulation of proteasome assembly and degradation process, the overall structure of the 26S proteasome, as well as the heterogeneity of proteasome populations present within the cell (Fig. 1). The methodologies described in these studies include the use of quantitative proteomics approaches such as absolute quantification using the AQUA strategy (Fig. 2a ), isobaric labeling of protein extracts (Fig. 2b ) and label free quantification (Fig. 2c ), as well as structural MS approaches like crosslinking (Fig. 2d ) and native MS (Fig. 2e ). The use of these MS workflows, often in combination with other biochemical and cell biology analyses, have driven our fundamental understanding of this essential pathway, highlighting the relevance and versatility of MS as an exceptional technique for addressing multiple aspects of a complex and dynamic cellular pathway.
MS workflows utilized in the exploration of the proteasomal protein degradation pathway. (a) Absolute quantification of ubiquitination using the AQUA technique, in which synthetic heavy peptides corresponding to the types of Ub-linkages are produced, for example mono-Ub (red), heterogeneous poly-Ub containing K11 and K48 linkages (green), or homotypic poly-Ub containing only K48 linkages (blue). Known quantities of these peptides are then combined with the peptides from the sample under investigation (gray) and analyzed by LC-MS/MS. The synthetic heavy peptide and light analyte peptide will have the same retention time during chromatography, thus eluting in the same peak. The peaks can be individually selected and subject to MS/MS, with the mass difference between the light and heavy peptides now distinguishable. Consequently, the ratio between the native peptide and the isotope labeled AQUA standard peptide enables absolute quantification. (b) Labeling of protein extracts using TMT. Proteins are extracted from several cell lines under investigation, followed by the differential labeling of each extract with a unique isobaric tag. The samples are digested and the produced peptides from each sample pooled together. This mixture is then analyzed by LC-MS/MS with the same peptide from each sample falling under the same m/z peak. Selection of this peak followed by MS/MS leads to fragmentation and separation of the differently tagged peptides. The relative peptide levels from each sample can then be quantified and compared. (c) Label free quantification of isolated protein complexes. In this method the different samples are analyzed separately and compared. Often, the protein complex of interest is extracted from a cell lysate using affinity purification. The complex is then digested and subjected to LC-MS/MS allowing identification of the components of the complex and any modifications they contain. By measuring the intensity or ion counts of the precursor ions and comparing this value across samples, relative quantification is achieved. PCP can then be performed to determine the composition of the protein complexes under investigation. (d) Crosslinking coupled MS of proteins (top) and protein complexes (bottom). The addition of crosslinkers to the proteins of interest will cause the formation of covalent bonds between the crosslinker and two amino acids (black lines). These can be within the same protein or between two different proteins. The crosslinked samples are then digested to produce peptides, some of which will contain the crosslink. Uncrosslinked peptides can be removed during an enrichment step. The crosslinked peptides are then subjected to LC-MS/MS, with specific peak selection and fragmentation allowing the identification of the location of the crosslink, and consequently the determination of the proximity of the amino acids involved. (e) Native MS of intact protein complexes. Whole protein complexes are isolated, purified and subjected to MS analysis. The intact mass of the complex reflects the homogeneity and stability of the sample as well as its subunit stoichiometry. Isolation of peaks followed by MS/MS fragmentation leads to the dissociation of distinct associating proteins or subunits, which can then be individually identified. This step also enables differentiation between core and peripheral subunits as well as revealing protein–protein connectivities.

2. The ubiquitination process
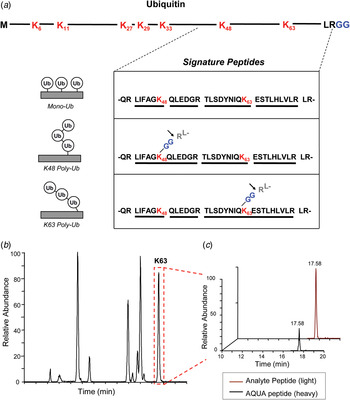
The first stage of the protein degradation pathway is the recognition and ubiquitination of proteins that are destined for destruction by the 26S proteasome. Ubiquitination is a complex procedure, involving a three step enzymatic cascade coordinated by multiple enzymes (Fang & Weissman, Reference Fang and Weissman2004). These enzymes can be divided into three main families; Ub activating enzymes (E1), conjugating enzymes (E2) and ligating enzymes (E3). The mechanism of function of each of these enzymes has been described in detail (Fang & Weissman, Reference Fang and Weissman2004), with the final result of the first round of the process being the formation of a covalent isopeptide bond between the C-terminal glycine of Ub, and a lysine residue in the substrate. Subsequent rounds of ubiquitination lead to the linkage of additional Ub monomers, attached to one of the seven lysine residues in Ub itself (K6, K11, K27, K29, K33, K48, K63) or the N-terminal methionine, forming a poly-Ub chain on the protein substrate (Fig. 3a ). These linkages can either be homotypic i.e. through the same K residue in all the Ub monomers in the chain, or heterotypic i.e. a combination of multiple types of linkages resulting in mixed or branched Ub chains. Recognition of these different Ub chain structures by Ub-binding proteins/Ub receptors determines whether the tagged substrate will be directed to the 26S proteasome for degradation, or towards other cellular pathways in which Ub-tagged proteins have been shown to play a role, such as cell cycle progression and DNA repair (Pickart & Fushman, Reference Pickart and Fushman2004). Some of the fine details regarding the diversity of poly-Ub chains on substrates, as well as how these different poly-Ub chain types can direct a substrate to a particular fate, were described using MS, by defining the precise K-linkages on a ubiquitinated substrate along with quantifying their amount within a single sample using a technique known as AQUA (Figs 2a and 3) (Kirkpatrick et al. Reference Kirkpatrick, Gerber and Gygi2005, Reference Kirkpatrick, Hathaway, Hanna, Elsasser, Rush, Finley, King and Gygi2006).
Quantification of Ub-linkages using AQUA and LC-MS/MS. (a) Ubiquitin contains seven lysine (K) residues in its primary sequence (highlighted in red) and a C-terminal diglycine (GG) motif (highlighted in blue). Tryptic digestion will cleave after K and R residues, producing unique peptides for mono-Ub (top), K48 poly-Ub (middle) and K63 poly-Ub (bottom) linkages, as well as after the R at the C-terminus of Ub (indicated by arrow), leading to the identifiable –GG motif on K48 and K63 linked peptides. These signature peptides are isotopically labeled and added to a sample at known concentrations, followed by analysis by LC-MS/MS. (b) A representative analysis of a peptide sample containing free K63-linked poly-Ub chains, showing the retention time of K63 linked Ub peptides (boxed in red) during LC-MS. Both the heavy signature peptides and light analyte peptides have the same retention time. (c) SRM (MS/MS) analysis of the K63 peak showing the mass difference between the heavy AQUA peptide and the light analyte peptide. Due to the known concentration of the AQUA peptide added to the sample, the amount of analyte peptide can be quantified. Reproduced and adapted with permission from (Kirkpatrick et al. Reference Kirkpatrick, Hathaway, Hanna, Elsasser, Rush, Finley, King and Gygi2006).

2.1 The use of AQUA to quantify Ub linkages
AQUA is a quantitative method, involving the absolute quantification of peptides within a trypsin digested heterogeneous sample (Gerber et al. Reference Gerber, Rush, Stemman, Kirschner and Gygi2003; Kirkpatrick et al. Reference Kirkpatrick, Gerber and Gygi2005). This is achieved by pre-designing signature peptides that contain the tryptic peptide sequence and modification of interest (if relevant), and synthesizing them to contain stable heavy isotopes (Fig. 3a ). The signature peptides are then added into the sample under investigation at a known concentration and analyzed by LC-MS/MS. In the first stage of the MS analysis, both the heavy labeled peptide and the light analyte peptide will co-elute from the chromatography column with the same retention time, as their biochemical properties are identical (Fig. 3b ). Selected reaction monitoring (SRM) is then performed, in which both the heavy and light peptide precursor ions are specifically selected and subjected to MS/MS, with the product ions from MS/MS detected and analyzed (Fig. 3c ). The small mass difference between the heavy and light peptides can be distinguished by the mass spectrometer, and by comparing their relative intensities, absolute quantification of the peptide levels in the sample can be achieved (Gerber et al. Reference Gerber, Rush, Stemman, Kirschner and Gygi2003; Kirkpatrick et al. Reference Kirkpatrick, Gerber and Gygi2005).
This method was successfully applied to address the question of Ub linkages by the design of isotope-labeled tryptic peptides corresponding to the types of K-linkages possible (Figs 2a and 3) (Kirkpatrick et al. Reference Kirkpatrick, Hathaway, Hanna, Elsasser, Rush, Finley, King and Gygi2006). The final amino acids at the C-terminus of Ub are LRGG, and as described earlier, the C-terminal G forms a covalent bond with any of the seven K residues in Ub during the formation of poly-Ub chains. Therefore, if a polyubiquitinated substrate is digested with trypsin, one of the cleavage events will occur between the R and the first G at the C-terminus of Ub. This will yield peptides in which the modified K in the substrate, and the modified K in the attached Ubs, will have a covalently linked -GG motif (Fig. 3a ). This motif will therefore add additional mass to the peptide, permitting its identification by MS, and differentiation from peptides that have not been modified with Ub. Thus, by designing AQUA peptides to mimic these -GG linkages, and adding them to the sample under investigation, the quantities of each type of Ub linkage and their location on a particular substrate can be accurately determined (Figs 2a and 3) (Kirkpatrick et al. Reference Kirkpatrick, Gerber and Gygi2005, Reference Kirkpatrick, Hathaway, Hanna, Elsasser, Rush, Finley, King and Gygi2006). More recently, a monoclonal antibody designed to recognize –GG modifications on isopeptides was developed, enabling the enrichment of these modified peptides from whole cell tryptic digests prior to MS analysis, dramatically improving the number of identified ubiquitination events across the entire proteome (Kim et al. Reference Kim, Bennett, Huttlin, Guo, Li, Possemato, Sowa, Rad, Rush, Comb, Harper and Gygi2011).
To demonstrate the utility of the AQUA method, the precise quantification of the types of Ub-linkages present on the model substrate cyclin B1, a cell cycle regulator, was performed (Kirkpatrick et al. Reference Kirkpatrick, Hathaway, Hanna, Elsasser, Rush, Finley, King and Gygi2006). The authors demonstrated that this substrate is tagged by multiple mono-Ub and heterogeneous short chain poly-Ubs, although only through K11, K48 or K63, and that this spread of linkages is sufficient for proteasomal recognition and degradation. This was in contrast to a previous hypothesis that only homotypic K48 poly-Ub linkages target substrates for proteasomal degradation (Pickart & Fushman, Reference Pickart and Fushman2004). The authors took this analysis further by investigating the relationship between the E2 and E3 enzymes, which coordinate the ubiquitination of cyclin B1, in order to understand how the proteasomal targeting signal of the previously described ubiquitination is generated, leading to the degradation of cyclin B1.
The ubiquitination of cyclin B1 is known to be coordinated by the anaphase-promoting complex (APC), a multi-subunit complex of E3 ligases, which interacts with E2 conjugating enzymes Ubc4 or UbcH10 (Peters, Reference Peters2002). By using Ub-AQUA peptides and comparing the resulting ubiquitination of cyclin B1 in vitro, when either Ubc4 or UbcH10 was present, it was revealed that Ubc4 produces twice the amount of K48 linkages, while UbcH10 favors the formation of K11 linkages, although both enzymes produce the same level of K63 linkages (Kirkpatrick et al. Reference Kirkpatrick, Hathaway, Hanna, Elsasser, Rush, Finley, King and Gygi2006). Other types of K linkages i.e. K6, K27, K29 and K33, were either present in minor quantities or not detectable at all, indicating that the APC restricts the type of K-linkages formed on cyclin B1. Time dependent analysis of ubiquitination events revealed that cyclin B1 is modified by several mono-Ub linkages first, followed by their extension to short poly-Ub chains over time. These are then recognized by various UbRs, which direct the substrate to the 26S proteasome for degradation. The authors concluded that while the types of K-linkages formed on a substrate is restricted by E3 enzymes, the proportions of these linkages i.e. mono/poly-Ub, depends on the E2 enzymes present. This method has since been utilized in other studies, for example in the discovery that homotypic K11 linkages are not capable of targeting a substrate for proteasomal degradation while heterotypic K11/K48 poly-Ub are (Grice et al. Reference Grice, Lobb, Weekes, Gygi, Antrobus and Nathan2015).
The fates of ubiquitinated substrates are not limited to proteasomal degradation, indeed Ub-AQUA MS played a role in the demonstration that K11 and K63 linkages are involved in endocytosis (Boname et al. Reference Boname, Thomas, Stagg, Xu, Peng and Lehner2010). Many more examples than can be described here have benefited from the development of the Ub-AQUA MS method, clearly demonstrating its widespread applicability (Bennett et al. Reference Bennett, Rush, Gygi and Harper2010; Xu et al. Reference Xu, Duong, Seyfried, Cheng, Xie, Robert, Rush, Hochstrasser, Finley and Peng2009). Overall, by utilizing the specificity of AQUA peptides and the high resolving power of the new generation mass spectrometers, this approach enabled the definition of the complex relationships between the various possible Ub-linkages, their outcomes, and the roles of the enzymes involved in the ubiquitination cascade, significantly increasing the cumulative knowledge surrounding the ubiquitination process. We anticipate that this methodology will continue to be used to explore the molecular details of this and other dynamic biological processes.
2.2 In vivo labeling to explore the effects of deubiquitination
Deubiquitination involves the enzymatic removal of the conjugated Ub moiety from a tagged substrate, providing a proofreading mechanism that enhances the fidelity of the degradation process. DUBs also allow for recycling of the Ub moieties from proteins prior to their final commitment to degradation (Finley et al. Reference Finley, Ulrich, Sommer and Kaiser2012). To date many different members of the DUB family have been identified (Finley et al. Reference Finley, Ulrich, Sommer and Kaiser2012; Reyes-Turcu et al. Reference Reyes-Turcu, Ventii and Wilkinson2009) and it is known that they can act either as independent entities or as part of the proteasome complex. For example the integral 19S subunit Rpn11 and proteasome associated protein Usp6 both display DUB activity, rescuing Ub from being degraded by the proteasome along with the substrate (Sakata et al. Reference Sakata, Stengel, Fukunaga, Zhou, Saeki, Förster, Baumeister, Tanaka and Robinson2011; Verma et al. Reference Verma, Aravind, Oania, Mcdonald, Yates, Koonin and Deshaies2002). While the mechanistic details of the deubiquitination process have been determined, greater knowledge of the global role played by DUBs in a cellular context is imperative for our understanding of the diverse effects of this enzyme family.
To address this question, a multiplexed MS approach incorporating isobaric labeling and quantitative proteomics was developed, permitting the precise, comparative measurement of specific protein levels from several different cell lines in a single experiment (Isasa et al. Reference Isasa, Rose, Elsasser, Navarrete-Perea, Paulo, Finley and Gygi2015). This proteomic workflow utilized tandem mass tagging (TMT) of enzymatically digested whole cell protein extracts followed by LC-MS/MS (Fig. 2b ). TMT tags are made up of four components: a reactive group on one end that reacts with a protein to covalently couple the tag, a reporter ion at the other end that is isotopically labeled, and between them a cleavable linker to permit the release of the reporter ion during MS/MS as well as a mass normalization tag that ensures all the TMTs used in an experiment will have the same mass (Dayon et al. Reference Dayon, Hainard, Licker, Turck, Kuhn, Hochstrasser, Burkhard and Sanchez2008). Due to the availability of up to 10 different isotope-reporter ions, it is possible to label and analyze 10 samples each with a different tag, thus providing a multiplexed platform from which multiple cell lines can be simultaneously compared. After tagging, the samples are pooled together and subjected to LC-MS/MS. In the first round of MS, the same peptide being analyzed across the samples will have the same mass regardless of the TMT tag attached, and therefore they will all fall into a single ion peak. However, upon selection of this ion peak followed by MS/MS, the cleavable linker will allow release of the reporter ions, and the subsequent mass shifts of each separate tag will allow discrimination between the same peptide from all the samples under investigation, as well as quantification of their relative amounts (Fig. 2b ).
In order to address the question of the role of DUBs in a global context, this method was applied to analyze changes in the proteome of 9 yeast strains in which specific DUBs had been knocked out, by comparison with the proteome of wild type cells (Isasa et al. Reference Isasa, Rose, Elsasser, Navarrete-Perea, Paulo, Finley and Gygi2015). The authors were able to quantify thousands of proteins with high reproducibility, noting significant changes in certain protein levels in the absence of specific DUBs. For example, they demonstrated that the global pool of Ub-conjugated proteins is differentially effected when different DUBs are knocked out, with the most drastic reduction in Ub-conjugate level seen in the Ubp6 knockout cells. This suggests that in the absence of Ubp6, the 26S proteasome degrades the Ub chain along with the substrate, indicating an essential role for Ubp6 in maintaining the overall pool of free Ub in the cell. Moreover, the ability to simultaneously quantify and compare the levels of thousands of proteins in each cell line lead to the identification of novel interaction pathways for certain DUBs. For example, aside from its known deubiquitinating activities, Ubp3 appears to be involved in mitochondrial regulation via interactions with the cytochrome c oxidase complex, as upon Ubp3 knockout significant up-regulation of the members of the cytochrome c oxidase complex was observed. In addition, knockout of several DUBs, including Ubp3, Ubp10 and Otu2, affected the inorganic phosphate pathway, by causing downregulation of several phosphate receptors as well as certain phosphatases and kinases, indicating a clear role for these DUBs in inorganic phosphate signaling regulation (Isasa et al. Reference Isasa, Rose, Elsasser, Navarrete-Perea, Paulo, Finley and Gygi2015). Taken together, these data demonstrate the power of this multiplexed MS platform, which exploits the simultaneous identification of thousands of proteins from 10 different samples to identify novel biological roles for certain DUBs. Future expansion of this technology to include an even wider range of available isobaric tags will enable the direct comparison of many more different cell states and conditions, which will undoubtedly drive forward our understanding of complex protein interaction networks.
2.3 Identifying UbR/proteasome complexes using label free quantitative MS
The recognition of Ub modifications on protein substrates is performed by UbRs, which as described earlier are either ‘shuttling factors’, which independently escort Ub-tagged proteins to the proteasome for degradation, or integral subunits of the 19S RP. Five different families of UbR have been described; the shuttling factors Rad23, Dsk2 and Ddi1, and the 19S subunits Rpn10 and Rpn13, with various isoforms identified in each family. These UbRs have been shown to have different affinities for certain substrates (Verma et al. Reference Verma, Oania, Graumann and Deshaies2004), and the mechanism of their recognition has been previously reviewed in depth (Finley, Reference Finley2009). Until recently however, the relationship between the various UbRs, their ability to recognize different substrates and direct them to the proteasome population was unclear and challenging to study, given the transitory nature of many of these interactions and the complexity of the network as a whole.
To address this issue, a label-free MS-based approach was developed to examine the interactions between the different UbRs with the 26S proteasome (Fig. 2c ) (Yu et al. Reference Yu, Yang, Wang, Guan, Fang, Liu, Walters, Kaiser and Huang2016). Label-free proteomics involves the identification, quantification and comparison of proteins between multiple samples without the use of isobaric tags or labels. The method relies on the comparison of precursor signal intensity or spectral counting. Often, proteins of interest are isolated from cells using various methods such as affinity purification, which allows the purification of intact protein complexes and their interacting partners. The purified proteins are then digested and analyzed by LC-MS/MS followed by data analysis, in which the peptide ion peaks are integrated and used to measure the relative amounts of the proteins present in each sample. This technique allows the determination of the identity of interacting proteins as well as subunit stoichiometry within a complex (Fabre et al. Reference Fabre, Lambour, Bouyssié, Menneteau, Monsarrat, Burlet-Schiltz and Bousquet-Dubouch2014a).
In order to examine the interactions between the proteasome and the UbRs, an MS workflow was designed to incorporate affinity purification of specific complexes from whole cell extracts, followed by LC-MS/MS for the identification of the proteins present in each complex. As many of the interactions between the 26S proteasome and UbRs are dynamic, the authors included a mild crosslinking step to capture these transient complexes. They utilized low levels of formaldehyde, a small membrane permeable compound capable of non-specific crosslinking of protein complexes (crosslinking is discussed in further detail below) (Sutherland et al. Reference Sutherland, Toews and Kast2008). By using this mild crosslinker, dynamic interactions between proteins can be captured, thus allowing short lived complexes to be isolated and studied. An additional component of this MS workflow is the use of tandem affinity purification to capture specific complexes. By incorporating affinity tags onto two different subunits of the complexes under investigation, it is possible to pull out these specific complexes from the cellular milieu using antibodies, thus enabling the preparation of cleaner samples and consequently acquiring better data with reduced background. As the authors were interested in studying UbR/proteasome complexes, they incorporated affinity tags on the UbRs of interest as well as on the 26S proteasome, thus allowing tandem affinity purification to pull out UbR/proteasome complexes as opposed to each entity separately (Yu et al. Reference Yu, Yang, Wang, Guan, Fang, Liu, Walters, Kaiser and Huang2016). They generated 7 cell lines, each expressing tagged Rpn11 to pull out the 26S proteasome, as well a different tagged UbR. After the complexes were purified, they were enzymatically digested and the generated peptides were separated and identified using LC-MS/MS. Quantification of the complexes revealed that while each of the UbRs bound to the 26S proteasome, distinct differences in their binding stoichiometries were apparent. For example, hHR23B, an isoform of the Rad23 family, bound significantly more 26S proteasome compared with the other shuttling factors, indicating that this UbR may be the primary UbR responsible for escorting Ub-tagged substrates to the 26S proteasome for degradation. In addition, the authors identified several proteasome interacting proteins (PIPs) that co-purified with the UbR/proteasome complexes. While some of these PIPs were identified across all the samples, indicating that they interact with all the UbRs under investigation, distinct subsets of these PIPs selectively engaged with specific UbRs. For example, subunits of the CCT complex, a large protein folding chaperonin, were shown to interact only with Ddi2, indicating that Ddi2 is responsible for shuttling either misfolded CCT substrates, or the CCT subunits themselves to the 26S for degradation. By combining tandem affinity purification with MS, the authors were able to describe the interaction network between UbRs, the 26S proteasome, and other PIPs, revealing connections between different cellular pathways and specific UbRs, thus providing novel insights into the coordination of substrate recognition and targeting to the 26S proteasome (Yu et al. Reference Yu, Yang, Wang, Guan, Fang, Liu, Walters, Kaiser and Huang2016).
3. The structure of the 26S proteasome
Understanding the function and behavior of a protein complex relies heavily on detailed structural information, in order to determine subunit composition, contact interfaces, conformational changes upon ligand binding and the effects of mutations. While structural techniques such as X-ray crystallography and NMR spectroscopy are the gold standard for determining protein structures of individual proteins or small uniform complexes, their utility for examining large protein complexes are often limited. This is partly due to the requirements for large volumes of highly purified sample, as well as the dynamic nature of many protein complexes, which leads to heterogeneous populations composed of varying subunits and interacting proteins. The development of alternative hybrid-MS-based approaches for extracting structural information from large protein complexes, such as crosslinking coupled MS (XL-MS), has therefore proven invaluable for examining protein complex structure (Calabrese & Pukala, Reference Calabrese and Pukala2013; Chait et al. Reference Chait, Cadene, Olinares, Rout and Shi2016; Leitner et al. Reference Leitner, Faini, Stengel and Aebersold2016; Rappsilber, Reference Rappsilber2011).
While the crystal structure of the 20S CP from the Archaea Thermoplasma acidophilum was determined more than two decades ago (Lowe et al. Reference Lowe, Stock, Jap, Zwickl, Baumeister and Huber1995), followed by the structure of the yeast (Groll et al. Reference Groll, Ditzel, Löwe, Stock, Bochtler, Bartunik and Huber1997) and mammalian 20S CP (Unno et al. Reference Unno, Mizushima, Morimoto, Tomisugi, Tanaka, Yasuoka and Tsukihara2002), the structure of the 19S RP has been much more elusive, likely due to the dynamic nature of its subunits. The 19S RP is composed of 19 different subunits in both yeast and mammals, which are organized into two distinct subcomplexes; the base, which contacts the 20S CP, and the lid, which attaches to the base (Finley, Reference Finley2009; Finley et al. Reference Finley, Chen and Walters2016). The base consists of 10 subunits, six of which are ATPases organized into a hexameric ring (Rpt1-Rpt6) as well as four non-ATPase subunits (Rpn1, Rpn2, Rpn10, Rpn13). The base is responsible for the recognition and docking of Ub-tagged substrates via the UbRs Rpn10 and Rpn13, as well as unfolding the substrates and translocating them through the central pore of the hexameric ATPase ring into the 20S CP for degradation. The lid comprises 9 non-ATPase subunits (Rpn3, Rpn5–Rpn9, Rpn11, Rpn12, and Rpn15/Sem1), with Rpn11 performing the key activity of deubiquitination at the proteasome itself (Finley, Reference Finley2009; Finley et al. Reference Finley, Chen and Walters2016). In recent years the topology and organization of all of these subunits was determined and validated using both XL-MS and cryoelectron microscopy (cryoEM), overcoming the challenges associated with this large dynamic structure (Bohn et al. Reference Bohn, Beck, Sakata, Walzthoeni, Beck, Aebersold, Förster, Baumeister and Nickell2010; Kao et al. Reference Kao, Randall, Yang, Patel, Kandur, Guan, Rychnovsky, Baldi and Huang2012; Lander et al. Reference Lander, Estrin, Matyskiela, Bashore, Nogales and Martin2012; Lasker et al. Reference Lasker, Förster, Bohn, Walzthoeni, Villa, Unverdorben, Beck, Aebersold, Sali and Baumeister2012; Luan et al. Reference Luan, Huang, Wu, Mei, Wang, Xue, Yan, Wang, Finley, Shi and Wang2016). Here we will discuss the details and outcomes of the XL-MS studies, which have provided insights into the structure of the entire 26S proteasome complex.
3.1 Determining the structure of the 26S proteasome using crosslinking
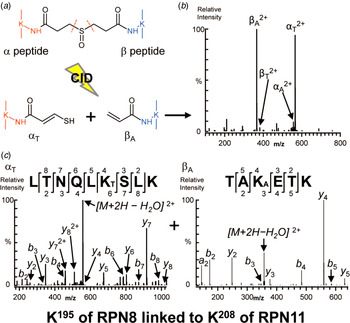
Chemical crosslinking involves the covalent linking of two amino acid residues that are located close to each other within the native structure of a protein or protein complex (Fig. 2d ) (Rappsilber et al. Reference Rappsilber, Siniossoglou, Hurt and Mann2000). The crosslinker itself comprises two reactive groups that are joined by a spacer arm of defined length, between 0 and 30 Å (Leitner et al. Reference Leitner, Faini, Stengel and Aebersold2016). The reactive groups form covalent bonds with amino acids that are positioned within the spatial constraints of the spacer arm. Depending on the particular chemistry of the crosslinker and its spacer arm length, multiple layers of information can be gained regarding amino acid contacts within and between proteins, subunit interfaces within complexes as well as spatial constraints that provide detail regarding orientation and subunit topology. The most commonly used crosslinkers, such as bis(sulfosuccinimidyl) suberate (BS3) and disuccinimidyl (DSS), are amine reactive, linking together K residues via their amino group. Other types of crosslinkers can react with acidic residues or cysteine residues, although these have other associated challenges, such as the low abundance of cysteines and reduced reactivity, and therefore have a more limited application (Leitner et al. Reference Leitner, Walzthoeni, Walzthoeni, Kahraman, Herzog, Kahraman, Rinner, Herzog, Beck and Aebersold2010, Reference Leitner, Joachimiak, Unverdorben, Walzthoeni, Frydman, Förster and Aebersold2014). In order to gain detailed structural information from a crosslinked protein complex, the sample is enzymatically digested, resulting in a mixture of crosslinked and uncrosslinked peptides (Fig. 2d ). The crosslinked peptides can then be enriched using various chromatography methods to reduce the background levels of uncrosslinked peptides, followed by LC-MS/MS for sequence identification. During MS/MS, the peptide ions are selected, fragmented and analyzed to locate the position of the covalently attached crosslinker, which will add a known mass to the peptide thus allowing the exact identification of the amino acid that has been modified on both peptides involved. This is achieved using sophisticated search algorithms and pre-generated databases of all the potential crosslinked peptides that could exist in the protein complex under investigation. Some crosslinkers are also designed to incorporate an MS cleavable spacer arm, facilitating MS/MS fragmentation and peptide identification, as described below (Fig. 4). Once the location of the crosslinks on the peptides has been determined, this information can then be used in combination with the known spatial constraints of the crosslinker to create an interaction map between the various subunits of the complex, thus producing a topological model of the quaternary structure of the complex (Calabrese & Pukala, Reference Calabrese and Pukala2013; Leitner et al. Reference Leitner, Walzthoeni, Walzthoeni, Kahraman, Herzog, Kahraman, Rinner, Herzog, Beck and Aebersold2010, Reference Leitner, Faini, Stengel and Aebersold2016; Rappsilber et al. Reference Rappsilber, Siniossoglou, Hurt and Mann2000; Rappsilber, Reference Rappsilber2011).
Use of the MS-cleavable crosslinker DSSO to identify a crosslinked peptide between Rpn8 and Rpn11. (a) Structure of DSSO demonstrating the covalent bond formed between each reactive group and K residues from two different proteins (orange and blue). The C-S bonds in the spacer arm which can break during CID are highlighted (dashed orange line). The generated peptide fragments after CID are shown, demonstrating the presence of a thiol (-SH) group on the α-peptide (left) and an alkene (=C) on the β-peptide (right). (b) The MS/MS fragmentation pattern of the produced peptides. The presence of the thiol on the α-peptide (denoted α T 2+) and the alkene on the β-peptide (denoted β A 2+) is distinguishable due to their characteristic mass relationship (+86 Da and +54 Da, respectively). (c) Sequence determination of each crosslinked peptide in (b) by MS/MS/MS, unambiguously defining the site of the crosslink as K195 of Rpn8 to K208 of Rpn11. Reproduced and adapted with permission from (Kao et al. Reference Kao, Randall, Yang, Patel, Kandur, Guan, Rychnovsky, Baldi and Huang2012).

The first analysis of the composition of the 19S RP using XL-MS was performed a decade ago (Sharon et al. Reference Sharon, Taverner, Ambroggio, Deshaies and Robinson2006), revealing the unit stoichiometry of the complex and detailing the first interaction map between the subunits, however, the exact interaction sites between subunits were not identified. Since then several studies have used XL-MS to further describe the interactions between the 19S base and the 20S, as well as the positioning and assembly of the 19S lid subunits (Bohn et al. Reference Bohn, Beck, Sakata, Walzthoeni, Beck, Aebersold, Förster, Baumeister and Nickell2010; Kao et al. Reference Kao, Randall, Yang, Patel, Kandur, Guan, Rychnovsky, Baldi and Huang2012; Lasker et al. Reference Lasker, Förster, Bohn, Walzthoeni, Villa, Unverdorben, Beck, Aebersold, Sali and Baumeister2012), which have been further validated by cryoEM analysis (Lander et al. Reference Lander, Estrin, Matyskiela, Bashore, Nogales and Martin2012; Luan et al. Reference Luan, Huang, Wu, Mei, Wang, Xue, Yan, Wang, Finley, Shi and Wang2016). These studies used amine-reactive crosslinkers such as BS3 or DSS, with the exception of Kao et al. who described the use of a novel MS cleavable crosslinker, disuccinimidyl sulfoxide (DSSO) (Kao et al. Reference Kao, Chiu, Vellucci, Yang, Patel, Guan, Randall, Baldi, Rychnovsky and Huang2011). DSSO is also amine reactive, however it contains a C-S bond in the spacer arm that breaks more readily than the peptide backbone when subjected to CID (Fig. 4a ). The generated peptide fragment ions contain a thiol group on the α-peptide, and an alkene group on the β-peptide, or vice versa. As a consequence, the generated pair of fragments have a characteristic mass relationship (+86 Da and +54 Da, respectively) and are therefore readily identifiable by MS (Fig. 4b ). By applying three successive steps of MS (MS/MS/MS) analysis, these peptide fragments can then define the peptide sequence, thus mapping the exact location of the crosslink, and hence the K–K interaction site between proteins (Fig. 4c ). The simplicity of the crosslinking chemistry, in combination with the integrated data from the multiple stages of MS analysis, facilitated unambiguous, high confidence peptide identification using a rapid workflow and conventional database searches (Kao et al. Reference Kao, Chiu, Vellucci, Yang, Patel, Guan, Randall, Baldi, Rychnovsky and Huang2011). After validation of DSSO as a viable and effective crosslinker on the 20S CP, the authors applied this method to determine with higher confidence the 19S RP structure, achieving hundreds of inter- and intra-subunit crosslinks. Twenty-four unique interactions between subunits were identified, both within and between the lid and base. For example, a crosslink between K195 in Rpn8 and K208 in Rpn11 was unambiguously identified with high confidence (Fig. 4c ), confirming the close proximity and interaction between these two subunits, which have been shown to form a heterodimer (Lander et al. Reference Lander, Estrin, Matyskiela, Bashore, Nogales and Martin2012; Lasker et al. Reference Lasker, Förster, Bohn, Walzthoeni, Villa, Unverdorben, Beck, Aebersold, Sali and Baumeister2012; Luan et al. Reference Luan, Huang, Wu, Mei, Wang, Xue, Yan, Wang, Finley, Shi and Wang2016). In addition, the authors were also able to identify novel interactions between 19S subunits, such as that between two base subunits – Rpn2, a critical scaffolding protein, and Rpn13, a UbR.
To generate an overall model of the complexes topology from the identified interactions, rather than relying on previously obtained structural data from cryoEM studies, Kao et al. also developed a probabilistic modeling approach, in which only crosslink data was used to generate maximum likelihood models of the relationships between the subunits, ultimately producing the highest confidence maximum likelihood model. They generated accurate models for the 19S base and lid separately, both of which were in excellent agreement with previously published structural data (Bohn et al. Reference Bohn, Beck, Sakata, Walzthoeni, Beck, Aebersold, Förster, Baumeister and Nickell2010; Lander et al. Reference Lander, Estrin, Matyskiela, Bashore, Nogales and Martin2012; Lasker et al. Reference Lasker, Förster, Bohn, Walzthoeni, Villa, Unverdorben, Beck, Aebersold, Sali and Baumeister2012). Thus, the cumulative knowledge gained from XL-MS, in combination with cryoEM, have led to the current consensus model for the 19S RP (Bohn et al. Reference Bohn, Beck, Sakata, Walzthoeni, Beck, Aebersold, Förster, Baumeister and Nickell2010; Kao et al. Reference Kao, Randall, Yang, Patel, Kandur, Guan, Rychnovsky, Baldi and Huang2012; Lander et al. Reference Lander, Estrin, Matyskiela, Bashore, Nogales and Martin2012; Lasker et al. Reference Lasker, Förster, Bohn, Walzthoeni, Villa, Unverdorben, Beck, Aebersold, Sali and Baumeister2012; Luan et al. Reference Luan, Huang, Wu, Mei, Wang, Xue, Yan, Wang, Finley, Shi and Wang2016). Overall, the intricate details of the subunit topology of the 19S as determined by XL-MS and cryoEM studies has greatly expanded our understanding of the mechanisms underlying substrate recognition and processing by the 26S proteasome.
4. The heterogeneity of proteasome populations
The global pool of proteasomes within cells is not just restricted to the classical 26S complex that has been the major focus of the structural studies outlined above. It is well established that there are several different variants of the 20S CP (Ben-Nissan & Sharon, Reference Ben-Nissan and Sharon2014). The standard 20S CP is composed of four stacked hexameric rings; the two outer rings formed by subunits α1–7, and the two inner rings formed by subunits β1–7 (Groll et al. Reference Groll, Ditzel, Löwe, Stock, Bochtler, Bartunik and Huber1997; Unno et al. Reference Unno, Mizushima, Morimoto, Tomisugi, Tanaka, Yasuoka and Tsukihara2002). The proteolytic activity of the 20S is localized to three catalytic β subunits, β1, β2 and β5, each possessing caspase-like, trypsin-like and chymotrypsin-like activity, respectively (Dick et al. Reference Dick, Nussbaum, Deeg, Heinemeyer, Groll, Schirle, Keilholz, Stevanović, Wolf, Huber, Rammensee and Schild1998). These three subunits can be replaced by β1i, β2i and β5i, forming the immunoproteasome, which is upregulated in immune cells and in response to interferon stimulation (Krüger & Kloetzel, Reference Krüger and Kloetzel2012). In addition, there exist two intermediate proteasomes, formed by a mixed assortment of the immune subunits and standard subunits (β1-β2-β5i and β1i-β2-β5i) (Guillaume et al. Reference Guillaume, Chapiro, Stroobant, Colau, Van Holle, Parvizi, Bousquet-Dubouch, Théate, Parmentier and Van Den Eynde2010). Beyond the variation in the 20S CP, there are also several proteasome regulatory complexes that can modulate the activity of the 20S CP. Aside from the 19S RP, there are the heterohexameric PA28αβ, the homohexameric PA28γ and the PA200 protein activator, as well as the inhibitory PI31 protein (Chu-Ping et al. Reference Chu-Ping, Slaughter and Demartino1992; Schmidt et al. Reference Schmidt, Haas, Crosas, Santamaria, Gygi, Walz and Finley2005; Shibatani et al. Reference Shibatani, Carlson, Larabee, Mccormack, Früh and Skach2006; Ustrell et al. Reference Ustrell, Hoffman, Pratt and Rechsteiner2002). However, the distribution and quantities of these proteasome subtypes, as well as their connections with the various regulators, was until recently undetermined due to the difficulties associated with distinguishing and quantifying subtle changes in proteasome complex composition. This was overcome in studies which used a combination of in vivo crosslinking, affinity purification and label-free MS quantification to determine the cellular localizations and levels of the different 20S proteasome populations and their interacting regulatory complexes and proteins, as well as the plasticity of these populations upon changing cellular conditions.
4.1 Exploring proteasome heterogeneity using label free quantitative MS
As described earlier, the combination of in vivo crosslinking with formaldehyde, affinity purification and LC-MS/MS is a powerful approach to quantify protein complexes of interest. The studies described here used a single affinity purification step, pulling out proteasomes using an antibody directed to the α2 subunit of the human proteasome, which does not vary across the different proteasome subtypes. The first study to use this approach also incorporated cellular fractionation after in vivo crosslinking to isolate specific populations of proteasomes that exist in different cellular compartments (Fabre et al. Reference Fabre, Lambour, Delobel, Amalric, Monsarrat, Burlet-Schiltz and Bousquet-Dubouch2013). They were able to identify varying levels of standard, immuno and intermediate 20S proteasomes in the cytoplasm, nucleus and microsomes of two different cell types, as well as measuring differences in proteasome activity between the cellular compartments. The same group continued their analysis, comparing the diversity of proteasome and PIPs across 9 different cell types, revealing significant differences in the amount of free 20S CP, associated regulators and proteasome assembly chaperones across the different cell types, indicating that there exists careful modulation of proteasome heterogeneity depending on the metabolic needs and cellular functions of the cell lines under investigation (Fabre et al. Reference Fabre, Lambour, Garrigues, Ducoux-Petit, Amalric, Monsarrat, Burlet-Schiltz and Bousquet-Dubouch2014b). Following on from these results, Fabre et al. (Reference Fabre, Lambour, Garrigues, Amalric, Vigneron, Menneteau, Stella, Monsarrat, Van Den Eynde, Burlet-Schiltz and Bousquet-Dubouch2015) significantly extended the scope of their approach, combining the aforementioned MS workflow with glycerol sedimentation to isolate different proteasome complex populations prior to LC-MS/MS, and protein correlation profiling (PCP), an in-depth statistical analysis of the absolute quantification of each of the proteasome complexes, regulatory complexes and other interacting proteins, to determine the specificity of interactions with the proteasome (Fig. 2c ).
PCP requires the calculation of the protein abundance index (PAI) of each protein under investigation e.g. individual proteasome subunits, PIPs etc. This is achieved by analyzing the three most intense peptides validated for each protein of interest during LC-MS/MS and quantifying the absolute amount of protein based on these peptides using AQUA reference peptides as described earlier (Fabre et al. Reference Fabre, Lambour, Garrigues, Amalric, Vigneron, Menneteau, Stella, Monsarrat, Van Den Eynde, Burlet-Schiltz and Bousquet-Dubouch2015; Silva et al. Reference Silva, Gorenstein, Li, Vissers and Geromanos2006). The PAIs of different proteins can then be compared to determine if there is a correlation between their absolute quantities in a particular sample, for example after fractionation to separate discrete protein complexes from one another. A strong correlation between two proteins indicates that they exist in comparable quantities in the same sample, and are therefore likely part of the same complex. Validation of this approach was achieved by comparing the levels of the standard proteasome subunits, e.g. α6 and α7, which showed an extremely strong correlation, and are known to be integral and unchanging 20S subunits, as well as subunits of the 19S, e.g. Rpn1 and Rpn3 (Fabre et al. Reference Fabre, Lambour, Garrigues, Amalric, Vigneron, Menneteau, Stella, Monsarrat, Van Den Eynde, Burlet-Schiltz and Bousquet-Dubouch2015).
MS datasets were collected from different cell lines that had been subjected to fractionation and LC-MS/MS using the workflow described above, and PCP was performed on the identified proteasome subunits, regulatory complex subunits and interacting proteins. The authors were able to unambiguously define strong correlations between the standard and immunoproteasomes with specific regulatory complexes across multiple cell types. They demonstrated that while the 19S is equally associated with both proteasome subtypes, the immunoproteasome is preferentially associated with PA28αβ complex, while the standard proteasome is preferentially associated with PA200 and PI31 – a previously unknown specificity of association. These associations were further validated by altering the ratio of immunoproteasome to standard proteasome, using known methods such as interferon stimulation of cells, which is known to increase the levels of immunoproteasome present (Fabre et al. Reference Fabre, Lambour, Garrigues, Amalric, Vigneron, Menneteau, Stella, Monsarrat, Van Den Eynde, Burlet-Schiltz and Bousquet-Dubouch2015; Seifert et al. Reference Seifert, Bialy, Ebstein, Bech-Otschir, Voigt, Schröter, Prozorovski, Lange, Steffen, Rieger, Kuckelkorn, Aktas, Kloetzel and Krüger2010). The absolute quantification of protein levels in isolated proteasomes using this robust MS-PCP approach revealed that there is a defined spread of heterogeneous proteasome complex populations within cells, which show distinct associations with regulatory complexes and regulators. This indicates that there is a mechanism through which proteasome function is fine-tuned depending on the cell type and in response to changing cellular requirements.
5. The regulation of proteasome assembly and degradation
The formation of the 26S proteasome involves a complex assembly pathway in which the 20S CP, 19S base and 19S lid each form as defined entities prior to uniting to become the intact 26S complex. While the assembly pathway of the 20S CP has been well defined (Kunjappu & Hochstrasser, Reference Kunjappu and Hochstrasser2014), the assembly of the 19S base and lid and their incorporation into the 26S complex remains under debate. Two assembly pathways have been proposed; either the 19S lid and base form independently of the 20S CP (Funakoshi et al. Reference Funakoshi, Tomko, Kobayashi and Hochstrasser2009; Kaneko et al. Reference Kaneko, Hamazaki, Iemura, Sasaki, Furuyama, Natsume, Tanaka and Murata2009; Saeki et al. Reference Saeki, Toh-E, Kudo, Kawamura and Tanaka2009; Sakata et al. Reference Sakata, Stengel, Fukunaga, Zhou, Saeki, Förster, Baumeister, Tanaka and Robinson2011; Tomko et al. Reference Tomko, Funakoshi, Schneider, Wang and Hochstrasser2010, Reference Tomko, Taylor, Chen, Wang, Rappsilber and Hochstrasser2015; Tomko & Hochstrasser, Reference Tomko and Hochstrasser2011), or the 20S CP acts as a scaffold for the formation of the 19S base (Hendil et al. Reference Hendil, Kriegenburg, Tanaka, Murata, Lauridsen, Johnsen and Hartmann-Petersen2009; Park et al. Reference Park, Roelofs, Kim, Robert, Schmidt, Gygi and Finley2009; Roelofs et al. Reference Roelofs, Park, Haas, Tian, Mcallister, Huo, Lee, Zhang, Shi, Gygi and Finley2009; Yu et al. Reference Yu, Livnat-Levanon, Kleifeld, Mansour, Nakasone, Castañeda, Dixon, Fushman, Reis, Pick and Glickman2015) followed by association of the intact 19S lid (for review (Bar-Nun & Glickman, Reference Bar-Nun and Glickman2011)). Investigating this incredibly complex pathway, which involves multiple co-existing intermediate precursor complexes and transiently associating chaperones, is particularly difficult. Some of these challenges were overcome using a well-designed hybrid MS approach, incorporating both native MS and quantitative proteomics to determine the organization and sequential combination of assembly precursors, which form the 19S base complex (Sakata et al. Reference Sakata, Stengel, Fukunaga, Zhou, Saeki, Förster, Baumeister, Tanaka and Robinson2011).
5.1 Using native MS to probe the assembly pathway of the proteasome
While quantitative MS workflows, such as those described above, are excellent at determining the quantity and identity of proteins present in a sample, they are not able to provide details regarding the exact size, oligomeric status and specific stoichiometries of protein complexes in the same sample. Native MS is an effective approach that is capable of overcoming these limitations, in that it does not require the enzymatic digestion of samples into peptides prior to MS analysis. Instead, it involves the transfer of intact proteins and protein complexes into the gas phase, maintaining both biomolecular interactions and quaternary structures of the assemblies (for reviews see (Chorev et al. Reference Chorev, Ben-Nissan and Sharon2015; Heck, Reference Heck2008; Konijnenberg et al. Reference Konijnenberg, Butterer and Sobott2013; Mehmood et al. Reference Mehmood, Allison and Robinson2015; Sharon, Reference Sharon2013)). The introduction of extended mass range mass analyzers capable of transmitting, selecting and detecting large m/z values, was vital to the progression of the technique (Benesch et al. Reference Benesch, Ruotolo, Simmons and Robinson2007; Sharon & Robinson, Reference Sharon and Robinson2007; Snijder & Heck, Reference Snijder and Heck2014). This method can also be used in hybrid MS workflows, such as in combination with XL-MS to define specific structural interactions within a complex (Sinz et al. Reference Sinz, Sharon, Chorev and Arlt2015).
Upon application of a sample for native MS analysis, the measured spectrum will immediately yield information regarding the size of the intact complexes present in the sample, as well as their charge distribution series. Desired peaks can then be selected, isolated, and subject to MS/MS fragmentation, causing the dissociation and release of intact subunits from the complex, which can then be individually analyzed to determine their size and thus identity (Fig. 2e ). This powerful technique can be used to determine not only the subunits of a complex, but also additional associating proteins that are difficult to detect by other means. Given that all co-existing states of an assembly can be detected in a single spectrum, native MS is well suited for monitoring the intermediate steps along the proteasome assemble process.
To understand the nature of the assembly precursors of the 19S RP base, 19S RP base subcomplexes were isolated using affinity purification of tagged Rpn1, an integral base subunit. As this isolation technique will pull out all assembly precursors that contain Rpn1 with different combinations of the other subunits, which are en route to forming the intact base complex, the sample was also subjected to a sucrose gradient to isolate individual subcomplexes, allowing for the interrogation of their particular compositions (Sakata et al. Reference Sakata, Stengel, Fukunaga, Zhou, Saeki, Förster, Baumeister, Tanaka and Robinson2011). In addition to native MS to define the size and stoichiometries of the complexes, the authors also performed quantitative proteomics to unambiguously define the quantities of proteins present in each subcomplex. They identified the association of several assembly chaperones, Nas6, Nas2, Rpn14 and Hsm3, with defined combinations of 19S base subunits, forming the assembly precursors of the intact 19S base complex. Importantly, it was revealed that the deubiquitinating enzyme, Ubp6, is a component of one of these assembly precursors, the Hsm3 module; a complex of Rpn1, Rpt1, Rpt2 and Hsm3. While the other chaperones could not be detected in the intact 19S base complex, indicating that they dissociate from the 19S base during assembly of the precursors, Ubp6 remains bound to Rpn1, until after binding of the 19S lid to form the intact 19S complex. Further exploration of the continued association of Ubp6 throughout assembly revealed that the deubiquitinating activity of Ubp6 was essential for proteasome assembly, likely due to its continual trimming of Ub chains, which are recognized by Rpn1. The use of native MS in combination with quantitative MS in this study was essential for defining not only the composition of the 19S base complex assembly precursors, but also the concerted role of their chaperones to complete the assembly process.
5.2 Understanding the regulation of 20S proteasomal degradation using native MS
Another aspect of the proteasomal pathway that has been investigated using native MS is the regulation of protein degradation performed by the 20S CP, independently of the 19S RP. It has been established that the 20S is capable of degrading partially unfolded proteins in an ATP and Ub independent manner (Baugh et al. Reference Baugh, Viktorova and Pilipenko2009; Ben-Nissan & Sharon, Reference Ben-Nissan and Sharon2014; Hwang et al. Reference Hwang, Winkler and Kalejta2011). Substrates of this pathway are proteins that contain unstructured elements due to aging, mutation, or oxidation, as well as intrinsically disordered regions. While under basal conditions, proteolysis by the 20S proteasome may not constitute a dominant route for protein turnover, under oxidative stress conditions in which many proteins are oxidatively damaged, the 20S proteasome degradation capacity is significantly enhanced. This occurs through disassembly of the 26S proteasome into its 20S and 19S components, as well as de novo synthesis of 20S proteasomes (Aiken et al. Reference Aiken, Kaake, Wang and Huang2011; Pickering & Davies, Reference Pickering and Davies2012). However, given that degradation by the 20S proteasome is a non-selective process, due to the absence of the ubiquitination step, appropriate control of the 20S proteasome is essential to avoid the unnecessary degradation of proteins.
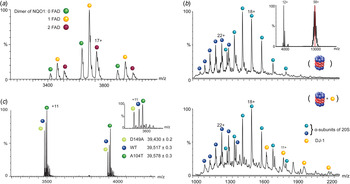
The first identified regulator of Ub-independent 20S degradation was NAD(P)H:quinone-oxidoreductase-1 (NQO1) (Asher, Reference Asher2005). NQO1 was shown to inhibit the 20S proteasomal degradation of tumor suppressors’ p53 and p73, although the exact mechanism of this inhibition was unclear. Several years later, the application of native MS lead to the revelation that NQO1 exists in a double negative feedback loop with the 20S proteasome. Native mass spectra of purified NQO1 confirmed that it forms a homodimer and is bound to the cofactor FAD (Fig. 5a ) (Moscovitz et al. Reference Moscovitz, Tsvetkov, Hazan, Michaelevski, Keisar, Ben-Nissan, Shaul and Sharon2012), in agreement with the published crystal structure (Asher et al. Reference Asher, Dym, Tsvetkov, Adler and Shaul2006). Additional native MS techniques were then applied, such as ion mobility MS (IM-MS), in which intact proteins are directed through a field of inert gas molecules with which they collide, and the time taken to traverse the field is proportional to the size and shape of the protein. This can provide information regarding the folding state of the protein, as more compact molecules will move faster through the field, while unfolded proteins will move slower. Analysis of apo and FAD-NQO1 demonstrated that FAD-NQO1 is compact and stable, while in the apo-state NQO1 adopts a more unfolded structure. Interestingly, the 20S proteasome can degrade apo-NQO1 but not FAD-NQO1, likely due to the partial unfolding of the protein in the absence of FAD. Furthermore, native MS/MS experiments were able to establish that NQO1 can bind directly to the 20S proteasome. Further cellular experiments indicated that in the presence of increased levels of FAD and consequently increased levels of stable NQO1, 20S proteasomal degradation of substrates such as p53 were reduced, indicating that NQO1 inhibited degradation (Moscovitz et al. Reference Moscovitz, Tsvetkov, Hazan, Michaelevski, Keisar, Ben-Nissan, Shaul and Sharon2012).
Native MS spectra of 20S proteasome regulators. (a) MS spectra of NQO1 confirming the presence of a homodimer. Each of the charge states is split into three reflecting the presence of three different homodimer populations, namely apoNQO1 or the NQO1 bound to one or two FAD molecules. (b) MS/MS spectra of 20S proteasome alone (top), showing the identification of individual α-subunits of the 20S (blue balls) that have been ejected from the intact 20S proteasome during the CID process. Inset shows the mass spectrum of the intact 20S proteasome centered at 13000 m/z, and the peak selected for further MS/MS analysis is highlighted in red. Comparison with the 20S in the presence of DJ-1 (bottom) reveals additional peaks that correspond in mass to the monomeric form of DJ-1 (yellow balls). By extrapolation, we can therefore conclude that before MS/MS analysis, DJ-1 binds to the 20S proteasome. (c) The high resolving power of the Orbitrap mass spectrometer can distinguish between the small mass differences of the Parkinson's disease missense mutants of DJ-1. Compared with the WT DJ-1, the D149A and A104T DJ-1 mutants differ by −30 Da and +44 Da, respectively. Inset shows the clear separation of the peaks in a single charge state. Reproduced and adapted with permission from (Ben-Nissan et al. Reference Ben-Nissan, Chotiner, Tarnavsky and Sharon2016; Moscovitz et al. Reference Moscovitz, Tsvetkov, Hazan, Michaelevski, Keisar, Ben-Nissan, Shaul and Sharon2012, Reference Moscovitz, Ben-Nissan, Fainer, Pollack, Mizrachi and Sharon2015).

Another inhibitor of the 20S proteasome, DJ-1, was discovered via its structural similarities to NQO1, including homodimerization and the presence of a flavodoxin like fold, as well as their reported involvement in the cellular response to oxidative stress (Moscovitz et al. Reference Moscovitz, Ben-Nissan, Fainer, Pollack, Mizrachi and Sharon2015). In vitro and cellular characterization of its ability to regulate 20S mediated degradation of substrates was performed, demonstrating that it efficiently inhibits the degradation of multiple substrates. Using a similar native MS approach as was utilized for NQO1, the authors revealed that DJ-1 physically binds to the 20S proteasome, as it is released from the selected 20S ions upon the induction of collisional activation (Fig. 5b ). Taken together, the use of advanced native MS techniques in these studies established that NQO1 and DJ-1 are both inhibitors of 20S proteasomal degradation, able to physically bind to the 20S proteasome complex and affect its activity.
Recent advances in mass spectrometer technology have led to the development of the extended mass range (EMR) Orbitrap system, an instrument capable of examining large protein complexes in their native state at high spectral resolution and mass accuracy (Rose et al. Reference Rose, Damoc, Denisov, Makarov and Heck2012). The power of this platform was demonstrated by the in-depth analysis of missense mutants of DJ-1, which lead to early-onset Parkinson's disease (Ben-Nissan et al. Reference Ben-Nissan, Chotiner, Tarnavsky and Sharon2016). Two mutants were analyzed, DJ-1A104T and DJ-1D149A, each displaying a small mass shift from the wild type protein of +44 Da and −30 Da, respectively. Despite these very minor mass differences, both mutants were readily distinguishable from DJ-1WT on the Orbitrap EMR when mixed together and analyzed from the same needle (Fig. 5c ), while they could not be distinguished from one another using other mass spectrometers. Further analysis of these mutants demonstrated subtle changes in their structural stability, which affect their inhibitory influences on the 20S proteasome. The ability to analyze all three proteins concurrently not only reduced data acquisition time but also permitted direct comparison between the proteins within the same experiment, thus removing sample to sample variation, which could obfuscate subtle differences. This compelling native MS methodology will allow for the examination of other missense mutations, numbering in the tens of thousands, that have been associated with other diseases (Stefl et al. Reference Stefl, Nishi, Petukh, Panchenko and Alexov2013).
6. Conclusions and future directions
In this review we have described the multiple contributions of MS to the study of a complex biological pathway, namely the proteasomal protein degradation system. MS workflows incorporating several techniques in tandem, such as in vivo and in vitro labeling, enzymatic digestion, crosslinking, chromatography and native MS, all coupled with advanced data analysis and statistical methods, have greatly advanced our cumulative knowledge regarding this dynamic and essential system. The ability to scrutinize the identity, quantity, interactions and structures of the multiple proteins and protein complexes involved at every stage of the degradation pathway in such unprecedented detail, exemplifies the use of MS as a critical tool for addressing complicated biological systems.
As described here, we now have a much clearer understanding of the ubiquitination process, assembly pathway and overall structure of the proteasome, as well as details regarding its regulation and population heterogeneity within the cell. However, much remains to be discovered about this fascinating process. For example, deciphering the influence of Ub linkage diversity on substrate selection, recognition and proteasomal targeting will provide important insights into the broad reach of the Ub-proteasome network. Similarly, unraveling the conformational transitions of proteasome subunits as substrates are recognized and deciphering the biological impact of proteasome population heterogeneity across the cellular compartments, especially under stress conditions, will provide essential information for future therapeutic benefits considering that the proteasome is an important target in neurodegenerative disease and cancer. We anticipate that further advances in MS methodologies and technologies will undoubtedly drive our future investigations into this and other biological pathways, as we continually strive to advance our knowledge of these dynamic and enigmatic systems.
Acknowledgements
We would like to acknowledge Gili Ben-Nissan for critically appraising the manuscript during its preparation. We are grateful for the support of a Starting Grant from the European Research Council (ERC) (Horizon 2020)/ERC Grant Agreement no. 636752, and a Minerva Foundation Grant, with funding from the Federal Ministry for Education and Research, Germany. M.S. in an incumbent of the Aharon and Ephraim Katzir Memorial Professorial Chair. M.O. is thankful for the support of the Deans Fellowship from the Faculty of Life Sciences, Weizmann Institute of Science, and a Postdoctoral Fellowship from the Israel Cancer Research Fund.
Conflict of Interest
None.