A frequently cited fact in New York City's history is that two separate business districts—one centered near Wall Street (downtown), and one centered near Grand Central Station (midtown)—emerged because of a deep bedrock “valley” between these two areas, where the bedrock is up to four to five times deeper below the surface than on other parts of Manhattan Island. The conventional wisdom is that skyscraper developers shied away from the valley because either digging to bedrock or creating new foundation technologies were too costly relative to building in other locations.Footnote 1 Though this story is deeply embedded in the historiography of the city, it has never been empirically tested. We study the effect of depth to bedrock on the cost and spatial distribution of the first generation of skyscrapers in Manhattan (1890 to 1915) using newly collected data.
Within urban economics and economic geography, there is a debate about which forces are responsible for economic agglomeration. One branch of the literature focuses on the effects of local natural advantage.Footnote 2 Another branch focuses on knowledge spillovers and economies of scale.Footnote 3 In New York, the belief is that bedrock depths created a natural barrier against agglomeration; this article tests this “natural disadvantage” hypothesis.
Our results show that bedrock had, at most, a small effect on the formation of the skyline. While having to dig to bedrock deep below the surface did increase construction costs (up to 7 percent, on average), the costs were small relative to overall construction costs and land values. In regard to the spatial location of skyscrapers, our results show that the polycentric nature of Manhattan was driven more by the demand for skyscrapers in particular neighborhoods rather than the inability of suppliers to provide them in other places. Real estate developers built skyscrapers to be near already established centers of commerce, where public transportation was easily accessible, and away from slums and manufacturing districts. In short, our results provide a confirmation for the spillovers and economies of scale theories, rather than the natural disadvantage theory. This stated, however, we do find evidence that the depth to bedrock did affect the placement of skyscrapers locally within the individual business districts.
SKYSCRAPERS AND BEDROCK IN MANHATTAN
In the late nineteenth century, a set of technological innovations allowed for the construction of skyscrapers. High-strength steel beams obviated the use of thick load-bearing masonry walls. The introduction of electric elevators with safety brakes made vertical transport both safe and fast. Due to their height and size, however, these buildings were heavy and had to be anchored to bedrock to prevent sinking and uneven settling.Footnote 4 But, digging to bedrock in some locations within lower Manhattan was difficult and expensive because of several hazards: the bedrock was deep below the surface, the subsoil was wet and viscous, and large boulders were randomly distributed underground.Footnote 5 Thus the ease with which developers were able to reach the bedrock to anchor skyscrapers could have the potential to greatly impact the cost of construction and the placement of skyscrapers within the city.Footnote 6
To investigate this issue, we focus on the first generation of Manhattan skyscrapers in the period 1890 to 1915, before the implementation of zoning regulations in 1916. The Tower Building, at 50 Broadway, completed in 1889, is considered New York's first “skyscraper;” it was only 11 stories.Footnote 7 The following year, Joseph Pulitzer's New York World Building was completed at 99 Park Row. At 94 meters it was the world's tallest building, and thus it set the standard for New York skyscraper height. In the ensuing years buildings of 80 meters, about 18–19 stories, or taller were relatively common in Manhattan, and to simplify the analysis, for the remainder of the article, we define a “skyscraper” as a building that is 80 meters or taller.
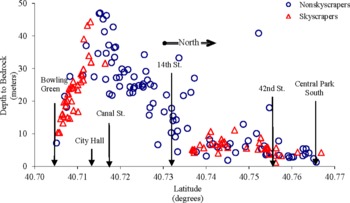
Figure 1 shows the depth to bedrock for our sample of 173 locations in Manhattan.Footnote 8 We display skyscrapers as triangles and 99 randomly chosen locations (without skyscrapers) as circles.Footnote 9 At the southern tip of Manhattan, bedrock can be found at about 8 meters below the surface; going north, the bedrock dips down into a bedrock valley, which reaches its greatest depth (just over 45 meters below the surface) between City Hall and Canal Street. The depth to bedrock then decreases as one moves toward 14th Street, where, on average, it remains relatively close to the surface.
DEPTHS TO BEDROCK FOR MANHATTAN SOUTH OF CENTRAL PARK VERSUS LATITUDE

In regard to the effect that depth to bedrock may have had on skyscraper locations, there are several possibilities. First, bedrock deep below the surface may have been seen by developers as an insurmountable barrier that prevented skyscrapers from being built in the valley. However, Figure 1 indicates that this was not the case. The deepest bedrock in our data set is just over 45 meters below the surface, but some skyscrapers built during this time period were constructed on bedrock that was greater than 40 meters below the surface.Footnote 10 Second, although building above deep bedrock may have been technologically feasible, developers may have found skyscraper construction in the bedrock valley to be too costly relative to the benefits. Again, this possibility is somewhat disproved by Figure 1. Skyscrapers were built above some of the deepest bedrock in the city. Thus it appears that it was economically feasible to build over deep bedrock when there were also sufficient demand-side benefits. Finally, the effect of depth to bedrock may have been small enough that it did not greatly effect the location choice of builders. We analyze and test these hypotheses in the rest of the article.
AGGLOMERATION VERSUS BEDROCK: A SIMPLE MODEL
Here we demonstrate that if skyscraper construction was based on a true tradeoff between agglomeration benefits and bedrock costsFootnote 11 (as implied by the conventional wisdom), then the early New York City skyline pattern would have developed much differently. Assume that skyscraper developers maximize profits and that the height of a building is determined by the rental income and the cost of construction. All else equal, buildings are taller near the city center because agglomeration benefits increase rents. Construction costs are a function of both the height of the building and bedrock costs.
Assume that a building taller than a specified height, denoted, will require that the building foundation be anchored to the bedrock. If the profit maximizing building height at a given location is less than, the developer does not pay bedrock costs and thus does not consider the depth to bedrock. However, if the optimal height of building at a location, excluding bedrock costs, is greater than the developer must consider whether the additional rent from building to a height greater than will compensate for the bedrock costs. If bedrock costs cause a developer to stop building at, we would see a height plateau over the area of the city where there are both substantial agglomeration benefits and large depths to bedrock.
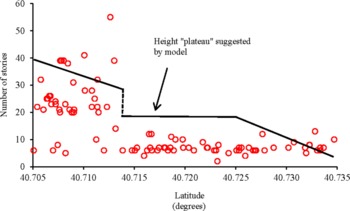
In Figure 2, we compare actual building heights to hypothetical building heights consistent with tradeoffs implied by the conventional wisdom. In the figure, we see a sharp and sudden decrease in actual building height rather than a decrease to a height plateau. The observed pattern of building heights in the figure suggests that the supply-side effects of bedrock costs did not largely determine the skyline. Futhermore, in the empirical section below we show that bedrock costs did not play a strong role in determining the location of city centers in Manhattan, but rather skyscraper locations were determined by demand-side factors.
SCATTER PLOT OF BUILDINGS SOUTH OF 14TH STREET VERSUS LATITUDE

EMPIRICAL RESULTS
Data
To test the effect of depth to bedrock on skyscraper construction, we have collected two new data sets: one on construction costs and one on the location of skyscrapers. Both of the data sets use depth to bedrock at various locations in Manhattan as a primary variable of interest. In the first data set, we collected depth to bedrock for 53 large commercial buildings built in Manhattan between 1899 and 1915. In the second data set, we collected depth to bedrock information for all buildings that are listed as 80 meters or taller and completed between 1890 and 1915. As a control group in this second data set, we also collected depth to bedrock information for 99 randomly chosen locations in Manhattan south of Central Park/59th Street.
Bedrock depth data was obtained from two sources: (1) “Rock Data Map of Manhattan” created by the Manhattan Borough President's Office and provided to us by Dr. K. H. Jacob, Lamont-Doherty Earth Observatory of Columbia University and (2) “Bedrock and Engineering Geological Maps of New York County,” created by Charles A. Baskerville.Footnote 12 The first map provides depth to bedrock measurements for specific locations based on borings. For many locations in our data sets, the map provides the depth to bedrock for the lot or block. In the case of a missing data point at the location, an arithmetic average of the surrounding data points was used. The second map provides contours of the bedrock surface in intervals of 20 feet. Again, averages were taken as necessary. Depth to bedrock in this article is determined by subtracting the depth to bedrock relative to sea level from the elevation relative to sea level.Footnote 13 Note that the correlation coefficient across the two maps for our sample was 0.94. For the total cost data set, virtually all building locations had borings on the building lots or blocks. Therefore, we used map 1 exclusively for these regressions. For the location regressions, we used averages from maps 1 and 2.Footnote 14
For the first data set, we obtained total construction costs for 53 large commercial buildings built in Manhattan between 1899 and 1915 from the Cost Job Book of the Fuller Construction Company, archived at the Skyscraper Museum in New York City. From this source, we collected total cost, building volume and project developer name. The building addresses were then located via historical articles in the New York Times or from building permit information from http://www.metrohistory.com.Footnote 15 Building heights and number of floors for each of these projects were taken from either http://www.skyscraperpage.com or the Atlas of the City of New York.Footnote 16 We control for materials costs by using an index of the real value of brick costs in New York City from the New York City Annual Brick Cost Index in Historical Statistics, table Cc264.Footnote 17 The brick costs were then divided by the GDP deflator, which comes from Louis Johnston and Samuel H. Williamson's calculations.Footnote 18 Costs were normalized so that the year 1896 had a value of 1.0.
We developed a second data set to investigate the effect of depth to bedrock on the placement of skyscrapers. To get information on skyscrapers, we found all buildings listed as 80 meters or taller and completed between 1890 and 1915 on http://www.skyscraperpage.com and/or http://www.emporis.com.Footnote 19 The search yielded 74 buildings. To the best of our knowledge these buildings comprise all buildings that are 80 meters or taller in the city as of 1915. We collected height and location data for each of these 74 skyscrapers. These websites generally provide the number of floors and height for each skyscraper. The website http://www.skyscraperpage.com usually provides addresses. Missing addresses were found via searches on http://www.google.com. The number of floors was additionally checked against the 1921 edition of the Atlas of the City. As a control group for our skyscrapers, we obtained building heights at 99 randomly chosen locations south of Central Park/59th Street using a standard random number generator.Footnote 20 Then, for each block chosen, we randomly chose a lot from the block. We then collected the depth to bedrock data as described above for each of these 173 locations, which included 74 skyscrapers and 99 random locations.
We also collected several economic and demographic controls including: manufacturing worker density (by Assembly District (AD)) from Edward E. Pratt, 1890 demographic characteristics (by Sanitation District (SD)) and park/cemetery space (by SD).Footnote 21 The SD level data came from Vital Statistics of New York.Footnote 22 We hypothesize that white collar firms would have an incentive to avoid locating in districts with large recent immigrant populations, as well as dense manufacturing districts. Park space would have been important for skyscrapers for two reasons: presumably more park space was associated with higher income neighborhoods, and access to sunlight was very important for the first generation of skyscrapers, so that park or cemetery space near a building would ensure greater light availability.Footnote 23
Being close to public transportation, especially rapid transit, was likely to benefit firms. We counted the number of elevated railway stops within a half-mile radius from each location in our data set from the 1890 Elevated Railway Map of New York.Footnote 24 We also calculated the distance in kilometers to the intersection Wall Street and Broadway in the heart of New York City's financial district. This variable can be considered a proxy for agglomeration benefits.
Lastly, we collected land value data from “Tentative Land Value Maps of the City of New York for 1909.”Footnote 25 In this source, land values are given per linear foot of street frontage. For each location in our sample, we take average land values of the block on which each observation resides. As land values increase, we expect taller buildings since real estate developers have an incentive to construct a taller building on less land instead of a shorter building on more land. Note that there is likely to be an endogenous relationship between land values and the presence of skyscrapers, because the land value data is from 1909. Ideally, we would like to have land values for a period prior to initial skyscraper construction, such as 1890, but these data are not available. We have decided to use land values as an independent variable in one of the specifications for the following reason: The emergence of separate business districts began in the second half of the nineteenth century, with the construction of the elevated railroads and the northward movement of the population. As such, the land values in 1909 most likely reflect land value patterns that were in place before the development of skyscrapers. In addition, however, we are less concerned about the estimated coefficient for the land value variable, but rather we are interested in including it as a possible control variable, to see how its inclusion affects the estimate of the depth to bedrock variable. As will be discussed in more detail below, its inclusion provides evidence that, holding land values constant, depth to bedrock did have some influence on the placement of skyscrapers. For example, within lower Manhattan, builders were sensitive to the expense of anchoring the building to the bedrock. However, the effect of bedrock is small when compared to the effects for other variables.
DEPTH TO BEDROCK AND CONSTRUCTION COSTS
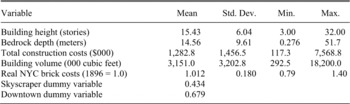
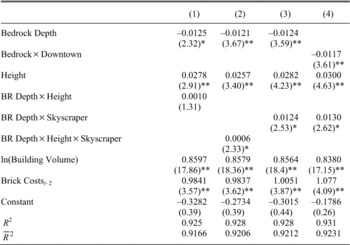
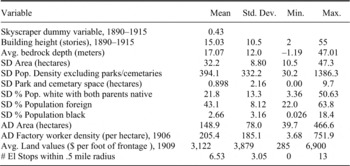
Table 1 provides the descriptive statistics of the variables contained in the construction cost data set described above. Table 2 presents the results of regressions of the log of total costs on several important variables. Equation 1 in Table 2 includes the depth to bedrock, the building height, the building volume, an index of brick costs in New York City, and an interaction term between the building height and the depth to bedrock. Because bedrock should have the most important effect for a tall building, equation 2 in Table 2 includes an interaction term between the building height, the depth to bedrock, and a dummy variable that takes on the value of one if the building is a skyscraper (18 floors or greater), and zero otherwise.Footnote 26 We interact the depth to bedrock with a skyscraper dummy variable (but not height) in equation 3. In equation 4, we interact the bedrock variable with a downtown dummy variable (south of 14th Street) because downtown the subsoil is often wet and comprised of quicksand.
DESCRIPTIVE STATISTICS FOR FIFTY-THREE BUILDINGS CONSTRUCTED IN MANHATTAN FROM 1899–1915

Note:
Note that Brick Costs Statistics are Based on Annual Time Series Data.
All four specifications give very similar results. We see that the coefficients of the bedrock variables are all significantly different from zero in all specifications. However, we see that deep bedrock, on its own, actually lowers the cost of construction. Presumably this is because having bedrock too near the surface is a hinderance to clear space for a foundation, and the bedrock may need to be blasted away. When building a skyscraper of sufficient height, deep bedrock increased costs as expected. In equation 1, the sum of depth to bedrock and the interaction of depth to bedrock and height yields an increase in construction costs due to bedrock if the building is greater than about 21 stories. If we consider estimation 2, with the height-skyscraper interaction, for a building of approximately 20 stories or taller, bedrock becomes a net cost. As an extreme example, the tallest building in our cost data set with 32 stories is associated with a net coefficient of 0.0071. This would equate to an increase in total construction cost of about $9,000 for each additional meter of depth to bedrock. If we consider a one-standard-deviation change in depth to bedrock from the average of 9.61 meters, we get slightly more than a $90,000 (7 percent) increase in total building costs for this skyscraper.Footnote 27
DEPENDENT VARIABLE: LN(TOTAL COST)

*Statistically significant at 95 percent level
**Statistically significant at 99 percent level.
Notes:
There are 53 observations. Robust t-statistics are below the coefficients.
Comparing these additional costs relative to the costs of land show bedrock costs to be quite small. Specifically, average land values per foot of street frontage were $7,223 south of City Hall, $927 between City Hall and 14th Street, and $2,354 north of 14th Street. The average plot size for a skyscraper in our data set is just over 25,000 square feet (about 160 feet squared). If we assume 160 feet of frontage for a skyscraper and multiply this by the land values per foot, we get the following land value estimates for a skyscraper lot in each area of interest: $1,155,000 south of City Hall, $148,300 between City Hall and 14th Street, and $376,000 north of 14th Street.
Next, consider the average depth to bedrock in each of these three regions: 22 meters south of City Hall, 26 meters between City Hall and 14th Street, and 7 meters north of 14th Street. If one additional meter of bedrock increased costs by about $9,000 (as reported above), then constructing a skyscraper on the average lot in the bedrock valley was only $36,000 more expensive (since the bedrock is four meters deeper on average) compared to south of City Hall. But the lot in the bedrock valley is less expensive by more than $1,000,000 compared to a similar lot south of City Hall. A developer would have saved substantial sums of money by buying a lot in the bedrock valley at a much lower price and paying the additional costs of digging to the bedrock. In addition, building a skyscraper north of 14th Street would have saved 19 meters of digging to bedrock compared to the bedrock valley for a savings of. Again, the savings in terms of bedrock costs are smaller than the difference in the value of land between the two areas. The fact that developers were willing to build on these other lots at greater net costs suggests that other explanations are more plausible for the lack of skyscrapers in the bedrock valley, namely, agglomeration externalities, and other economic and demographic factors, which we explore next.
DESCRIPTIVE STATISTICS
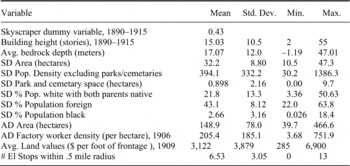
Note:
SD, AD means are weighted based on number of buildings in these areas. There are 173 observations. All data are from 1890, except where otherwise noted.
DEPTH TO BEDROCK AND SKYSCRAPER LOCATION
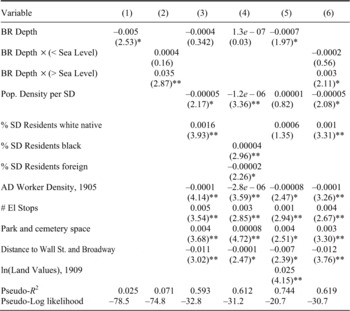
Because we are interested in whether the bedrock or other variables influenced the spatial distribution of tall buildings, we perform a probit analysis, which estimates the probability of a skyscraper (versus nonskyscraper) being built at a particular location as a function of the variables described above.Footnote 28 Table 3 shows the descriptive statistics of these variables, and Table 4 shows the results from various probit specifications.
PROBIT REGRESSION
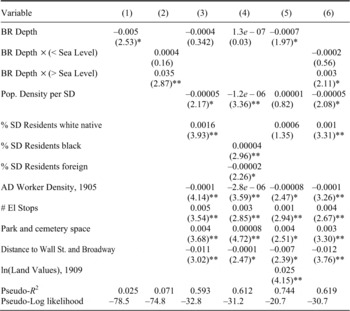
*Significant at the 95 percent level;
**Signficant at the 99 percent level.
Notes:
Dependent Variable: skyscraper = 1; no skyscraper = 0. Marginal effects are reported; z-statistics below marginal effects. We ran the regressions with weights that were the inverse of the building height, to account for the oversampling of skyscrapers in the data set.
Generally, as can be seen from Table 4, the coefficients have the expected signs. The likelihood of a skyscraper being built decreases with the depth to bedrock at the location (though is not significantly different from 0), the distance to the city center of Wall Street and Broadway, and in the density of manufacturing workers in the area. The probability of a skyscraper increases with more access to transit stops, higher land values, increases in the percent native whites in the neighborhood, and with more park space in the neighborhood.
In addition, to parse out possible bedrock effects, in Table 4, equations 2 and 6, show the results of regressions where the bedrock variable is split into two variables: the depth to bedrock interacted with a dummy variable if the bedrock is below sea level and the depth to bedrock interacted with a dummy variable if the bedrock is above sea level. Presumably, if the bedrock is below sea level, digging down to it would be more difficult because it would be more likely to contain wet soil or quicksand. From these regressions, however, there is no effect from the bedrock that is below sea level, while we see a positive effect from the depth to bedrock above sea level indicating that deep bedrock is conducive to building a skyscraper. The reason for this is most likely due to the fact that the bedrock above sea level is also very close to the surface, and thus the more likely it has to be removed via blasting. This result also concords with our total cost regressions which show a negative cost effect for bedrock when a nonskyscraper is being built.
As discussed above, land prices are most likely endogenous, but we include them in one specification, equation 5, to investigate their effects. Because of the possible endogeneity, those results must be interpreted with caution. As we can see, and as would be expected, land prices are perhaps the most important factor in the location of skyscrapers. However, more importantly when we include land values in the equation, we see that the coefficient for the bedrock variable becomes statistically significant. This suggests that within regions of the city, controlling for land values, builders did have some sensitivity to the additional costs associated with depth to bedrock. We provide further evidence of this, with our counterfactual exercises provided below (and which do not include land values).Footnote 29
LOCAL BEDROCK EFFECTS
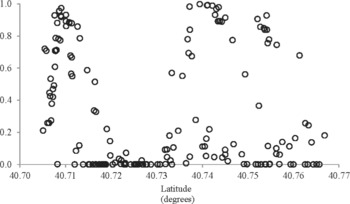
To isolate the effect of bedrock on skyscraper location, we examine the predicted skyline if bedrock is held constant across the city. To do so, we removed the bedrock variable from the regression and then reran the regression to get predicted values from equation 3 in Table 4. The results of this exercise, in Figure 3, show that even with constant bedrock throughout the city, there still would be an absence of skyscrapers in the middle latitudes of the city.
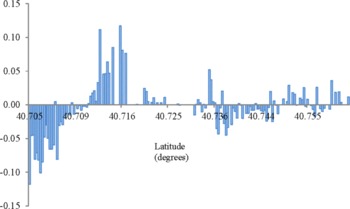
The change in probability between the estimated model and the depth to bedrock held constant model in Figure 4 is defined as. The first thing to notice is that the change in probabilities is generally very small. The largest change is 11.8 percent in absolute value. Had bedrock been a strong determinant of the location of skyscrapers, we would expect to see much larger changes in the predicted probabilities north of City Hall and below 14th Street.
PREDICTED PROBABILITY OF A SKYSCRAPER VERSUS LATITUDE, HOLDING BEDROCK DEPTHS CONSTANT

DIFFERENCE BETWEEN PREDICTED VALUES WITH BEDROCK DEPTH VARIATION AND PREDICTED VALUES WITH CONSTANT BEDROCK DEPTH  VERSUS LATITUDE

There is some evidence that builders were sensitive to a limited degree to the depth to bedrock within the lower part of Manhattan. The positive probabilities in the northern part of lower Manhattan indicate that if bedrock depths were not an issue, we would have likely seen more skyscrapers in the area around City Hall and fewer in the area around Wall Street, which is just under a half mile away. This suggests that depth to bedrock may have influenced the placement of skyscrapers within the downtown business district.
CONCLUSION
In the urban and economic geography literatures, economists have debated the relative importance of natural advantages versus knowledge spillovers and economies of scale. In New York, the conventional wisdom is that the depth to bedrock provided a natural disadvantage, pushing economic activity away from locations where the bedrock was the deepest below the surface. The evidence we provide suggests that the natural disadvantages of locations within Manhattan played a relatively minor role in the spatial location of skyscrapers. The costs of anchoring skyscrapers to the bedrock were modest relative to overall construction costs (up to 7 percent, on average) and were far smaller than land acquisition costs. The location decisions of skyscraper developers were not strongly affected by the depth to bedrock. Rather economic and demographic factors, such as access to public transportation and population densities, far outweighed the effect of depth to bedrock on the location of skyscrapers. We do find evidence, however, that within the lower Manhattan business district, builders were sensitive to the costs. Overall, our work suggests that the historiography about New York City's skyline formation overstates the importance of bedrock and needs to be revised. In the larger literature on location, it provides an example where geological obstacles were not an important determinant of land use patterns.