Implications
The optimal numbers of reference animals that have been genotyped could achieve a balance between reducing the cost of genotyping animals and gaining an economic profit. Our results indicated that a genotyping rate of 40% or 50% for each litter of purebred swine in four previous generations with phenotypic and genotypic records was enough to get asymptotic maximum prediction accuracy for genotyped animals. This provided a cost-effective and computationally efficient way to construct swine reference populations for Chinese pig breeding companies.
Introduction
With the rapid development of high-throughput genotyping technologies, genomic selection (Meuwissen et al., Reference Meuwissen, Hayes and Goddard2001) has been successfully implemented in the livestock field (Meuwissen et al., Reference Meuwissen, Hayes and Goddard2016). The dairy industry was the first to carry out a routine genomic evaluation (Hayes et al., Reference Hayes, Bowman, Chamberlain and Goddard2009; VanRaden et al., Reference VanRaden, Van Tassell, Wiggans, Sonstegard, Schnabel, Taylor and Schenkel2009). Compared with traditional methods based on progeny testing, genomic selection enables earlier and more accurate prediction of breeding values, resulting in great improvement in genetic gains. Other livestock species, such as pigs and chickens, have also been subjected to genomic evaluation in an effort to increase genetic gains (Wolc et al., Reference Wolc, Arango, Settar, Fulton, O’Sullivan, Preisinger, Habier, Fernando, Garrick and Dekkers2011; Christensen et al., Reference Christensen, Madsen, Nielsen, Ostersen and Su2012).
Current pig breeding systems are characterized by short generation intervals; therefore, compared with Holstein breeding, the influence of genomic selection is expected to be much smaller. However, because of the poor accuracy of estimated breeding values (EBVs) using BLUP in pigs (Muir, Reference Muir2007), genomic selection could be incorporated to efficiently increase swine genetic gains by considering information on Mendelian inheritance through genetic markers at a relatively younger age.
Among genomic prediction methods, single-step genomic BLUP (ssGBLUP) is considered a promising replacement of the conventional BLUP for pig breeding. The fundamental utility of ssGBLUP is to integrate marker information into the pedigree-based relationship matrix such that information for both genotyped and non-genotyped animals can be used simultaneously (Christensen and Lund, Reference Christensen and Lund2010; Aguilar et al., Reference Aguilar, Misztal, Johnson, Legarra, Tsuruta and Lawlor2010). On one hand, ssGBLUP has similar or greater accuracy than various multi-step methods for predicting genotyped animals in validation population (Christensen et al., Reference Christensen, Madsen, Nielsen, Ostersen and Su2012; Gao et al., Reference Gao, Christensen, Madsen, Nielsen, Zhang, Lund and Su2012; Su et al., Reference Su, Madsen, Nielsen, Mäntysaari, Aamand, Christensen and Lund2012; Li et al., Reference Li, Wang, Huang, Li, Zhang and Ding2014; Guo et al., Reference Guo, Christensen, Ostersen, Wang, Lund and Su2015). On the other hand, ssGBLUP outperforms the pedigree-based method BLUP for the prediction of non-genotyped animals in validation population (Christensen et al., Reference Christensen, Madsen, Nielsen, Ostersen and Su2012; Guo et al., Reference Guo, Christensen, Ostersen, Wang, Lund and Su2015). The potential incompatibility in scale between the coefficients of G and A 11 involved in the H matrix could lead to incorrect weighting of the pedigree and genomic information (VanRaden Reference VanRaden2008). Indeed, certain studies have reported that ssGBLUP with adjustments of the genomic relationship matrix produces more accurate predictions than ssGBLUP with the original genomic relationship matrix (Christensen et al., Reference Christensen, Madsen, Nielsen, Ostersen and Su2012; Gao et al., Reference Gao, Christensen, Madsen, Nielsen, Zhang, Lund and Su2012).
Although the application of ssGBLUP for real pig data is very promising, certain factors that affect ssGBLUP performance should be evaluated carefully to achieve a cost-effective and computationally efficient genomic evaluation before its implementation. There is limited knowledge about the effects of the amount of phenotypic and genotypic information in previous generations on predicting breeding values of animals in the validated generation. The amount of information can greatly influence the cost of animal genotyping, phenotype recording and computational demands. In this regard, it is necessary to achieve an optimal balance to ensure a cost-effective and computationally efficient genomic evaluation when ssGBLUP is applied.
Therefore, the objective of this study was to assess the impact of the amount of phenotypic and genotypic information in previous generations on the accuracy of genomic prediction for genotyped animals of validation population in various scenarios. For this purpose, we used ssGBLUP with the adjusted genomic relationship matrix. The resulting simulated swine populations were established by considering various morphological and physiological traits and population structures. The results will provide useful guidance for establishing Chinese swine reference populations in the near future.
Materials and methods
Data
The structure of the data used in this study was simulated by mimicking swine populations as similarly described in Yang and Su (Reference Yang and Su2016). To simplify the simulation procedure but without loss of generality, data were generated in a relatively simple procedure with non-overlapping generations. We carried out a series of simulations using the multiple-trait genomic simulation software GPOPSIM (Zhang et al., Reference Zhang, Li, Ding, Li and Zhang2015).
Similar to the study of Wang et al. (Reference Wang, Li, Qian, Su, Zhang and Ding2017), the simulation was initiated with a base population consisting of 100 individuals, followed by 10 000 non-overlapping historical generations with the same population size in each generation (denoted as generation −10 000 to generation −1). Five chromosomes with a total length of 5 Morgan (1 Morgan per chromosome) were simulated. On each chromosome, 2000 markers were evenly distributed, and the middle of two adjacent markers was assumed to harbor a potential quantitative trait locus (QTL). All loci were monomorphic at the starting status. Haldane’s mapping function was used to calculate recombination rates between adjacent loci. In each historical generation, 50 males were randomly mated with 50 females, and each mating produced one male and one female offspring. Polymorphic loci were generated in subsequent generations with a mutation rate of 1.25 × 10⁻³ and reached the mutation-drift equilibrium status through genetic drift. After 10 000 historical generations, a total of 1000 QTLs affecting phenotypes were randomly sampled from these potential QTLs with polymorphism from the whole genome, and all segregating markers were used for the following analysis. A total of 25 recent generations (numbered from 0 to 24) were further generated. We simulated two kinds of population structures: (1) Population S20D10N10 was generated with 20 sires considering a sex ratio of 1:10 and one litter size of 10 individuals corresponding to 2000 animals with records in each generation. (2) Population S50D20N10 was generated with 50 sires considering a sex ratio of 1:20 and one litter size of 10 individuals corresponding to 10 000 animals with records in each generation. These two populations consisted of 25 generations, among which generation 0 was assumed to be the base population and generations 1 to 24 had phenotypic records.
Two genetically correlated traits (denoted as trait A and trait B) were simulated. The sampled 1000 QTLs were divided into three groups (i.e., Group1, Group2 and Group3). Quantitative trait loci in Group1 were assigned to affect both traits simultaneously (i.e., pleiotropic QTLs), whereas QTLs in Group2 and Group3 affected one single trait, A and B, respectively. The allele substitution effects of each QTL in Group1 were sampled from a bivariate normal distribution, and those in Group2 or Group3 were drawn from univariate normal distributions (see details in Zhang et al., Reference Zhang, Li, Ding, Li and Zhang2015). The true breeding value (TBV) of each trait for animal i was calculated as:  $${\rm }g_{i} {\equals}\mathop \sum\limits_{j{\equals}1}^{N_{{{\rm QTL}}} } x_{{ij}} \alpha '_{j} $$, where x ij represents the number of allele ‘1’ that animal i carried at locus j, and
 $$\alpha '_{j} $$ is the allele substitution effect of the jth QTL. It should be noted that the allele substitution effects were re-scaled, that is,
 $$\alpha '_{j} {\equals}\sqrt {{{1.0(2.0)} \over {\sum^ 2p_{i} \left( {1{\minus}p_{i} } \right){\times}\alpha _{j}^{2} }}} {\times}\alpha _{j} $$, which ensured the total additive genetic variances of 1.0 and 2.0 for trait A and trait B, respectively.
The heritabilities assumed for the two traits were  $h_{A}^{2} {\equals}0.35$ and
 $ h_{B}^{2} {\equals}0.10{\rm }$, which were similar to production-related traits such as backfat thickness and reproductive traits such as total number of piglets born, respectively. The residual variance of each trait was calculated from its heritability and additive genetic variance (
 $\sigma _{a}^{2} {\equals}$1.0 for trait A, and
 $\sigma _{a}^{2} {\equals}$2.0 for trait B). Random residuals of two traits for each animal were sampled from a bivariate normal distribution
 ${\rm }\left[ {\matrix{ {{\rm e}_{1} } \cr {{\rm e}_{2} } \cr } } \right]\,\sim\,{\rm N}\left( {\left[ {\matrix{ 0 \cr 0 \cr } } \right],{\rm }\left[ {\matrix{ {\sigma _{{e_{1} }}^{2} } & {\sigma _{{e_{1} e_{2} }}^{2} } \cr {\sigma _{{e_{1} e_{2} }}^{2} } & {\sigma _{{e_{2} }}^{2} } \cr } } \right]} \right)$. Thus, phenotypic values of trait A and trait B for each animal were generated by adding random residuals to TBVs. The genetic correlation between two traits was set to 0.20, and the residual correlation was set to −0.30.
Statistical analysis
A two-trait ssGBLUP model was used to predict genomic breeding values of these two simulated traits of animals in validation population. In terms of a matrix, the two-trait ssGBLUP is described as follows:
 $$\left[ {\matrix{ {{\it y}_{1} } \cr {{\it y}_{2} } \cr } } \right]{\equals}\left[ {\matrix{ 1 & 0 \cr 0 & 1 \cr } } \right]\left[ {\matrix{ {\mu _{1} } \cr {\mu _{2} } \cr } } \right]{\plus}\left[ {\matrix{ {{\it Z}_{1} } & 0 \cr 0 & {{\it Z}_{2} } \cr } } \right]\left[ {\matrix{ {{\it g}_{1} } \cr {{\it g}_{2} } \cr } } \right]{\plus}\left[ {\matrix{ {{\it e}_{1} } \cr {{\it e}_{2} } \cr } } \right],$$
where y 1 and y 2 represent the vectors of phenotypic observations for traits A and B, μ 1 and μ 2 are overall phenotypic means, g 1 and g 2 are the vectors of additive genetic effects, Z 1 and Z 2 are the incidence matrices linking g 1 to y 1 and g 2 to y 2, and e 1 and e 2 are the vectors of residuals for y 1 and y 2, respectively. It was assumed that  ${\rm }\left[ {\matrix{ {{\it g}_{1} } \cr {{\it g}_{2} } \cr } } \right]\,\sim\,{\rm N}\left( {\left[ {\matrix{ 0 \cr 0 \cr } } \right],{\rm }{\it H}\,\otimes\,\left[ {\matrix{ {\sigma _{{g_{1} }}^{2} } & {\sigma _{{g_{1} g_{2} }} } \cr {\sigma _{{g_{2} g_{1} }} } & {{\rm \sigma }_{{g_{2} }}^{2} } \cr } } \right]} \right),$
 $\left[ {\matrix{ {{\it e}_{1} } \cr {{\it e}_{2} } \cr } } \right]\,\sim\,{\rm N}\left( {\left[ {\matrix{ 0 \cr 0 \cr } } \right],{\rm }{\it I}\,\otimes\,\left[ {\matrix{ {{\rm \sigma }_{{e_{1} }}^{2} } & {{\rm \sigma }_{{e_{1} e_{2} }} } \cr {{\rm \sigma }_{{e_{2} e_{1} }} } & {{\rm \sigma }_{{e_{2} }}^{2} } \cr } } \right]} \right){\rm }$
where I is the identity matrix and H is the genetic relationship matrix. H is constructed by combining information from markers and pedigree information and is defined as
 $${\it H}{\equals}\!\left[ {\matrix{ {{\it G}_{{\it \alpha }} } & {{\it G}_{{\it \alpha }} {\it A}_{{11}}^{{{\minus}1}} {\rm }{\it A}_{{12}} } \cr {{\rm }{\it A}_{{21}} {\it A}_{{11}}^{{{\minus}1}} {\rm }{\it G}_{{\it \alpha }} } & \!\!\!{{\it A}_{{21{\rm }}} {\it A}_{{11}}^{{{\minus}1}} {\rm }{\it G}_{{\it \alpha }} {\rm }{\it A}_{{11}}^{{{\minus}1}} {\rm }{\it A}_{{12{\rm }}} {\plus}{\it A}_{{22}} {\minus}{\it A}_{{21{\rm }}} {\it A}_{{11}}^{{{\minus}1}} {\rm }{\it A}_{{12{\rm }}} } \cr } } \right]{\rm },$$
in which G α = 0.95G *+0.05A 11, where A 11, A 22 and A 12 (or A 21) are submatrices of the A matrix (pedigree-based numerator relationship matrix), and subscripts 1 and 2 refer to genotyped and non-genotyped animals, respectively. The original genomic relationship matrix (G) was constructed using the first method of VanRaden (Reference VanRaden2008), and then the G matrix was modified to be on the same scale as the A matrix to produce the adjusted matrix G * according to Christensen et al. (Reference Christensen, Madsen, Nielsen, Ostersen and Su2012). The inverse of H was
 $${\it H}^{{{\minus}1}} {\equals}\left[ {\matrix{ {{\it G}_{{\it \alpha }} ^{{{\minus}1}} {\minus}{\it A}_{{11}}^{{{\minus}1}} } & 0 \cr 0 & 0 \cr } } \right]{\plus}{\it A}^{{{\minus}1}} $$
The two-trait BLUP model was similar to the two-trait ssGBLUP model, except the H matrix was replaced with the A matrix.
The variance and covariance components of additive genetic effects and residuals were estimated by two-trait BLUP with pedigree information using the restricted maximum likelihood approach, and then these estimates were used for two-trait ssGBLUP to predict genomic breeding values based on the same dataset to reduce computation time. The variance and covariance components were estimated using the DMUAI module, and two-trait ssGBLUP was performed using the DMU5 module from the DMU package (Madsen and Jensen, Reference Madsen and Jensen2013). Two-trait ssGBLUP in DMU was useful for solving no more than 50 000 genotyped animals.
Scenarios
For each population, animals in the last generation (i.e., generation 24) were considered as the validation population. Half the number of animals in the last generation had genotypes, and half did not have genotypes. The pedigree included 25 recent generations in which generation 0 was assumed to be the base population.
Genomic prediction was carried out using various reference datasets that differed in terms of the number of generations having phenotypic and genotypic records. Six genotypic datasets were created, and each included the latest 1, 2, 3, 4, 5 or 7 generations (i.e., generation 23, 22-23, 21-23, 20-23, 19-23 and 17-23) before generation 24. Six genotyping rates of animals in each litter were applied to these generations with genotypic records (i.e., 20%, 30%, 40%, 50%, 70% and 100%). The phenotypic datasets included generations with the genotypic records mentioned above and plus additional previous generations (0, 1, 5, 10 or all) based on corresponding genotypic datasets. For example, if genotypic data included seven generations, the additional phenotypic data comprised a maximum of 16 more generations, because the total number of generations of the reference population available was 23. For each scenario, only 10 replicates were performed owing to limited computation time. The simulation procedure as well as the validation and reference population structures are depicted in detail in Table 1.
Overview of the simulated population structure of purebred swine

The same pedigree (generation 0-24) was used for each scenario.
Validations
The impact of the amount of genotypic and phenotypic information in previous generations on the prediction accuracy was assessed based on the accuracy and unbiasedness of genomic prediction for genotyped animals in the last generation. The prediction accuracy was measured by the correlation between genomic EBVs (GEBVs) and TBVs. The unbiasedness of genomic prediction was measured by the regression coefficient of TBVs on GEBVs. The mean and standard error of 10 replicates were calculated. One-way ANOVA was performed to determine the statistical significance of differences in the accuracy of genomic prediction between different scenarios with regard to the depth of phenotypic information, genotypic information and genotyping rate. A P-value of <0.01 was considered as the significant threshold. When one-way ANOVA showed the statistical significance, the stringent Bonferroni multiple test correction was used.
Results
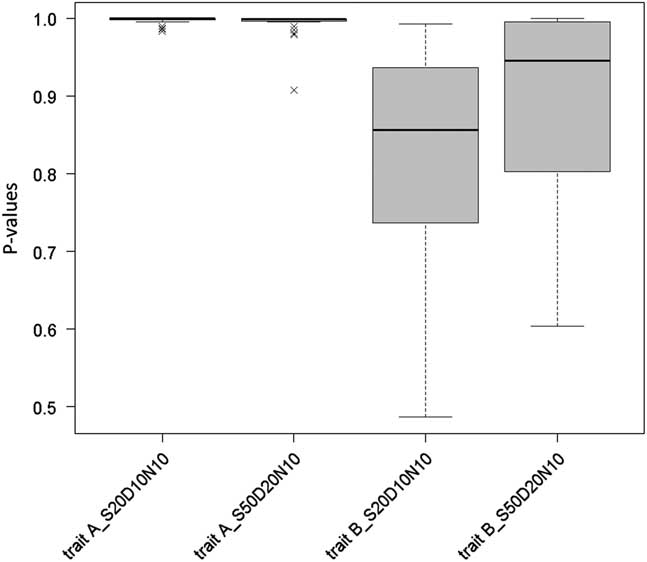
One-way ANOVA was performed to compare the impact of different numbers of phenotypic records in previous generations on the prediction accuracy of GEBV when the number of generations with genotypic records was fixed. As shown in Figure 1, P-values ranged from 0.908 to 1.00 for trait A and from 0.604 to 1.00 for trait B in S50D20N10, whereas they ranged from 0.983 to 1.00 for trait A and from 0.486 to 0.995 for trait B in S20D10N10. Phenotypic records for previous generations without animals that had been genotyped did not have a significant impact on the prediction accuracy of GEBV for animals in the validated generation (i.e., the last generation) in either population.
The distribution of P-values from one-way ANOVA to compare the impact of different amounts of phenotypic information on the prediction accuracy in each combined level of genotypic generation and genotyping rate in the simulated populations of purebred swine. S20D10N10: 20 sires, 10 dams per sire and 10 offspring per dam in each generation; S50D20N10: 50 sires, 20 dams per sire and 10 offspring per dam in each generation. Trait A: A simulated trait with heritability 0.35; Trait B: A simulated trait with heritability 0.10.

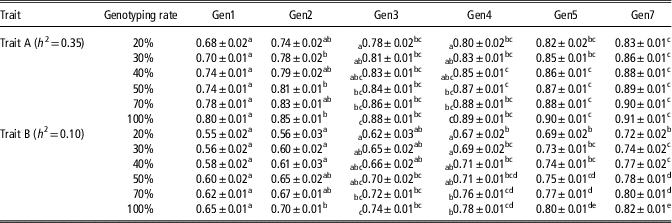
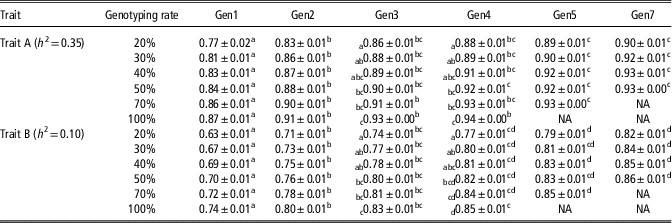
Tables 2 and 3 present data concerning the impact of the amount of genotypic information for previous generations on the prediction accuracy of GEBV. For trait A with high heritability, we compared differences between different numbers of previous generations. Inclusion of data for three previous generations with genotyped animals was sufficient with regard to the prediction of accuracy of GEBV, while inclusion of genomic data for four or more previous generations did not significantly improve the accuracy compared with three generations used in different scenarios of genotyping rates for both populations. However, for trait B with low heritability, there was not a consistent trend in S20D10N10 that showed that it was sufficient to add three previous generations for a genotyping rate of 20%, four previous generations for genotyping rates 30%, 40%, 50% and 70%, and five previous generations for a genotyping rate of 100%. For S50D20N10, the addition of four previous generations of genotype records was sufficient to yield prediction accuracy comparable with that when more generations were used.
Prediction accuracy ± standard error in S20D10N10 estimated from ssGBLUP with different reference populations, which only included different previous generations having genotypic records and different genotyping rates in the simulated populations of purebred swine

a,b,c,d,ePrediction accuracy values of genomic estimated breeding value (GEBV) within a row within each trait with no common superscript differ significantly (P <0.01).
a,b,cPrediction accuracy values of genomic estimated breeding value (GEBV) within a column within a trait with no common subscript differ significantly (P <0.01) in generations 3 and 4.
Genotyping rate: 20%, 30%, 40%, 50%, 70% or 100% of animals in each litter in previous generations were genotyped, respectively.
Gen*: last generations, i.e., generations 1-23.
S20D10N10: 20 sires, 10 dams per sire and 10 offspring per dam in each generation.
ssGBLUP: Single-step genomic best linear unbiased prediction.
Trait A: A simulated trait with heritability 0.35; Trait B: A simulated trait with heritability 0.10.
Prediction accuracy ± standard error in S50D20N10 estimated from ssGBLUP with different reference populations which only included different previous generations having genotypic records and different genotyping rates in the simulated populations of purebred swine

a,b,c,dPrediction accuracy values of genomic estimated breeding value (GEBV) within a row within each trait with no common superscript differ significantly (P <0.01).
a,b,c,dPrediction accuracy values of genomic estimated breeding value (GEBV) within a column within a trait with no common subscript differ significantly (P <0.01) in generations 3 and 4.
Genotyping rate: 20%, 30%, 40%, 50%, 70% or 100% of animals in each litter in previous generations were genotyped, respectively.
Gen*: last generations, i.e., generations 1-23.
S50D20N10: 50 sires, 20 dams per sire and 10 offspring per dam in each generation.
ssGBLUP: Single-step genomic best linear unbiased prediction.
Trait A: A simulated trait with heritability 0.35; Trait B: A simulated trait with heritability 0.10.
Then, reference datasets that included three or four previous generations were used to investigate the influences of different genotyping rates for each litter on the prediction accuracy. As shown for generations 3 and 4 in Tables 2 and 3, for the high-heritability trait A, we found a clear trend in both populations that the data including a genotyping rate of 40% for each litter in three previous generations was comparable with other larger genotyping rates in terms of prediction accuracy. For the low-heritability trait B, it was necessary to include a genotyping rate of 40% of each litter in the four previous generations to obtain accuracy comparable to that of genotyping rate 100% in S20D10N10, whereas 50% of each litter in the four previous generations was needed in S50D20N10.
Although datasets that differed in terms of the amount of phenotypic and genotypic information in previous generations yielded different estimates of GEBV prediction accuracy, regression coefficients (see Supplementary Tables S1 and S2) were close to 1.0 (range, 0.97 ± 0.01 to 1.17 ± 0.16) among different populations, datasets, and traits averaged over 10 replicates. For S50D20N10, GEBV prediction accuracy was greater than that estimated from S20D10N10 in all scenarios as expected because the population size was greater than that of S20D10N10.
Discussion
The present study investigated the influences of the amount of phenotypic and genotypic information in previous generations on the prediction accuracy of GEBV for genotyped animals of the validation population in various scenarios. Our results reveal that datasets that include the latest three to four generations with phenotypic and genotypic records and a genotyping rate of 40% or 50% for each litter could achieve a prediction accuracy of GEBV comparable to that obtained using the full dataset, depending on population structure and heritability of the trait. Although slightly reducing the accuracy of predicting GEBV with reduced datasets, this could greatly reduce the cost of genotyping and the burden on computational resources. Thus, it is very worthwhile to use reduced datasets in practical breeding.
Studies have demonstrated that ssGBLUP can yield higher prediction accuracy than GBLUP for genotyped animals as well as a higher prediction accuracy than BLUP for non-genotyped animals in cattle and pig data owing to the ability to integrate genotypic and pedigree information (Christensen et al., Reference Christensen, Madsen, Nielsen, Ostersen and Su2012; Gao et al., Reference Gao, Christensen, Madsen, Nielsen, Zhang, Lund and Su2012; Su et al., Reference Su, Madsen, Nielsen, Mäntysaari, Aamand, Christensen and Lund2012; Guo et al., Reference Guo, Christensen, Ostersen, Wang, Lund and Su2015). Our results confirmed the fact that ssGBLUP could yield higher prediction accuracy than BLUP. When datasets included four previous generations with a genotyping rate of 40% or 50% of each litter, for genotyped animals in the validation population, ssGBLUP had much higher prediction accuracy than BLUP, and increments ranged from 0.30 to 0.43 for trait A and trait B in both populations. Moreover, for non-genotyped animals, the increments for EBV prediction accuracy of ssGBLUP over BLUP ranged from 0.06 to 0.10 for trait A and trait B in both populations. Therefore, ssGBLUP is a very promising approach to replace BLUP to perform routine genomic evaluation in future pig breeding programs.
In this study, we found only a small effect of including phenotypic information from previous generations in which animals had not been genotyped on GEBV prediction accuracy. ssGBLUP using phenotypic records from previous generations with animals genotyped was sufficient, and excluding phenotypic information from early generations did not affect the accuracy. Similarly, the influence of phenotypic records from early generations on the prediction accuracy of BLUP was also small (results not shown). This may be attributable to the fact that, on the one hand, all parents of the validation individuals and many sibs of these parents were in the same generation, so that the contributions of phenotypic records of previous generations without individuals genotyped were limited; on the other hand, the full pedigree used in this study could estimate overall genetic relationships and inbreeding coefficients between animals.
Generally, prediction accuracy increases when the reference population is enlarged. Our results confirmed this trend that prediction accuracy improved as the number of individuals genotyped in previous generations increased in each scenario of genotyping rate for each litter. However, there was the small marginal increase of prediction accuracy when the reference population is sufficiently large (Karaman et al., Reference Karaman, Cheng, Firat, Garrick and Fernando2016). This may result from the fact that the economic profit gained by increasing the prediction accuracy cannot compensate for the cost of genotyping animals. Our finding offers a good opportunity to find optimal numbers of reference animals that have been genotyped in the scenarios studied to achieve a balance between reducing the cost and gaining an economic profit. Given the cost of genotyping, it is not economic that all animals with phenotypic records are genotyped as reference population in practical pig breeding.
In our study, the optimal proportion of animals genotyped in a litter was investigated to get the optimal prediction accuracy and to reduce the cost of genotyping. The way to select animals genotyped in the study was that genotyping rates of each litter (each family) coming for every mating rather than genotyping rates of selecting all reference animals randomly was used, which would lead to less-related animal in reference population and get a higher prediction accuracy. This is consistent with the study of Wu et al. (Reference Wu, Lund, Sun, Zhang and Su2015), who found that a reference population consisting of less-related animals is favorable for reliability of genomic prediction and that closer relationships among reference animals results in lower reliability. We found that a genotyping rate of 40% of each litter in three previous generations for trait A and 50% in four previous generations for trait B, which was genotyped, could yield prediction accuracy comparable with 100% of each litter genotyped. This will greatly reduce the cost of genotyping and the burden on computational resources, although it has the consequence of slightly reducing the accuracy of predicting GEBV.
As expected, GEBV prediction accuracy was higher for trait A than trait B when the same scenario was used. More phenotypic information was needed for trait B than trait A to achieve a desirable prediction accuracy of GEBV. This is mainly attributable to the heritability of trait B (0.10), which was much lower than that of trait A (0.35); this is in accordance with the results from previous studies (Zhang et al., Reference Zhang, Ding, Liu, de Koning and Zhang2011; Jia and Jannink, Reference Jia and Jannink2012; Su et al., Reference Su, Madsen, Nielsen, Mäntysaari, Aamand, Christensen and Lund2012).
It should be noted that genomic evaluation is a continuous process in practical swine breeding; hence, at a minimum, a consistent proportion of animals in each litter should be used for continuous genotyping of subsequent generations and then used to continuously update the reference population. We recalculated the prediction accuracy for S20D10N10 when we used the same genotyping percentage of each litter in the last generation with the reference population. The prediction accuracy differed from the above results owing to different validation populations, but the trends of the two kinds of results were the same; that is, the 40% of each litter genotyped in four previous generations was optimal for S20D10N10 (see Supplementary Table S3). One advantage of our study is that the optimal amount of genotypic and phenotypic information in the reference population still can be meaningful to reduce computational demand, much like the optimization of the amount of phenotypic information needed using BLUP in traditional genetic evaluations – even if all animals are genotyped in the reference and validation populations using low-cost single nucleotide polymorphism chips.
In Chinese swine breeding programs, BW and backfat thickness, which are adjusted for 100 days, are used to produce a parental index, and the maternal index contains the aforementioned production-related traits in addition to the total number of piglets born. The heritability of two production-related traits and a reproductive trait in the selection index are approximately 0.30 to 0.40 and 0.10, respectively, which are similar to the two traits simulated in our study. A cutoff value of 40% of each litter genotyped in four previous generations was sufficient to achieve a desirable GEBV prediction accuracy for both traits with genetic correlation 0.20 to serve as a reference population in a pig farm. In contrast, a cutoff value of 50% of each litter genotyped in four previous generations is necessary if the reference population is to be used region-wide (or nation-wide). These conclusions provide very useful guidance for Chinese pig breeding companies with respect to how a pig reference population should be chosen in a cost-effective and computationally effective way.
Acknowledgements
This work was supported by the National Natural Science Foundation of China (31601009), China Agriculture Research System (CARS-36), and the Pearl River S&T Nova Program of Guangzhou (201506010027).
Declaration of interest
The authors declare that there is no conflict of interest.
Ethics statement
This study was performed with simulated datasets; thus there is no relevance for approval of the work by the Ethics Committee.
Software and data repository resources
None of the data were deposited in an official repository.
Supplementary materials
To view supplementary material for this article, please visit https://doi.org/10.1017/S1751731118003567