1. Introduction
Motion planning is a prominent subject within the domain of autonomous vehicles [Reference Ziegler, Bender, Dang and Stiller1, Reference Liu and Bucknall2]. Motion planning methods typically rely on libraries of motion primitives (MPs). The generation of MPs is critical to ensure that motion planning generates feasible paths or trajectories and their planning performance. The numerical methods strongly rely on vehicle dynamic models, and their performance is constrained by model accuracy. In recent years, more and more fruitful methods have been proposed. In particular, physics-inspired learning has been coined for methods integrating physical knowledge in data-based modeling techniques [Reference Udrescu and Tegmark3–Reference Zhao, Wang and Xie5].
The motion planning method for autonomous vehicles based on MPs describes MP as short snippets of a solution while selecting the appropriate MPs during the planning process. Subsequently, the created local trajectory or path undergoes assessment via collision detection and heuristic functions to determine the optimal choice. This iterative search process continues until the ultimate target state is achieved [Reference Paden, Čáp, Yong, Yershov and Frazzoli6]. The fundamental issues of such a method are the generation of MPs and the feasibility verification of MPs.
Existing methods for generating MPs are mainly categorized into two types: model-based methods and methods based on demonstrative learning. In the model-based approach, the dynamical system of the vehicle is represented by ordinary differential equations or specific curves, and the MPs are generated using mathematical analysis. For example, control inputs of the vehicle can be applied based on the vehicle motion model to generate a sequence of motion states to obtain the MPs of the vehicle [Reference Paden, Čáp, Yong, Yershov and Frazzoli6, Reference LaValle7]. Complex motion models can be used to model vehicles very precisely. One benefit of MPs is that such precise models can be represented with little computational effort. For autonomous vehicles, the parametric curves are commonly used to represent MPs of the vehicle, and these MPs include Clothid curves [Reference Brezak and Petrovic8], Polynomial curves [Reference Petrov and Nashashibi9], Bezier curves [Reference Rastelli, Lattarulo and Nashashibi10], Dubins curves [Reference Liang, Jiang and Zhu11], and Reeds–Shepp curves [Reference Furtuna, Balkcom, Chitsaz and Kavathekar12–Reference Botros and Smith14].
There are two main types of approaches based on demonstrative learning. One is to mimic the motions using dynamical systems such as dynamic motion primitives (DMPs) [Reference Pastor, Hoffmann, Asfour and Schaal15, Reference Schaal16]. The other uses statistical machine learning methods, such as hidden Markov models (HMMs) [Reference Kulić, Ott, Lee, Ishikawa and Nakamura17], Gaussian mixture models (GMMs) [Reference Deng, Li, Kang, Chen and Chu18], and probabilistic movement primitives [Reference Paraschos, Daniel, Peters and Neumann19]. The generalization of the MPs of methods based on demonstrative learning is entirely dependent on the machine learning algorithm and the characteristics of the sample data. The DMP has better generalization advantages, adapts to motion planning specifications, and is robust to perturbations [Reference Ijspeert, Nakanishi, Hoffmann, Pastor and Schaal20]. This method extracts motion features by tuning the parameters of the basis functions and can learn position, velocity, and acceleration in time. It is widely used in humanoid robots and robotic arms, etc. Wang et al. [Reference Wang, Gong, Zhang and Chen21] proposed a method for segmented representation and extraction of MPs as well as primitive library building, and they implemented a probabilistic extraction algorithm to segment unlabeled trajectory data by improving the DMP and using the association representation parameter to connect the MP. However, accuracy is lower at the end of each MP. For achieving high-quality planning outcomes, discrete optimization [Reference Werling, Ziegler, Kammel and Thrun22] is a common approach. These algorithms utilize a finite set of MPs and a specific heuristic function to establish connections among various primitives. The recursive application of MPs using a state lattice [Reference Pivtoraiko, Knepper and Kelly23] can produce a tree graph, where the planning start and end points are mapped, and the results are determined by finding the shortest path. Although this approach is efficient, more is needed to guarantee an optimal solution, and the search results often necessitate further optimization.
The MPs approach to demonstrative learning generally consists of three main components: the demonstration phase (data collection), the learning phase, and the reproduction phase. A proficient human driver possesses strong cognitive and operational skills, allowing them to manage various complex and dynamic scenarios adeptly. Vehicle motion characteristics result from the vehicle’s mechanical structure and human drivers’ driving habits. Consequently, the intricate human-driving trajectory is disassembled into a substantial dataset of simple MP data, facilitating the study of human-driving behavior.
This study tackles the challenge of learning from human-driving data and formulating a human-like trajectory connecting predefined start-to-end states. This paper has three contributions: (i) The creation of a dataset to facilitate data-driven learning of MPs. (ii) The development of a vehicle model long short-term memory (VM-LSTM) MP generator based on this dataset. (iii) The construction of evaluation metrics for feature vectors of MPs using the Gaussian mixture model (GMM).
The rest of this paper is organized as follows. Section 2 briefly overviews MPs correlation works in the autonomous vehicle. Section 3 states the problem definition of the motion planning algorithm via MPs and gives a short overview of the proposed framework in this paper. Section 4 describes the human-driving data collection and the building of the MPs dataset. Present the VM-LSTM MPs generation network and MP feature vector evaluation model. Finally, Section 5 presents the experimental results. Section 6 gives the conclusion and future work.
2. Related works
MPs have been incorporated into numerous algorithms for autonomous driving. Grid-based or sampling-based approaches [Reference LaValle7, Reference Bhatia and Frazzoli24, Reference Kuffner and LaValle25] have been explored at both the kinematic and system dynamics levels in conjunction with environmental features. Only certain heuristic biases are introduced for the target state, such as Dubin’s distance [Reference Dolgov, Thrun, Montemerlo and Diebel26] or Euclidean distance. Ma et al. [Reference Ma, Xue, Kawabata, Zhu, Ma and Zheng27] introduced a fast RRT variant incorporating a series of offline templates as MPs. This approach utilizes the outcomes of upper-level behavioral decisions to determine the selection of a specific set of MPs for constructing the RRT search tree. We also attempt to employ the vehicle’s kinematic model for MP generation [Reference Li, Xue, Zhang, Wang and Zheng28]. Nevertheless, the MP generation method could be more complex for effectively addressing dynamic scenes. If the discretization is chosen excessively large, it simplifies the planning problem within a smaller space. However, this may result in the inability to find a solution, even behavioral in the continuous space (e.g., a narrow passage that can’t be traversed due to coarse discretization). Conversely, if the discretization is chosen excessively small, it leads to a graph explosion due to the curse of dimension [Reference LaValle and Kuffner29]. Indeed, not all MPs sampled by the algorithm are feasible or necessary depending on the environmental constraints and the vehicle’s state. When considering the generation of MPs in the time dimension, distinct vehicle operating states at different speeds over a fixed time interval will yield varying lengths of MPs. This can effectively address the issue above.
Techniques that can learn motor behavior from human demonstrations or reinforcement learning [Reference Gómez, González, Martínez-Marín, Meziat and Sánchez30]. and reproduce the learned behavior in a robotic system have the potential to generalize better to different tasks. Dynamic movement primitives (DMPs) were developed to represent a movement for programming by demonstration [Reference Ijspeert, Nakanishi and Schaal31, Reference Cohen, Bar-Shira and Berman32]. This method uses probabilistic models for learning MPs, so they can only handle small amounts of data effectively. Extracting low-dimensional data features to reconstruct the robot’s motion trajectory has been adopted in “programming by demonstration” [Reference Argall, Chernova, Veloso and Browning33, Reference Meng, Li, Zhang and Sun34].
In recent years, several methods have been developed to learn, generate, and apply MPs from human-driving trajectories. Chen et al. [Reference Chen, Karl and van der Smagt35] embed DMPs into the latent space of a time-dependent variational autoencoder (AE) framework. This work utilizes neural networks’ powerful feature extraction capability to transform the continuous variation of robot actions in high-dimensional space to low-dimensional space for processing. In ref. [Reference Qureshi, Miao, Simeonov and Yip36], a traditional sampling-based motion planning algorithm is used as a demonstrative example, and a deep learning model is used to learn the sampling process of the algorithm. This approach introduces scene data into the network model of sampling computation and can improve the operational efficiency of sampling-based algorithms. Since the training data are generated by the algorithm, it does not characterize the kinematics of the vehicle well. Researchers have also attempted to implement online incremental demonstrative learning for actual physical models [Reference Löw, Bandyopadhyay and Borges37]. This approach uses a probabilistic model to identify and classify raw vehicle trajectories in the system’s MP library. They use probabilistic movement primitives (ProMPs) to build the MP library and reconstruct trajectories.
To summarize the above work and to implement the generation and deployment of MPs based on human-driving data. We need to address the following three aspects: One is the definition of MPs and the construction of the dataset; the other is the generation of the MPs from a given initial state and goal state; the last one is the compact representation of the feasibility verification of MPs. Based on the above issues, this paper focuses on designing, constructing, and using MPs for autonomous vehicles.
3. Problem statement and overview of the proposed framework
3.1. Problem Statement
Autonomous vehicle planning algorithms in dynamic environments via MPs typically use MP for iterative exploration in the vehicle configuration space. It can be formally stated as follows. We use a fixed time sequence of trajectory points
 $X$
as a single MP, equivalent to the single MP feature vector
 $m$
. We use
 $u=\{x, y, \theta, v\}$
to denote a state in a sequence of trajectories. The formula is labeled as
 $X=\left\langle u_{1}, \right. u_{1},\ldots \left.u_{N}\right\rangle \Longleftrightarrow m=\left[v_{0}, x_{g},y_{g},\theta _{g},v_{g}\right]\longrightarrow \mathbb{R}$
, where
 $x, y$
denotes the position in a Cartesian coordinate system,
 $\theta$
and
 $v$
are the heading and velocity of the vehicle, respectively. The subscript
 $g$
denotes the local target state.
 $N$
is the number of trajectory points for a single MP. We can use Eq.(1) to represent the relationship between
 $X$
and
 $m$
. It indicates that a given MP feature vector
 $m$
can be transformed into a vehicle trajectory
 $X$
using the model
 $\psi$
.
 \begin{align} X=\psi (m) \end{align}
Further, trajectory planning by MPs can be formally stated as follows. Let
 $\chi$
be the configuration space of the vehicle. The vehicle’s trajectory can be represented as a series of discrete MPs M =
 $\{m_{0},m_{1},\ldots, m_{n}\}$
, where M is the MPs representation of the trajectory. Suppose we plan the future Ts trajectory of the vehicle. Let
 $\mathcal{M}(\chi, T)$
denote the set of trajectories consisting of trajectories from multiple MPs, where
 $t\in [0,T]$
. The vehicle trajectory can be generated from these MPs. The
 $x_{init},x_{goal}\in \chi$
are the constraints on the start and end points of the trajectory, corresponding to the constraints on
 $m_{0},m_{T}$
, respectively. Further let
 $J(M)$
be the loss function and
 $\sigma (m_{t})$
be the obstacle constraint. Under these assumptions, trajectory planning based on vehicle MPs can be formulated as Eq.(2), and the optimal trajectory
 $M*$
is the sequence of trajectories consisting of MMP with the smallest integrated loss.
 \begin{align} M* = & \arg \min _{M\in \mathcal{M}\left(\chi, T\right)} J\!\left(M\right) \nonumber\\ & \text{subj}.\mathrm{to}\colon \sigma (m_{t})=0\forall t\in [0,T] \nonumber\\ & \quad\quad x_{init}\in m_{0},x_{goal}\in m_{T} \end{align}
3.2. Overview of the proposed framework
This paper mainly focuses on the generation of MPs. The proposed algorithm uses human-driving trajectory data to construct an MP generation model. The trajectory data does not contain lane markings, other traffic participants, or traffic rules. In this paper, a trajectory that is “useful” is evaluated in terms of executability (satisfaction of vehicle kinematic constraints) and optimality (degree of similarity to human-driving trajectories). The main focus is to construct feature vectors of the MPs using the start and goal states of the MPs defined in the dataset. These feature vectors train the GMM model. In practice, the probability value of the similarity between each local target state and the human-driving data is calculated by the GMM model after sampling a series of local target states. The value of this value from the above two levels of usability analysis is that the higher probability of the value is executable but not necessarily optimal. Second, the probability value of each solution can be used as the evaluation index of the optimal trajectory in these executable local states to make the evaluation of its optimal trajectory more comprehensive.
This work is structured into three main parts: creating an offline dataset, training the MPs generation network, and estimating the feasibility of MPs’ feature vectors and MPs generation.
-
1) Building of MP dataset. The original human-driving trajectory data are usually a continuous sequence of points in the global coordinate system, while the MP need to reflect the motion state of the vehicle in a period. Therefore, the original trajectory data need to be sliced and transformed to obtain a kinematic primitive representation of the trajectory data. However, due to sensor errors and GPS positioning occlusion problems, a small amount of erroneous data can be obtained. Also, in daily driving, the amount of data for turning and straight-line situations is unevenly distributed at different speeds, and these problems affect the training of the network. Therefore, the problems of abnormal data and uneven data distribution need to be dealt with when building the human-driving trajectory dataset. Deep learning networks possess strong feature extraction and parameter fitting capabilities. Autoencoders (AE) [Reference Bengio, Courville and Vincent38] can utilize the data itself as a supervisor to guide the neural network to learn the mapping relationship between data and features. Therefore autoencoder networks can be used for the detection of small amounts of anomalous data in large amounts of data. In addition, to ensure that the dataset covers most of the daily traffic scenarios, the low-dimensional data features extracted using the AE are used for classification as well as equalization and ultimately a high-quality motion primitive dataset is obtained.
-
2) MP generation network. Based on the above motion primitive dataset, this chapter proposes a VM-LSTM model based on the autonomous vehicle kinematics model. The model combines a traditional vehicle kinematic model with a LSTM network to improve the accuracy of the network in learning the driving trajectory of a human driver. The kinematic model of a vehicle can deterministically generate a trajectory to reach a localized target state. However, there is a deviation between the actual vehicle trajectory and the theoretically computed vehicle trajectory due to the driving habits of different drivers as well as the vehicle performance. Therefore, the main role of the LSTM network in this model is to learn this deviation to realize the output of kinematic primitives similar to human-driving trajectories.
-
3) MP generation. In practical applications, the MP generation network is not able to generate high-quality MP for sampling infeasible local target states. Therefore, it is necessary to filter the MP feature vectors consisting of the start state and the local target state when feeding them to the VM-LSTM. Meanwhile, after the MPs are generated, to further ensure the feasibility of the MPs, a feasibility boundary check corresponding to curvature and velocity is added to ensure the quality of the final generated MPs.
4. Methodology
4.1. Building a dataset of MPs from human-driving data
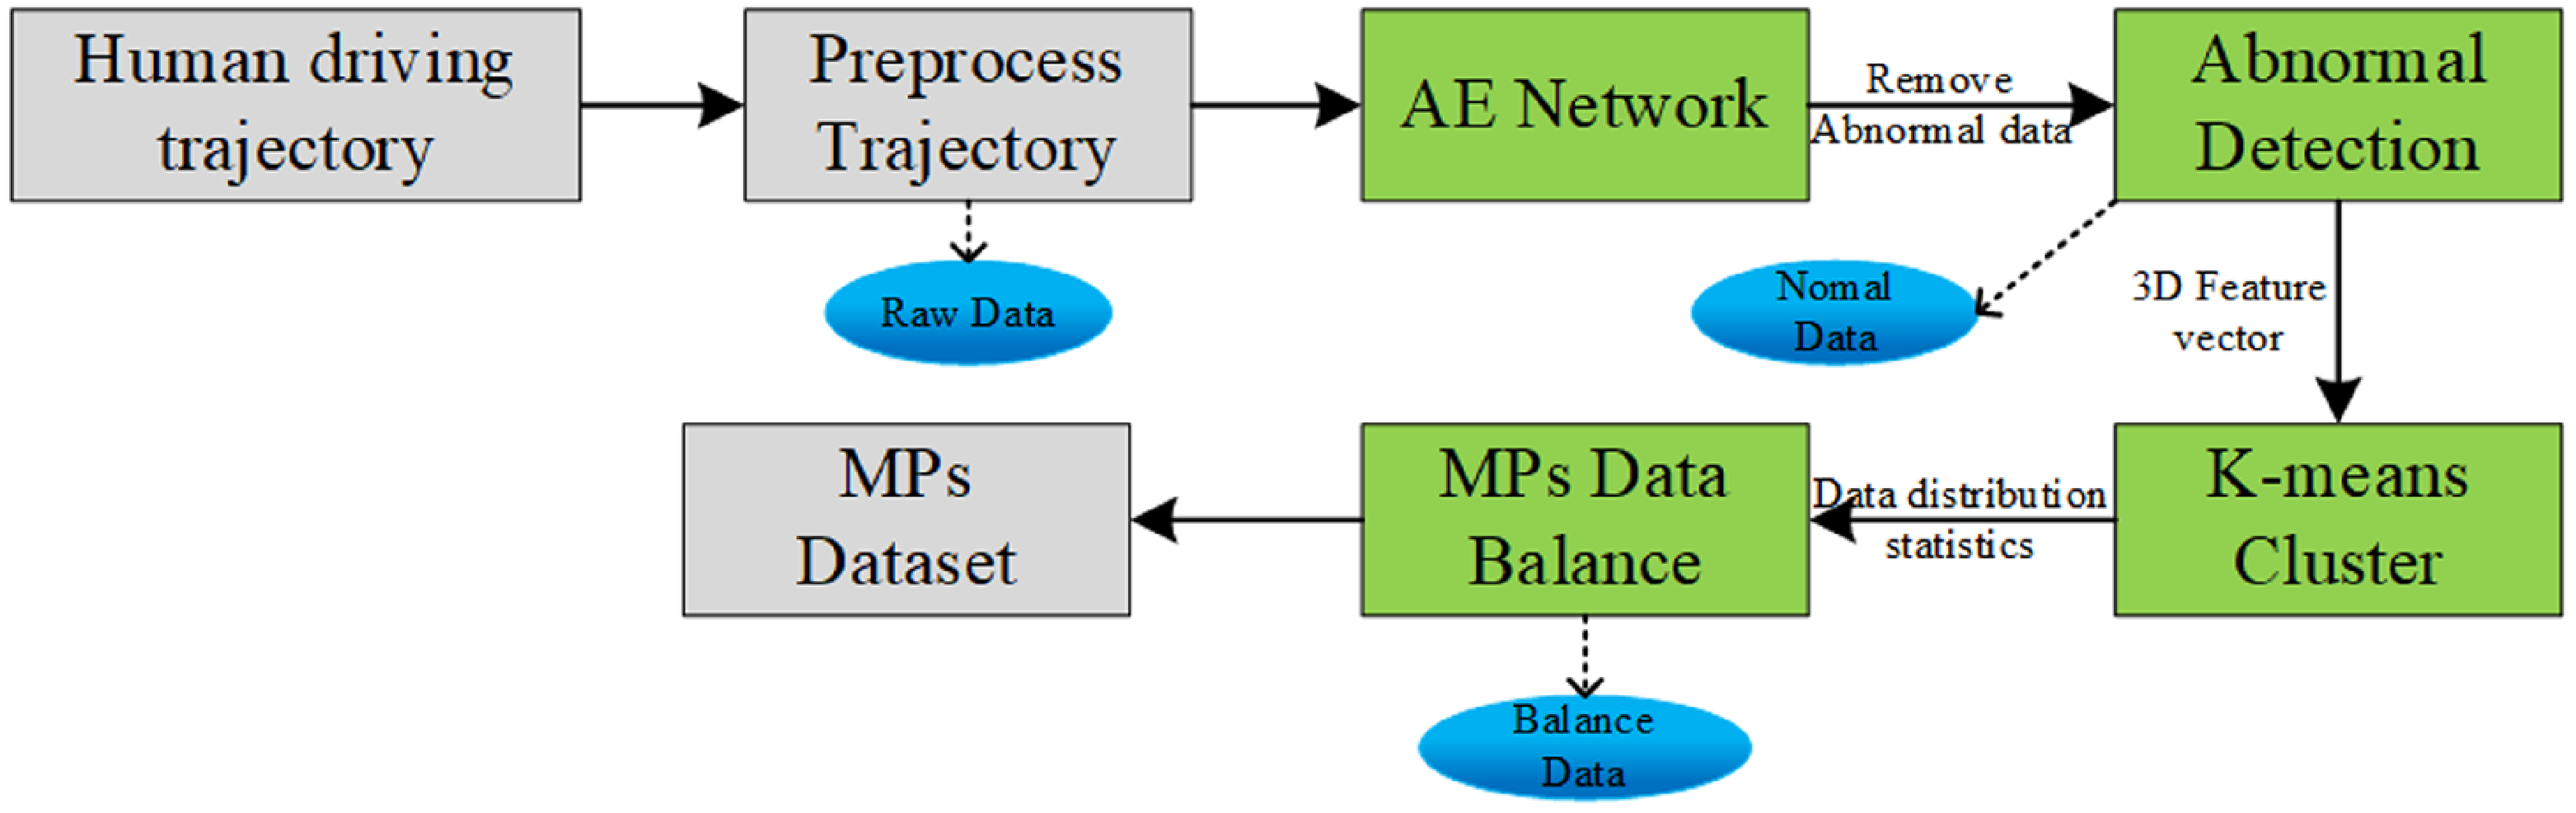
The dataset is the basis for the application of learning-based algorithms. Commonly used autonomous driving datasets, including Waymo Open [Reference Sun, Kretzschmar, Dotiwalla, Chouard, Patnaik, Tsui, Guo, Zhou, Chai, Caine, Vasudevan, Han, Ngiam, Zhao, Timofeev, Ettinger, Krivokon, Gao, Joshi, Zhang, Shlens, Chen and Anguelov39], nuScenes [Reference Caesar, Bankiti, Lang, Vora, Liong, Xu, Krishnan, Pan, Baldan and Beijbom40], and more, are typically employed for tasks such as detection, prediction, and planning. The task targeted in this paper is the learning of vehicle self-vehicle trajectories, so we created our dataset. The experimental data utilized in this paper is sourced from an autonomous vehicle experimental platform. This platform is equipped with an RTK-GPS high-precision localization system that offers cm-level data at a 50 Hz frequency. This subsection is dedicated to extracting and pre-processing MPs from the initial vehicle trajectory data, culminating in constructing the MP dataset. The pipeline from the raw data to the final dataset is shown in Figure 1. As described in Section 3, we use a sequence of trajectory points whose coordinates are transformed to the starting position as a single MP for the vehicle motion.
The pipeline of building the MPs dataset. The arrows indicate the data flow, and the green blocks indicate the algorithm model used. The blue eclipse indicates the data set.

4.1.1. Trajectory segmentation and pre-processing
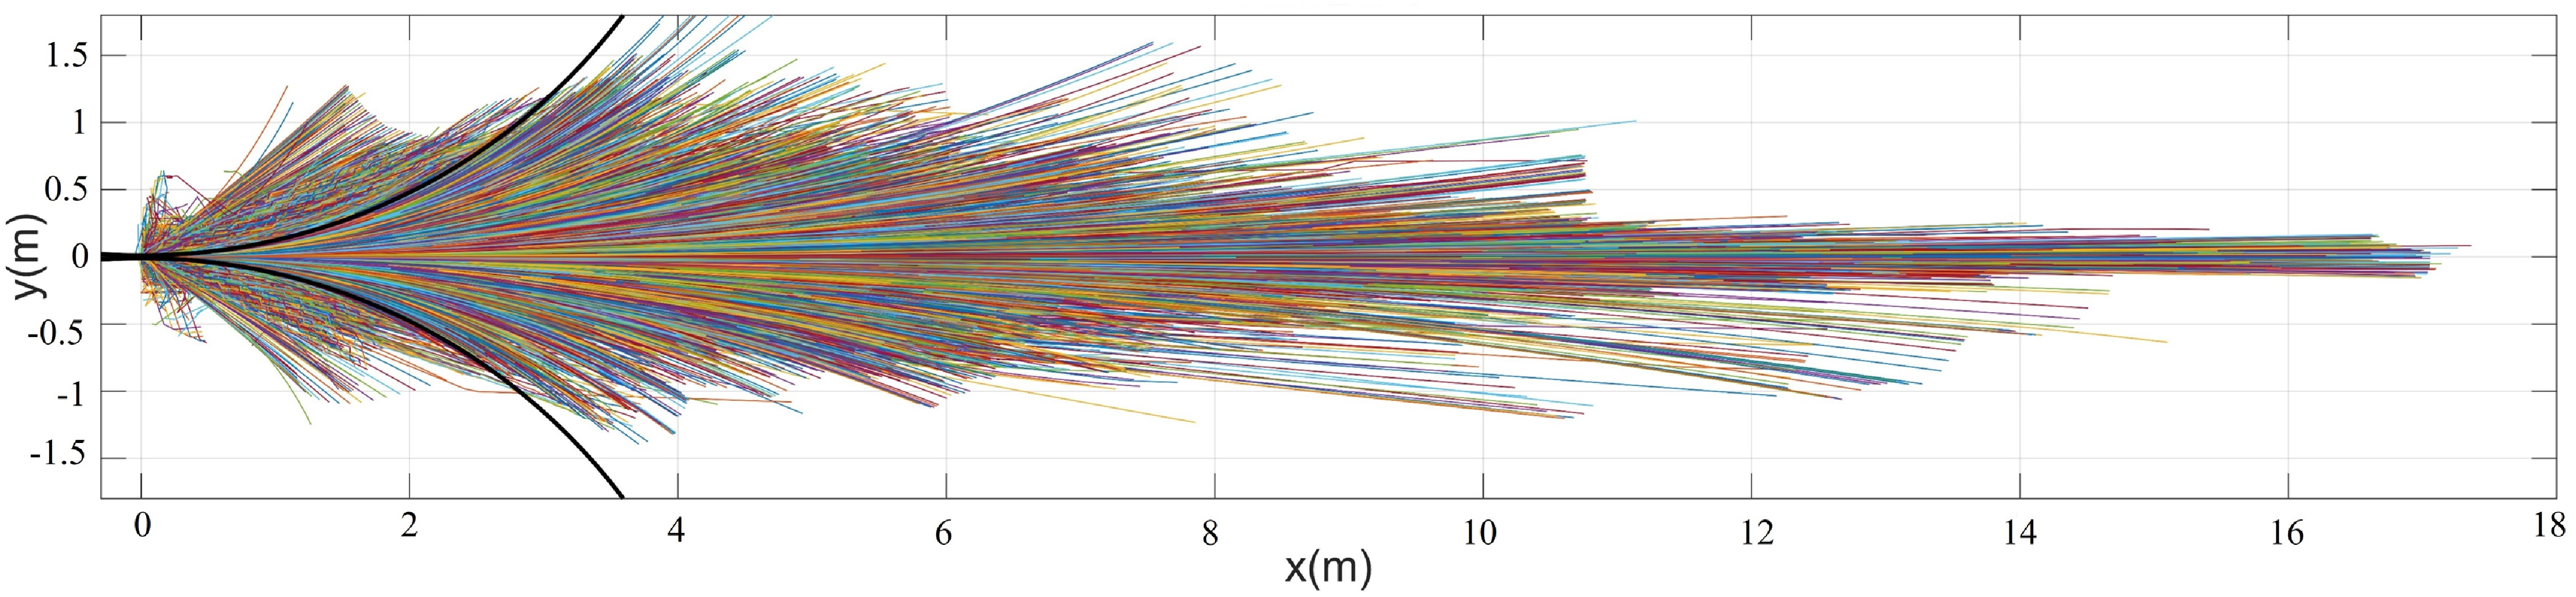
For the problem of segmentation of the original trajectory of the vehicle. Different methods exist due to the varying definitions of MPs. In this paper, we adopt a fixed time duration for the vehicle’s motion trajectory. In autonomous vehicle motion planning algorithms, the length of the trajectory or path planned in a single frame is contingent on the vehicle’s speed, with the planning result designed to provide the vehicle with a trajectory or path for the next 5–10 s. Therefore, we set the time duration of a single MP at 1 s. The time step is 0.02 s, and each trajectory comprises 51 state points. All trajectories will be transformed into a local coordinate system based on the initial coordinates. Figure 2 shows the part of raw MPs (20%) obtained by the original trajectory. After a straightforward segmentation and coordinate transformation process, the original trajectory data becomes evident. The data acquisition process inevitably encounters occlusion or poor GPS signals, so the raw data contains several unsmooth and positional jumps. The jumps in Figure 2 at low speeds are especially noticeable because the anomalous data is obscured by the normal data at higher speeds. These low-speed problematic trajectories can be eliminated using the constraint of the minimum turning radius of the vehicle directly. Some similar problems exist at higher speeds. And the method does not effectively address this.
Part of raw MPs extracted from trajectories. Each curve represents an individual MP acquired through the segmentation and coordinate transformation of extensive human-driving trajectory data. The black curve indicates the minimum turning radius of the vehicle.

4.1.2. Anomaly detection
This is for problematic trajectories that remain after the initial acquisition of the MP dataset. Manual verification frame by frame is too complicated due to the massive amount of data. Anomaly detection techniques try to find the low-dimensional embeddings of the original data where anomalies and normal data are expected to be separated from each other [Reference Sun, Kretzschmar, Dotiwalla, Chouard, Patnaik, Tsui, Guo, Zhou, Chai, Caine, Vasudevan, Han, Ngiam, Zhao, Timofeev, Ettinger, Krivokon, Gao, Joshi, Zhang, Shlens, Chen and Anguelov39]. Hence, the autoencoder (AE) network processes the raw MP data. The AE network serves two primary functions: eliminating anomalous data and extracting low-dimensional data features for classification.
An autoencoder, comprising encoder and decoder networks, is a neural network method used to learn features from unlabeled data. In our configuration, we normalize the original data. Precisely, the longitudinal y and orientation
 $\theta$
columns are scaled to the range of [−0.5, 0.5] based on their characteristics, while the rest are normalized to the content of [0, 1]. The encoder network takes N as the input vector for the normalized vehicle state sequence X and maps it to a latent representation through multiple hidden layers. Subsequently, the feature representation is reconstructed into a joint vector Z using decoder networks with the same structure. The loss function of the AE network uses the mean squared error (MSE), which is calculated by
 $L(X,Z)=\| X-Z\| ^{2}$
.
This method’s fundamental assumption is that all normal data adhere to a specific distribution, AE can accurately fit and reconstruct all normal data, that all normal data follow a specific pattern, and that the autoencoder network can accurately fit and reconstruct the normal data, while the anomalous data are reconstructed with a large reconstruction error. The specific use of the AE network for abnormal data detection requires repeated training several times, both initial training on all data, given a large threshold to filter out data with large reconstruction errors, followed by training the AE network again using the cleaned data and reducing the threshold to remove data with large reconstruction errors. This cycle of training the AE network and cleaning the anomalous data was performed three times in this chapter, and eventually, all the data were able to fit and reconstruct the MP through the AE network with small errors.
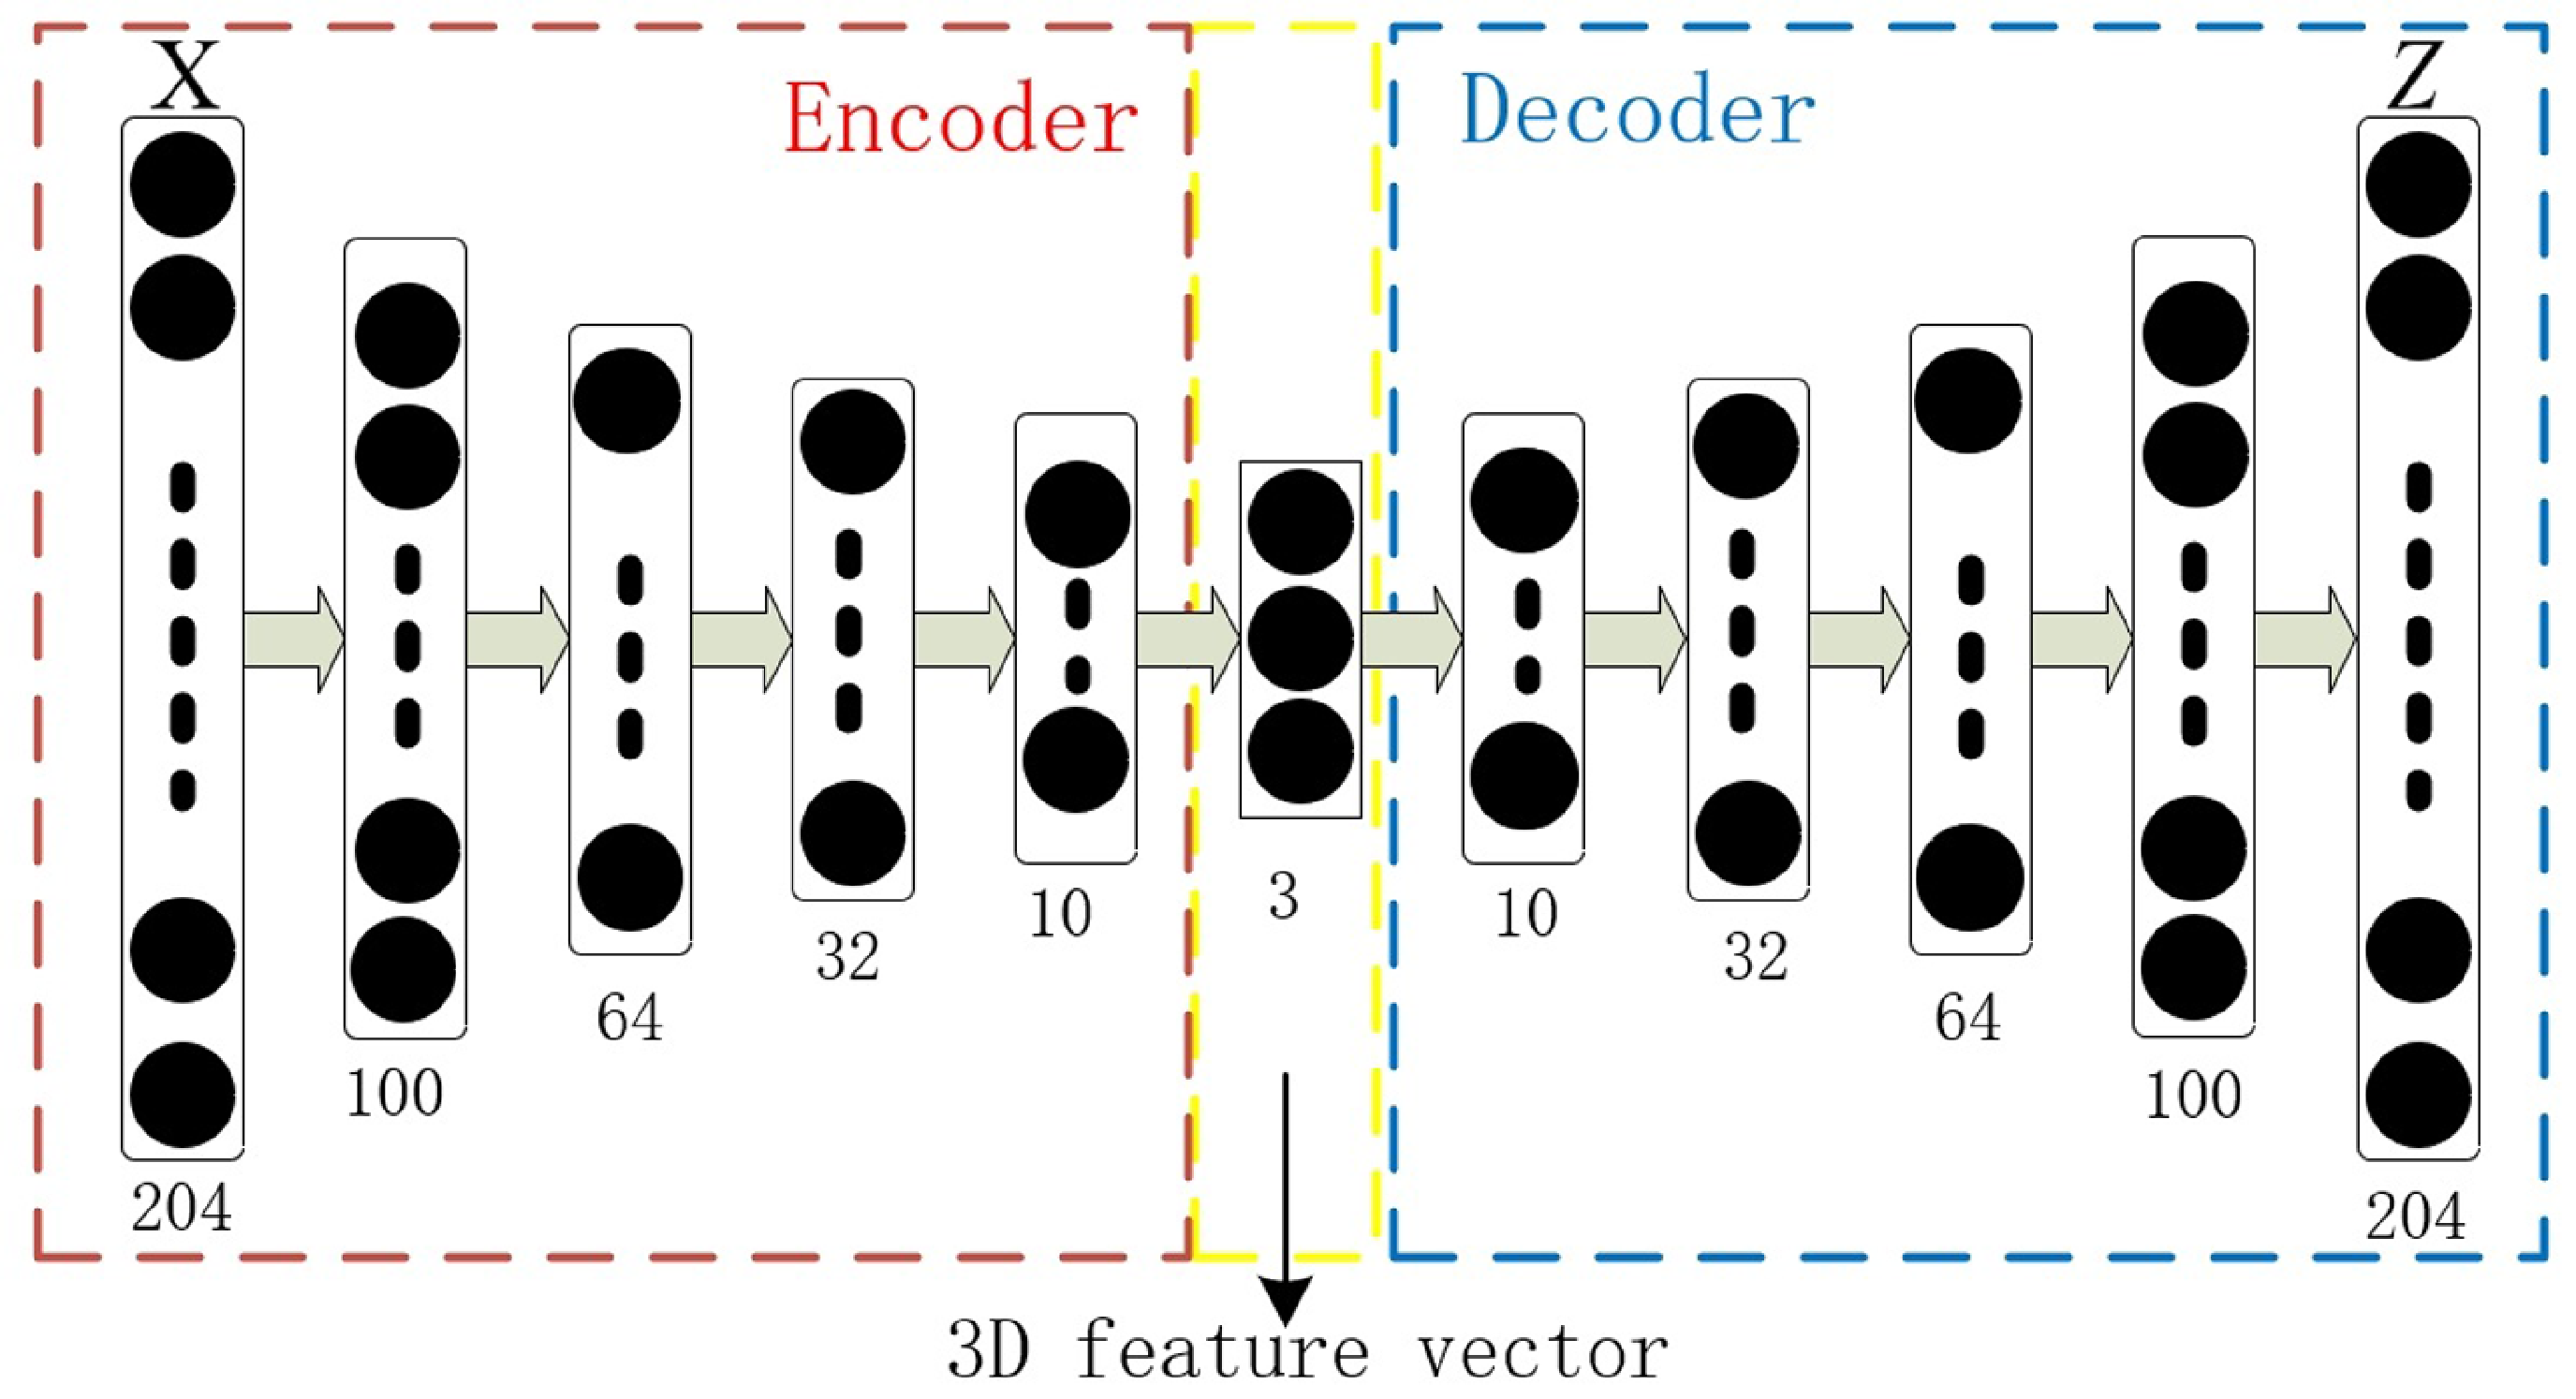
The structure of the AE network we designed is shown in Figure 3. As mentioned in the previous section, each MP comprises 51 states, and each state encompasses four parameters. Thus, the input to the AE network is of dimensions
 $51\times 4$
. The encoding and decoding processes employ a 5-layer network, ultimately resulting in a 3D feature vector description. The number of neurons in each layer is selected to minimize the reconstruction error for AE. The input dimension of each layer of the network is roughly half of that of the upper layer, and ultimately, to enhance the visualization of the experimental results as well as to simplify the next step of the clustering analysis of the low-dimensional features, the extracted low-dimensional feature values are represented in a three-dimensional manner.
The structure of autoencoder network. The red square on the left is the encoding network, the blue square on the right is the decoding network, and the middle is the low-dimensional feature output.

4.1.3. Data balance
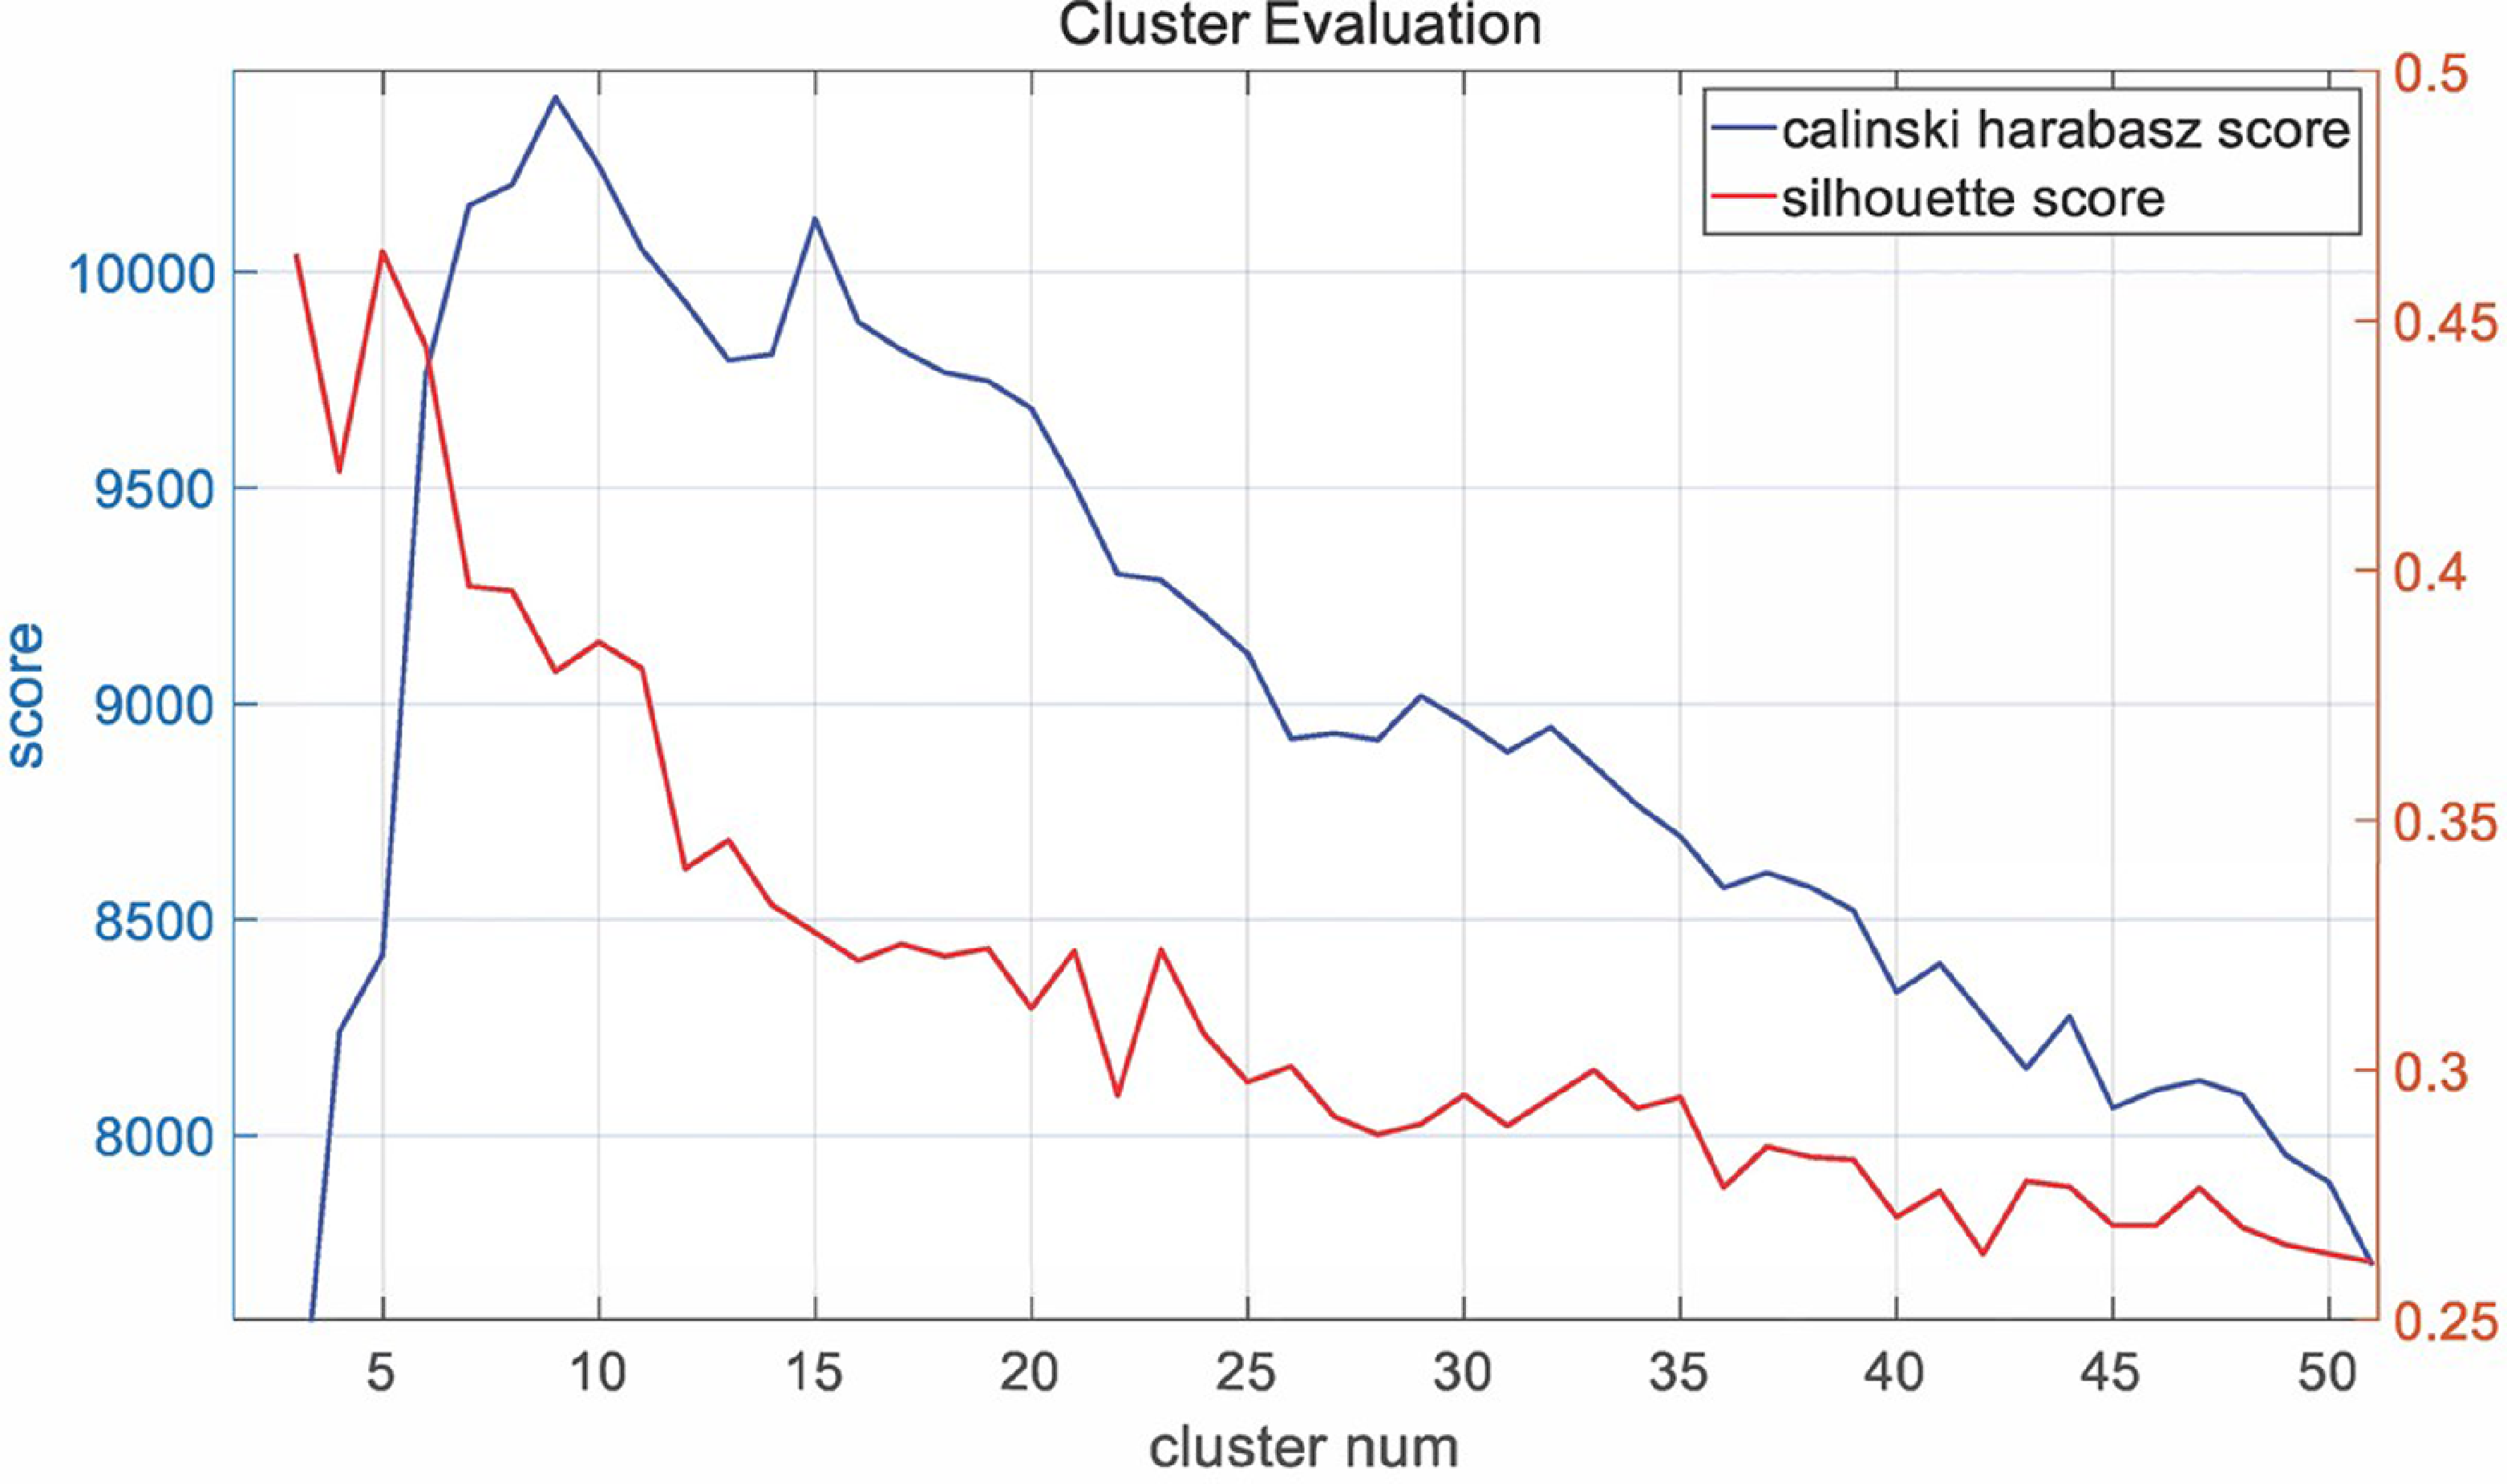
The majority of daily vehicle driving trajectories consist of straight lines at varying speeds or curves with slight turns. Consequently, the original dataset contains a relatively large number of such MPs. Disparities in data quantities for different behaviors can impact the effectiveness of network training. To make the data in the dataset evenly cover the majority of daily traffic scenarios. We utilized a clustering algorithm to categorize all MPs and iteratively added categories with fewer data points. In the previous section, we extracted the three-dimensional feature vectors of the MPs. Using clustering methods in three-dimensional space is more intuitive. We utilize the Silhouette and Calinski–Harabasz scores to determine the number of categories for the final clustering. As depicted in Figure 4, both evaluation indicators show favorable results when the category is 6. Therefore, we set the clusters with a k value of 6. Clustering can automatically categorize daily driving behavior. Using the clustering results, we adjust the data quantities in each category to create a dataset that comprehensively represents daily driving behavior.
MPs low-dimensional feature clustering, the red line is silhouette score, and the blue line is the Calinski-harabasz score.

4.2. VM-LSTM MP generation network
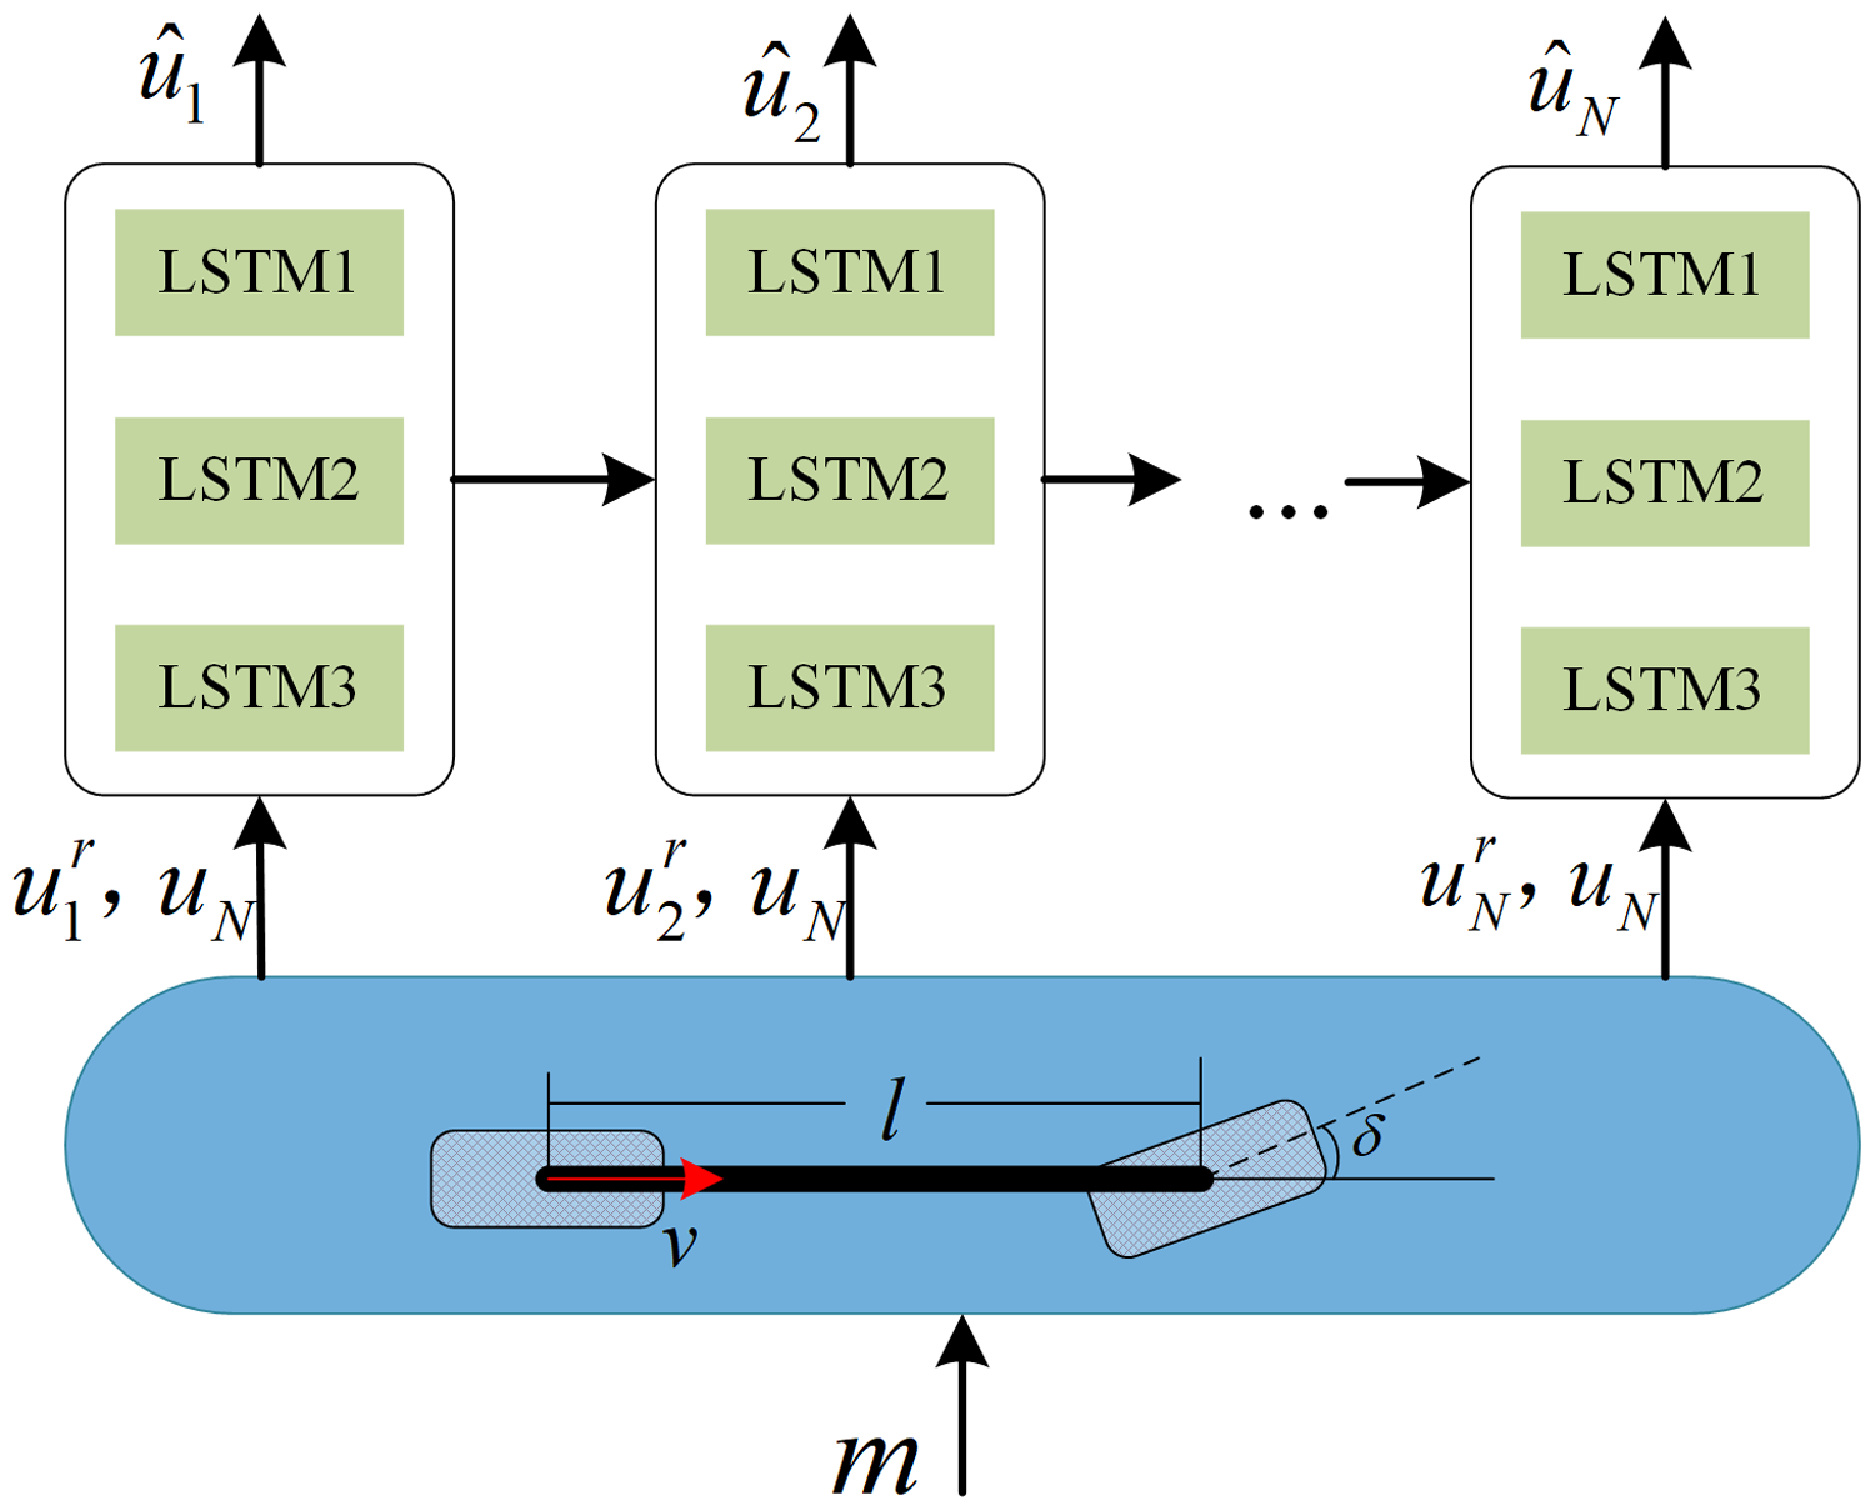
Considering the application of autonomous vehicles, it is essential to consider the kinematic constraints of the vehicle. The kinematic model of vehicles is a simple and reliable kinematic model for autonomous vehicles. The fundamental concept behind constructing a network of MPs is to utilize a vehicle’s bicycle model for pre-generating a sequence of reference trajectories to reach the target location. In order to tackle the issue of generating goal-directed MP sequences, we propose a solution that involves incorporating a goal location as an auxiliary input at each prediction step based on human-driving data and in conjunction with the reference trajectory. This approach serves to remind the network where it should ultimately converge. At each step, the input vector is augmented by concatenating it with the desired goal location, and this augmented input vector is utilized to train a long-short term memory (LSTM) model. The network consists of stacked LSTM layers that retain information over a range of outputs [Reference An and Cho41], where the output layer is fully connected to the final LSTM hidden layer. Figure 5 illustrates the VM-LSTM model proposed in this paper. We use each MP’s initial and goal states as the feature vector m for VM-LSTM, as shown in Sec 3.1. The network is trained using the Mean Squared Error between the predicted output and the human-driving data. Sec 5 provides exact numbers for the network size and depth.
The VM-LSTM MP generation network. Input the MP feature vector m, use the vehicle kinematics model to calculate the theoretical trajectory sequence
 $u_{1}^{r},u_{2}^{r},\ldots u_{N}^{r}$
, and combine it with the target state
 $u_{N}$
to input into the LSTM network, and finally generate the target sequence
 $\hat{u}_{1},\hat{u}_{2},\ldots \hat{u}_{N}$
.

The VM-LSTM is divided into two main parts. The input is the initial velocity and the target state in the first part, and it can be represented as m. Given the feature vector
 $m=[v_{0}, x_{g},y_{g},\theta _{g},v_{g}]$
of a MP, considering velocity control and position control separately, according to the simplified pure-pursuit tracking algorithm, the control input is computed by the Eq.(3), where r is the vehicle’s turning radius, l is the wheelbase of the vehicle,
 $\delta$
is the front wheel angle, and a is the acceleration.
 \begin{align} r & = \frac{\sqrt{x_{g}^{2}+y_{g}^{2}}}{2\cdot sin\!\left(\frac{\theta _{g}}{2}\right)} \nonumber\\[3pt] \delta & = arctan\left(\frac{l}{r}\right) \\[3pt] a &= \frac{v_{g}-v_{0}}{T} \nonumber \end{align}
The kinematic model of the vehicle enables the calculation of a reference trajectory. The formula is shown in Eq.(4), where
 $(x,y,\theta, v)$
is the vehicle’s state, t is the time step. The formula generates a series of discrete reference trajectory points by the control inputs
 $(\delta, a)$
.
 \begin{align}x_{i+1} & = x_{i}+v_{i}\cdot cos(\theta _{i})\cdot t \nonumber\\[3pt] y_{i+1} & = y_{i}+v_{i}\cdot sin(\theta _{i})\cdot t \\[3pt] \theta _{i+1} & = \theta _{i}+\frac{v_{i}}{l}\cdot tan(\delta )\cdot t \nonumber\\[3pt] v_{i+1} & = v_{i}+a\cdot t \nonumber \end{align}
In the second part, we employ an LSTM network to model and reduce the deviation between the vehicle model’s output and the actual vehicle trajectory. Vehicle MPs consist of point sequences with strong correlations, making the LSTM network highly effective. After generating the reference trajectory points using the vehicle kinematic model, we append the target state to each trajectory point, creating an eight-dimensional point sequence that serves as input to the LSTM network. The LSTM shares hidden layer weights across timesteps, allowing for iterative updates and concatenation of inputs. As depicted in Figure 5, the LSTM receives vehicle model-generated trajectories as input and produces four-dimensional state sequences as output.
4.3. Evaluation of the sample state for MPs
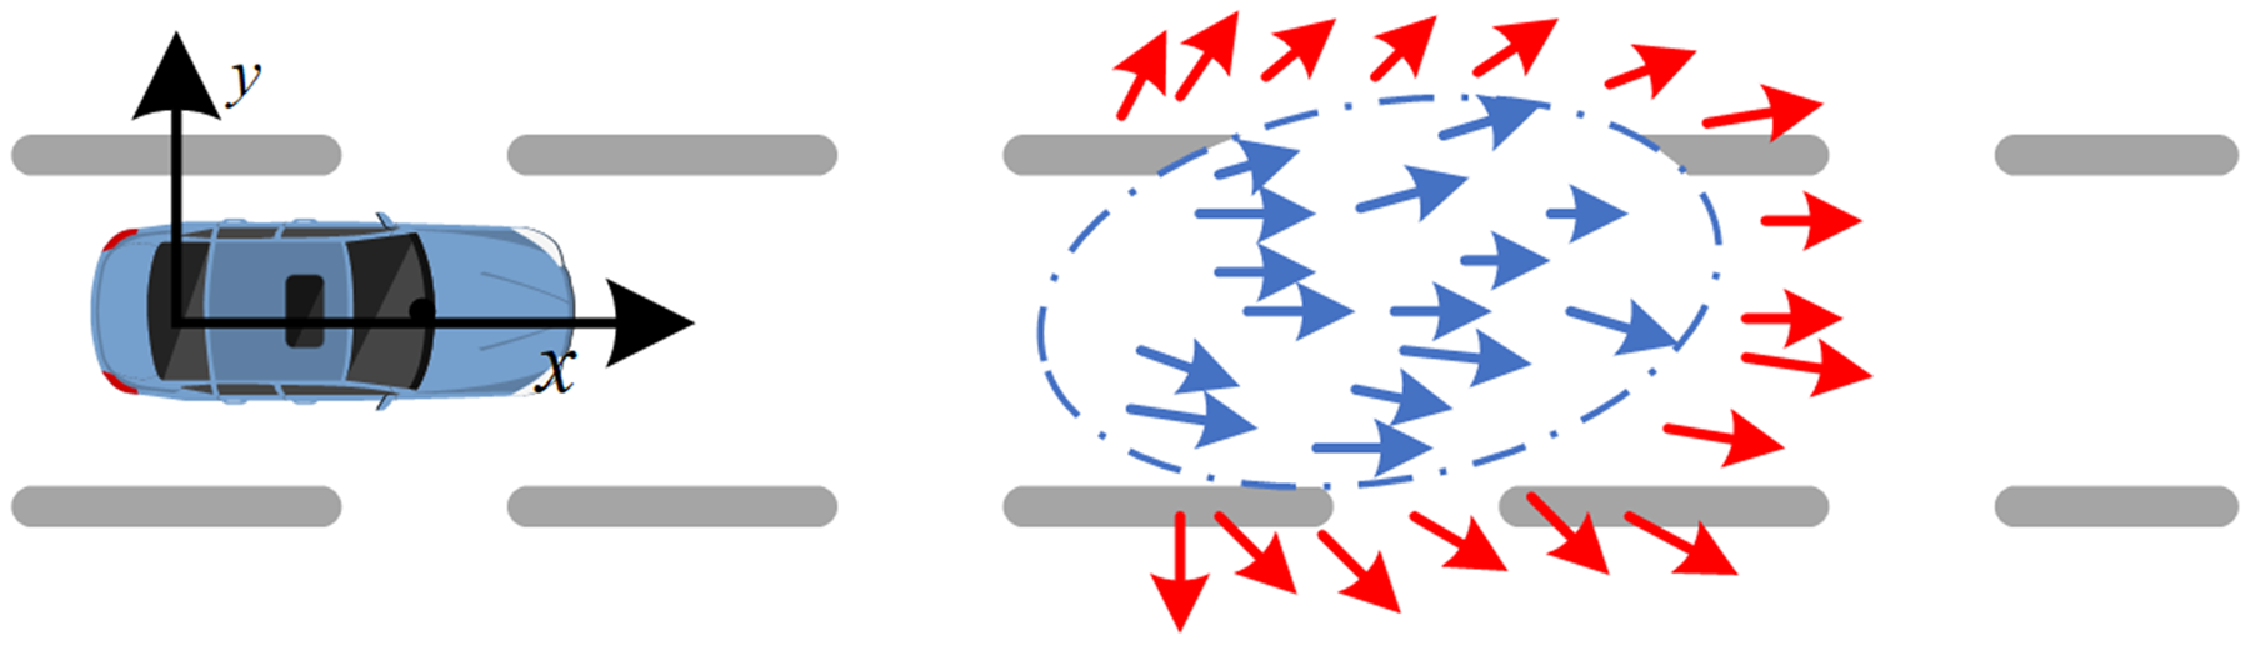
As shown in Figure 6, in most motion planning algorithms, the process involves sampling multiple locally feasible target states within the drivable zone and generating local vehicle motion trajectories based on the vehicle’s kinematic and obstacle constraints. However, evaluating the quality of trajectories generated from these localized states is a crucial concern. To ensure the MP generation network’s output quality, it is essential to select local states that meet various driving constraints. Therefore, in this paper, a GMM model is chosen to measure the degree of similarity between a given local target state and actual human-driving data. The GMM model offers advantages such as fewer parameters, fast computation, and the ability to provide probabilistic descriptions. The feature vector m, as defined in Sec 3.1, is used as training data for the GMM.
GMM estimation of transition probabilities. The small blue arrows within the ellipse indicate the distribution of target states with high probability. The red arrows indicate the target states with low probability.

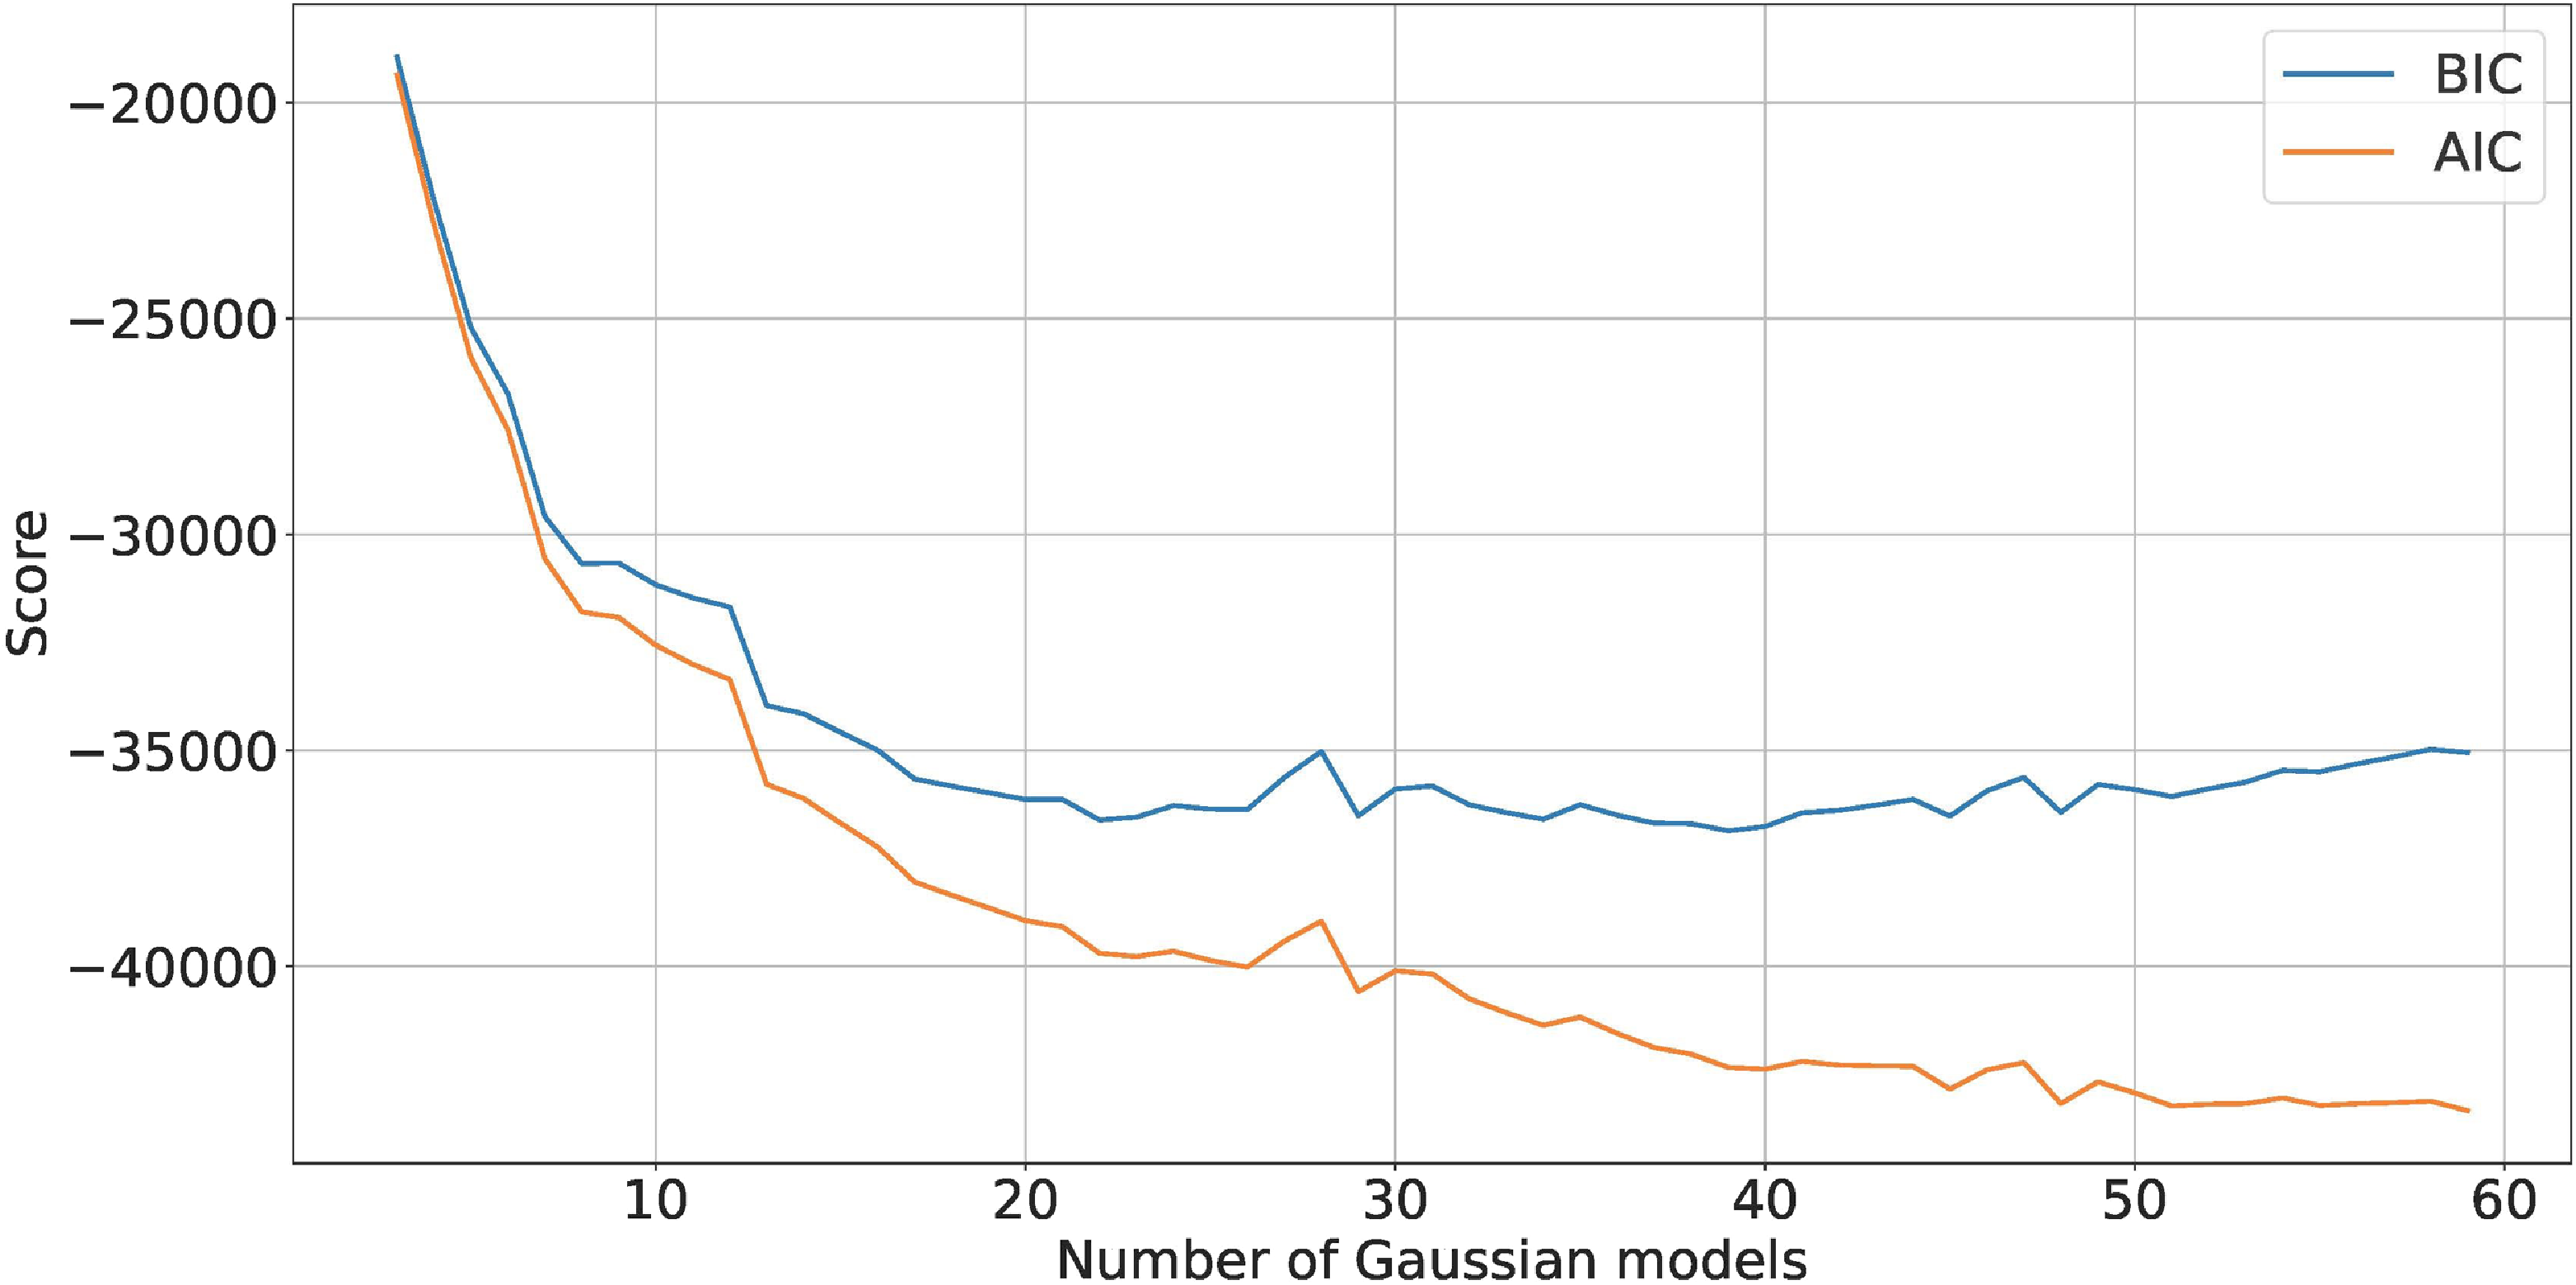
An essential parameter of the GMM is the number of its Gaussian models. A common method for determining this parameter involves using the Akaike information criterion (AIC) and Bayesian information criterion (BIC) to assess the model’s fit to the feature vector. Lower scores indicate better model fit. As demonstrated in Figure 7, the best fit to the data was achieved when there were 25 Gaussian models. In order to effectively estimate the feasibility of the sampling state and ensure the smoothness of the vehicle motion state, we fit the above feature vectors m using a GMM. The distribution of the GMM can be described by the following Eq.(5), where k is the number of Gaussian kernels,
 $\alpha _{k}$
is the weighting coefficient, D is the dimension of data, and
 $\alpha _{k}\geq 0, \sum _{k=1}^{K}\alpha _{k}=1$
,
 $\phi (m|z_{k})$
is kth Gaussian distribution density function.
BIC and AIC score for GMM.

 \begin{align}p(m|z) & = \sum\nolimits_{k=1}^{K}\alpha _{k}\phi (m|z_{k})\\[3pt] \phi (m|z_{k}) & = \frac{1}{(2\pi )^{\frac{D}{2}}\left| \sum\nolimits_{k}\right| ^{\frac{1}{2}}}exp\left[-\frac{1}{2}(m-{\mu _{k}})^{T}\sum\nolimits_{k}^{-1}(m-\mu _{k})\right]\nonumber\end{align}
The mean and covariance can be calculated by the following Eq.(6), where
 $\mu$
is
 $1\times D$
and
 $\sum$
is
 $D\times D$
. The parameters are solved using the EM algorithm.
 \begin{align}\mu =\left[\begin{array}{c} \mu _{{v_{0}}}\\ \mu _{{x_{g}}}\\ \begin{array}{c} \mu _{{y_{g}}}\\ \mu _{{\theta _{g}}}\\ \mu _{{v_{g}}} \end{array} \end{array}\right]\sum =\left[\begin{array}{c@{\quad}c@{\quad}c} cov(v_{0}, v_{0}) & \cdots & cov(v_{0}, v_{g})\\[3pt] \vdots & \ddots & \vdots \\[3pt] cov(v_{g}, v_{0}) & \cdots & cov(v_{g}, v_{g}) \end{array}\right]\end{align}
Using the above feature vectors, the GMM parameter matrix can be trained. Given an MP feature vector m, the similarity between the MPs and the human-driving data is calculated by the weighted log probability value
 $\ln p(m)$
, which is calculated as follows equations.
 $p(m|z_{k})$
is the conditional probability value of the m belonging to the kth Gaussian function.
 $p(m,z_{k})$
is the joint probability, and
 $p(m)$
is the probability value of sample m.
 \begin{align}\ln p(m|z_{k}) & = -\frac{D}{2}\ln det\left(\sum\nolimits_{k}\right)-\frac{1}{2}(m-{\mu _{k}})^{T}\sum\nolimits_{k}^{-1}(m-\mu _{k})\nonumber\\[4pt] \ln p(m,z_{k}) & = \ln p(m|z_{k})+\ln p(z_{k})\\[4pt] \ln p(m) & = \ln \sum\nolimits_{k=1}^{K}p(m,z_{k}) \nonumber \end{align}
Finally, the above equation calculates a measurement of the MP feature vector composed of the selected local target states concerning the motion state of the human-driving data. We can use the above model to select the appropriate target states to generate MPs in the motion planning algorithm. The model can also be used to evaluate the quality of the final trajectory.
4.4. Generation of MPs
The above sections describe dataset building, VM-LSTM neural network training, and GMM evaluation model training for individual MP feature vectors. As shown in Figure 8, for the generation of MPs to reach these goal states multiple local goal states are in the trajectory planning algorithm. For the VM-LSTM MP generation network, if the given local target state is unreachable or does not meet the vehicle motion constraint, it will affect the quality of the generated MPs. The feature vectors of all MPs are evaluated using the GMM model. If the probability value is greater than the threshold value, the MP will be generated in the next step of VM-LSTM, and if it is less than the threshold value, the local target state will be retrieved. Indeed, MP generation results may still appear to be unexecuted by the vehicle. Therefore, we add a feasibility check module after the network output to screen the output MP further.
The pipeline of feasibility estimation and generation of the MPs. The arrows indicate the data flow.

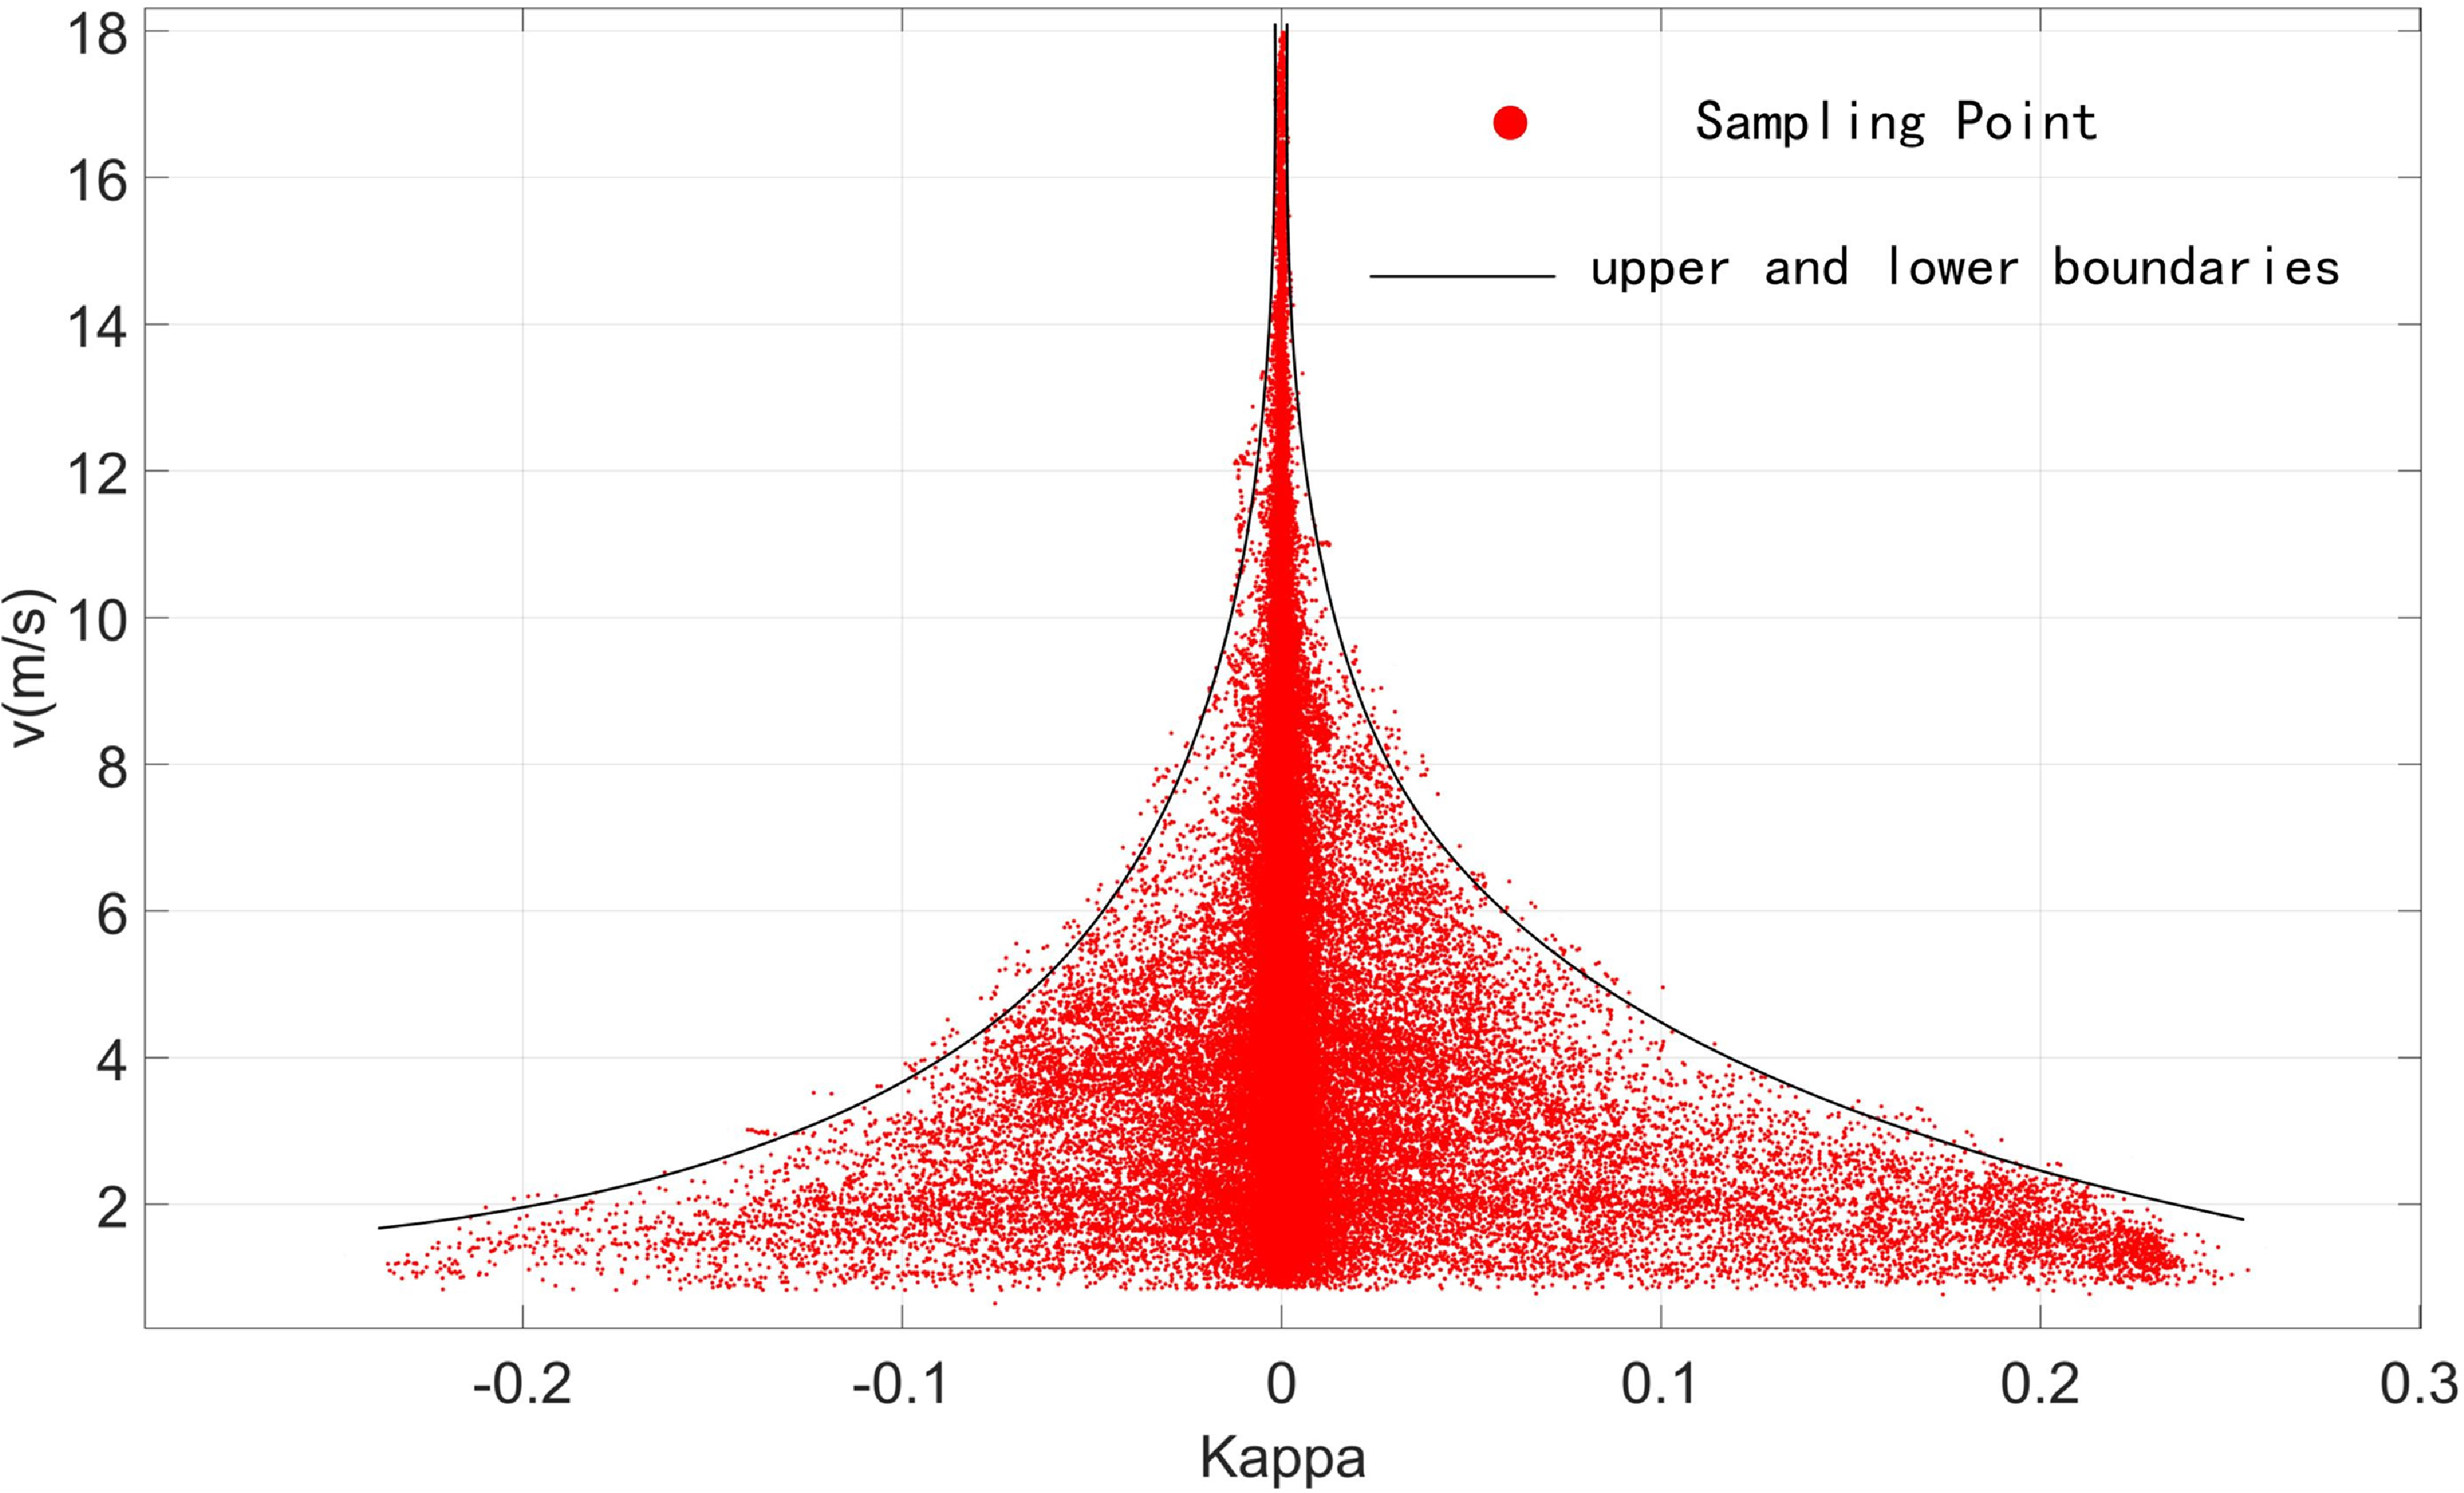
For the vehicle itself, whether a trajectory can be effectively executed mainly from the acceleration and turning radius. In particular, the turning radius is related to the vehicle’s speed; for example, at higher speeds, a significant steering wheel turn may lead to vehicle rollover. As shown in Figure 9, we extracted data pairs of vehicle trajectory and vehicle speed information from the driving dataset. The black line indicates its curvature boundary for a given velocity. After the VM-LSTM network generates the MP, infeasible MPs are screened out using the boundary mentioned above constraints and the vehicle’s acceleration constraints.
Upper and lower bounds on the relationship between vehicle speed and its maximum allowable path curvature.

5. Experiment
5.1. Setting
This section presents the results of the methodology described in the previous sections on real data. The main content will be divided into four parts. The first section briefly describes the data sources and the configuration of the equipment used for data processing. The second part is the establishment of the MPs dataset, which aims to effectively detect abnormal data and cover most scenarios of daily driving behavior. The third part focuses on training a VM-LSTM MP generation network capable of generating human-like MP given a local target state. At the same time, the algorithm is compared with the traditional vehicle kinematics model and the g2 curve. The last part presents the use of GMM models to estimate the quality of a single MP feature vector.
We collected about 70 hours of vehicle trajectory data in urban scenarios. Approximately 2,248,580 frames of raw data were extracted from these raw trajectories using the method in Sec 3.1. The maximum speed in these data is up to 16 m/s. Computer configuration for network training and MP generation is intel (R) Core(TM) i7-8700 CPU, 16G ARM, Nvidia GeForce GTX 1050 Ti. This set was split according to the 6 rule, with 20% kept for testing to control overfitting. The network architecture consists of 3 LSTM layers, each of 64 hidden units.
5.2. Building the dataset of MPs
The experiments in this section include two parts. The first part uses an AE network to remove anomalous data from the original data. The second part uses K-means to classify the extracted three-dimensional feature vectors, balancing the amount of data under different categories.
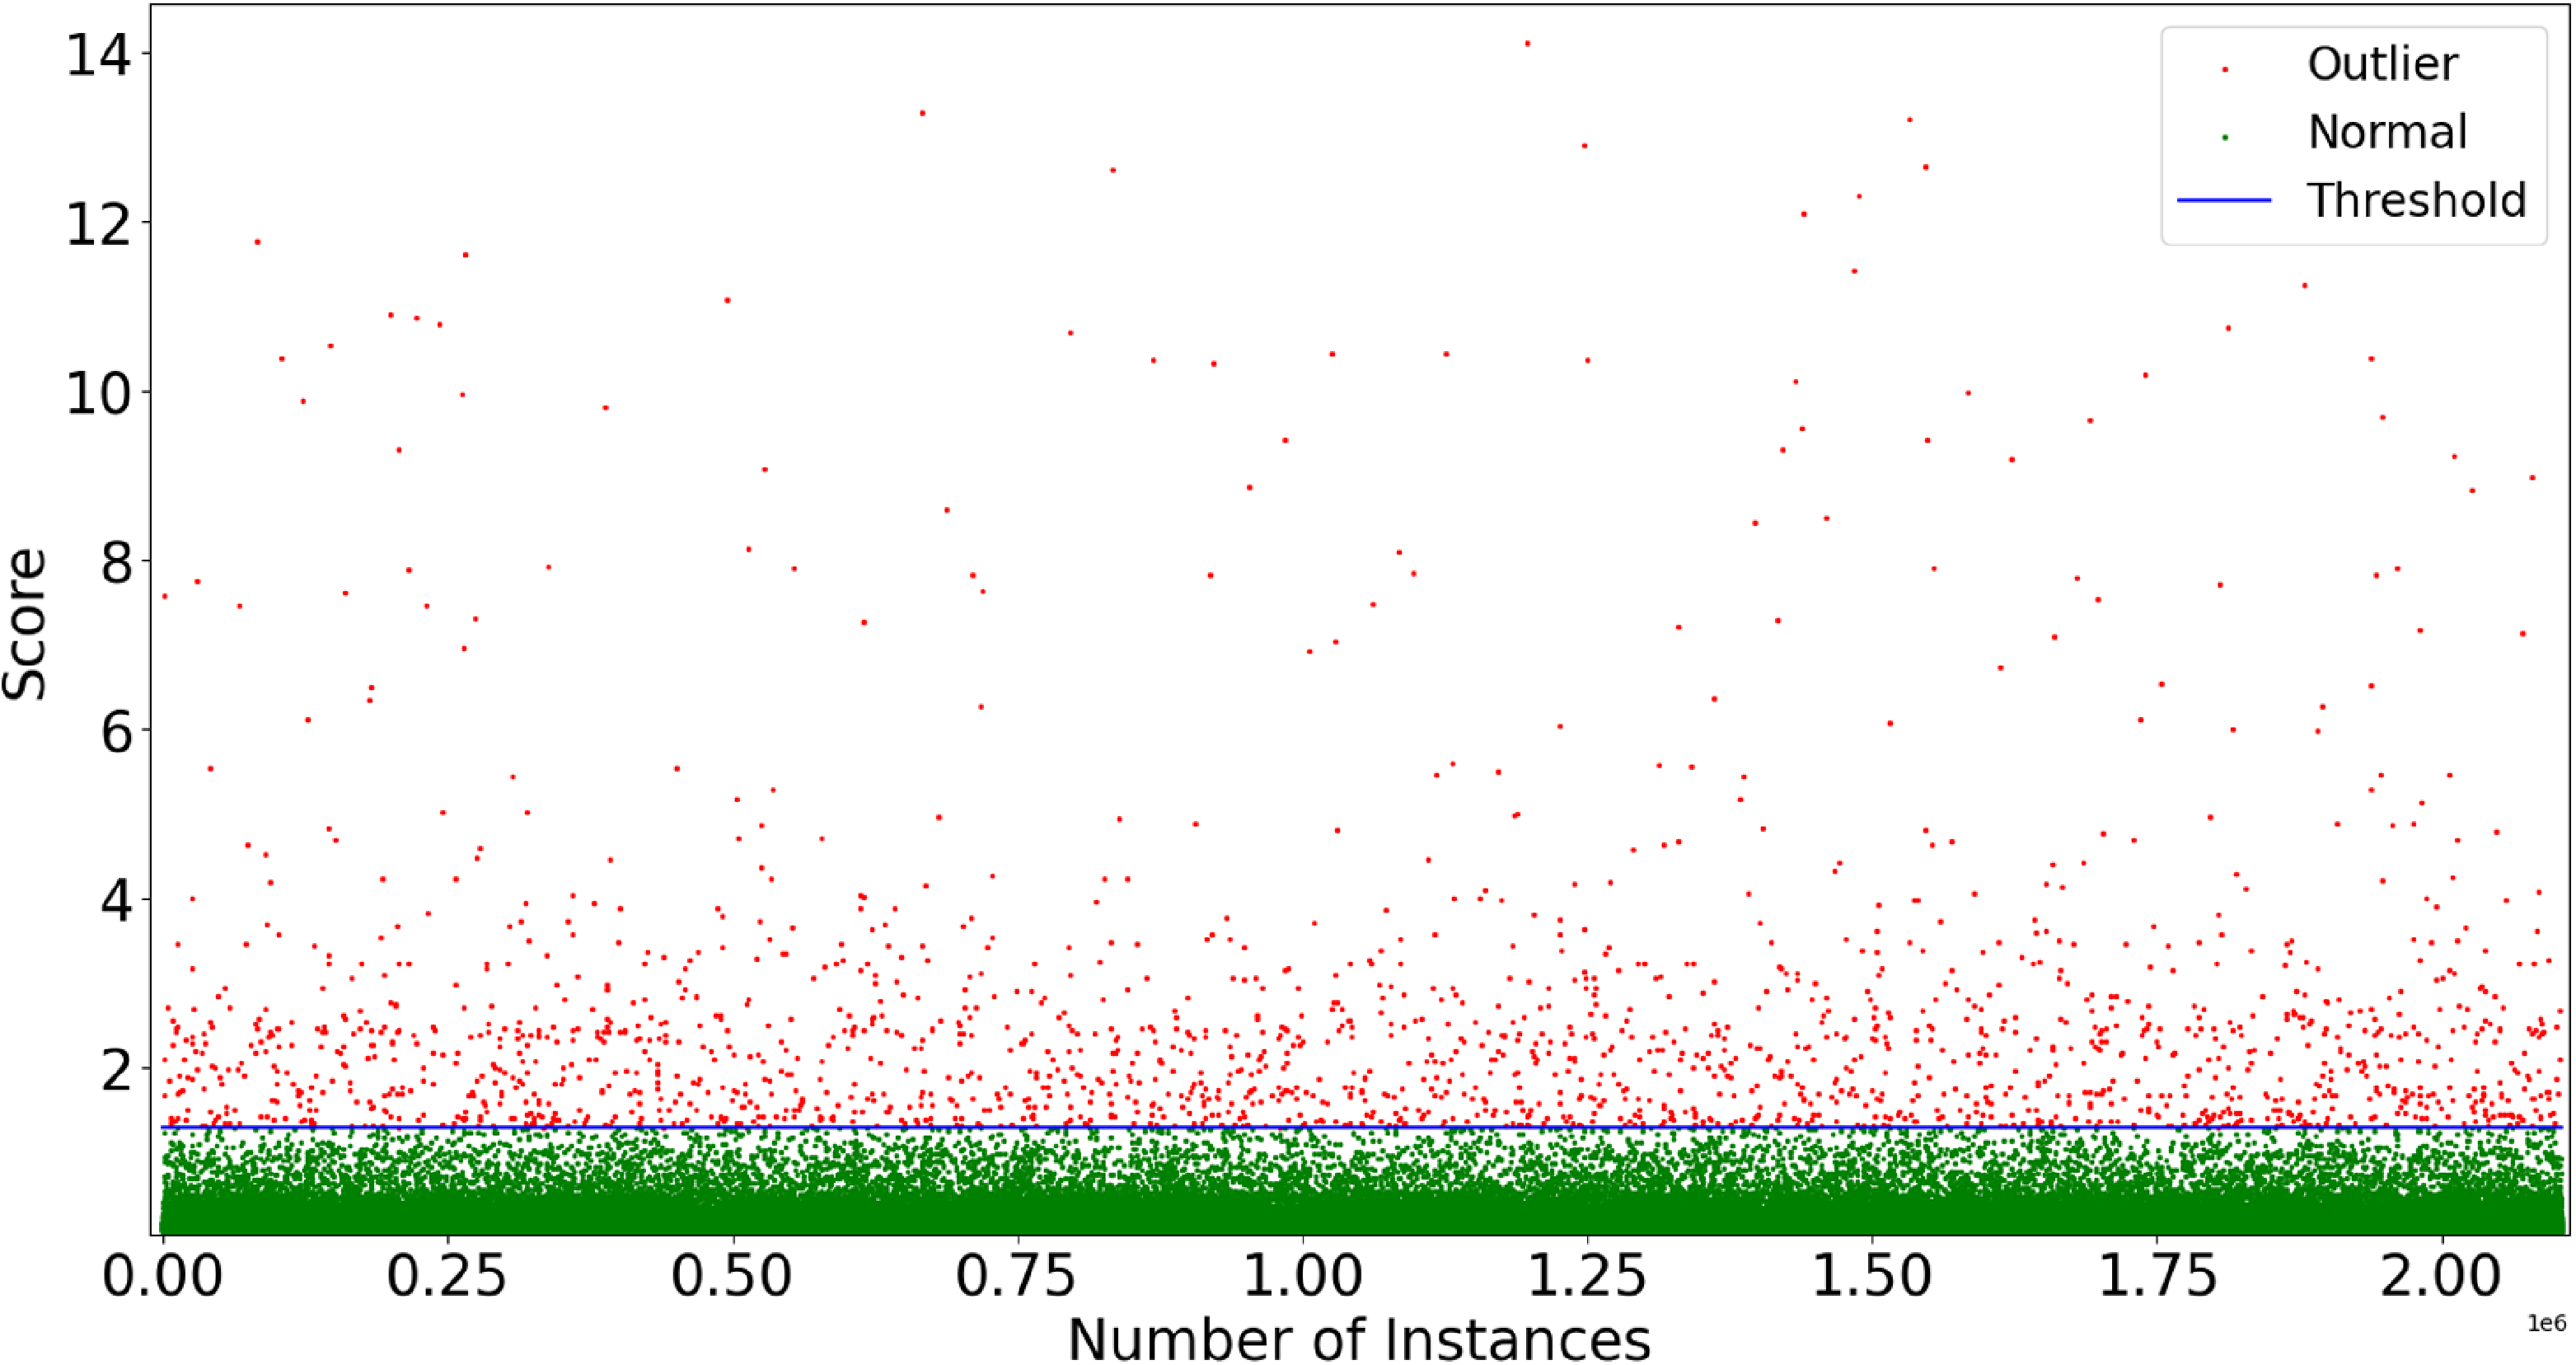
We encoded and reconstructed the original MP data using an AE network. As show in Figure 10, the fitting error of abnormal data will be higher than that of normal data after extracting and reconstructing.
The detection of abnormal data. Each point in the graph represents the deviation value of the MP before and after the AE network processing. Green dots are normal data, and red dots are abnormal data.

The data is through AE network, so we can choose an appropriate threshold to reject the abnormal data. Figure 10 shows the abnormal detection result. After anomaly detection, the dataset retained 2,103,037 frames of normal driving data.
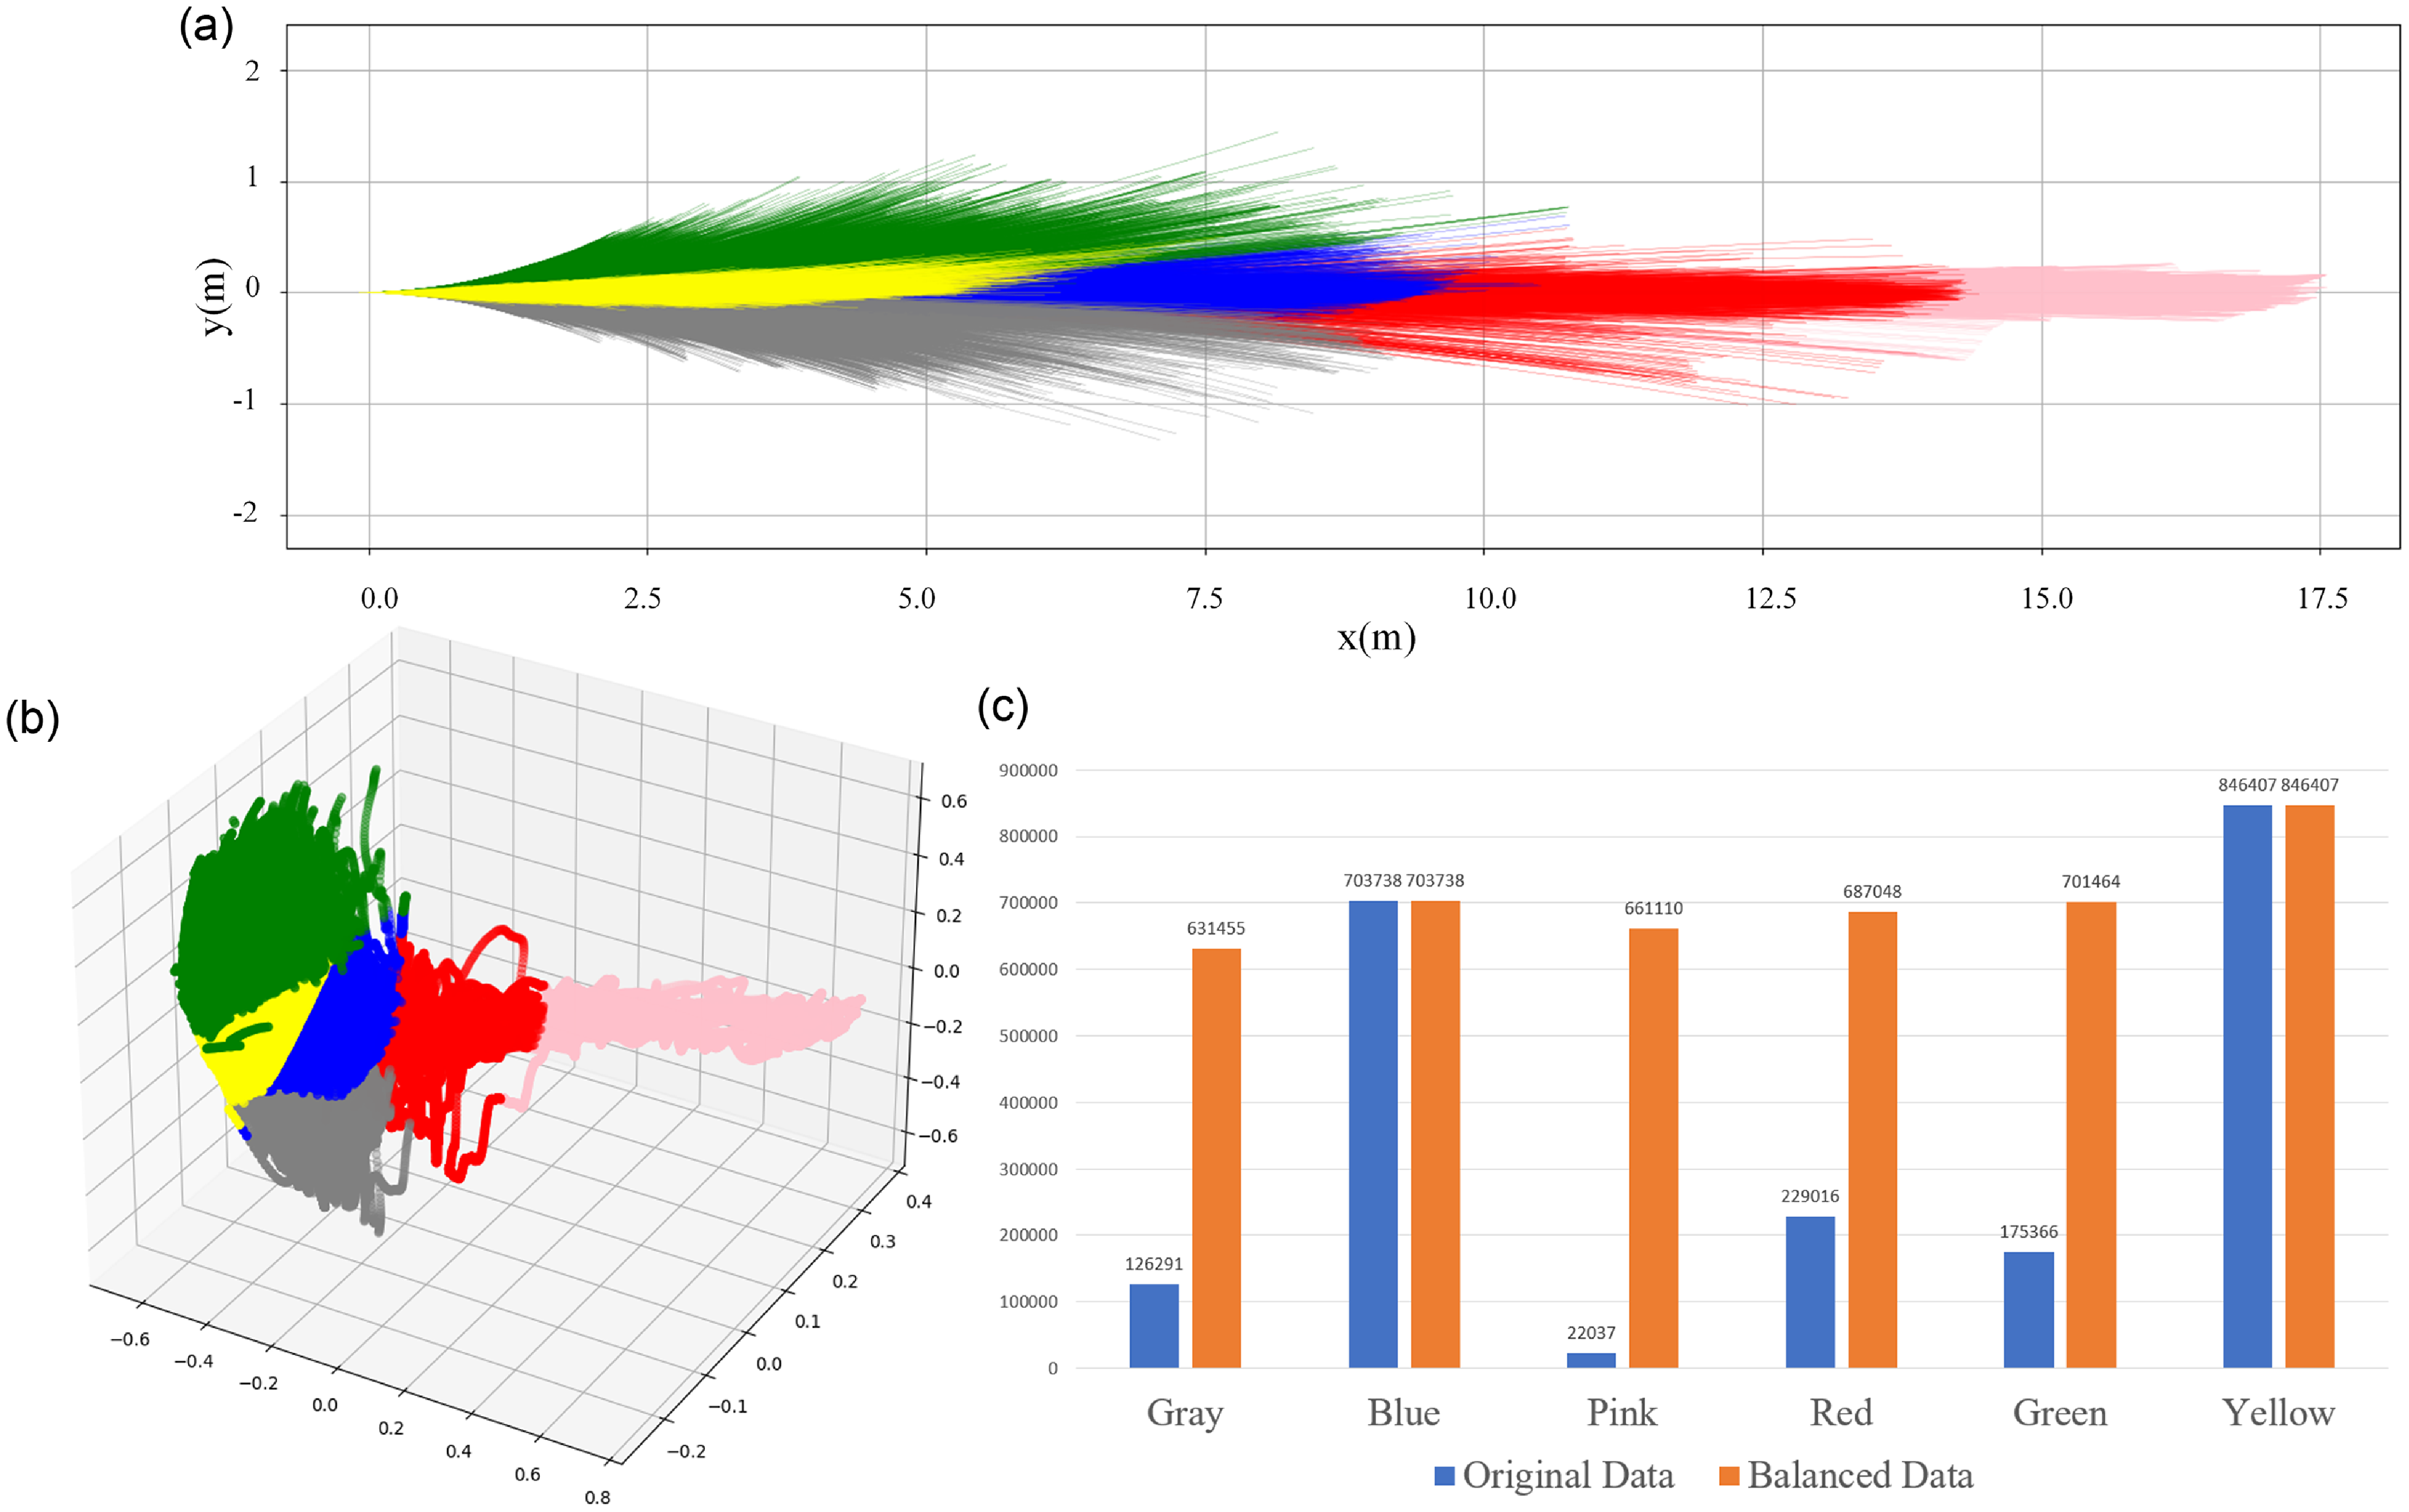
Figure 11(a) and Figure 11(b) show all data classification in the 3D feature space and the corresponding workspace, respectively. The colors in these two pictures correspond to each other. Simple clustering can distinguish the different MPs very well. In fact, we see that the categorized data corresponds to the MPs in different vehicle states when driving. Green, yellow, gray, blue, red, and pink can correspond to low-speed left, low-speed forward, low-speed right, medium, high, and higher speeds, respectively. The number of MPs in each category is shown in Figure 11(c). The amount of data in the figure varies considerably between the different vehicle states. The most significant amount of data is labeled in yellow, and the smallest is in pink. The experiment proves that the distribution of MPs is consistent with daily human-driving habits. However, such a significant difference in the amount of data for training deep learning networks can cause the network to fail to fit some states as expected.
Evaluation of MP generation results.

Building the MPs dataset. (a) The representation of the MPs in the workspace after classification, (b) The MPs in the 3D feature space after AE network encoding. Each class is represented with a different color. (c) Statistics on the number of MPs under different categories.

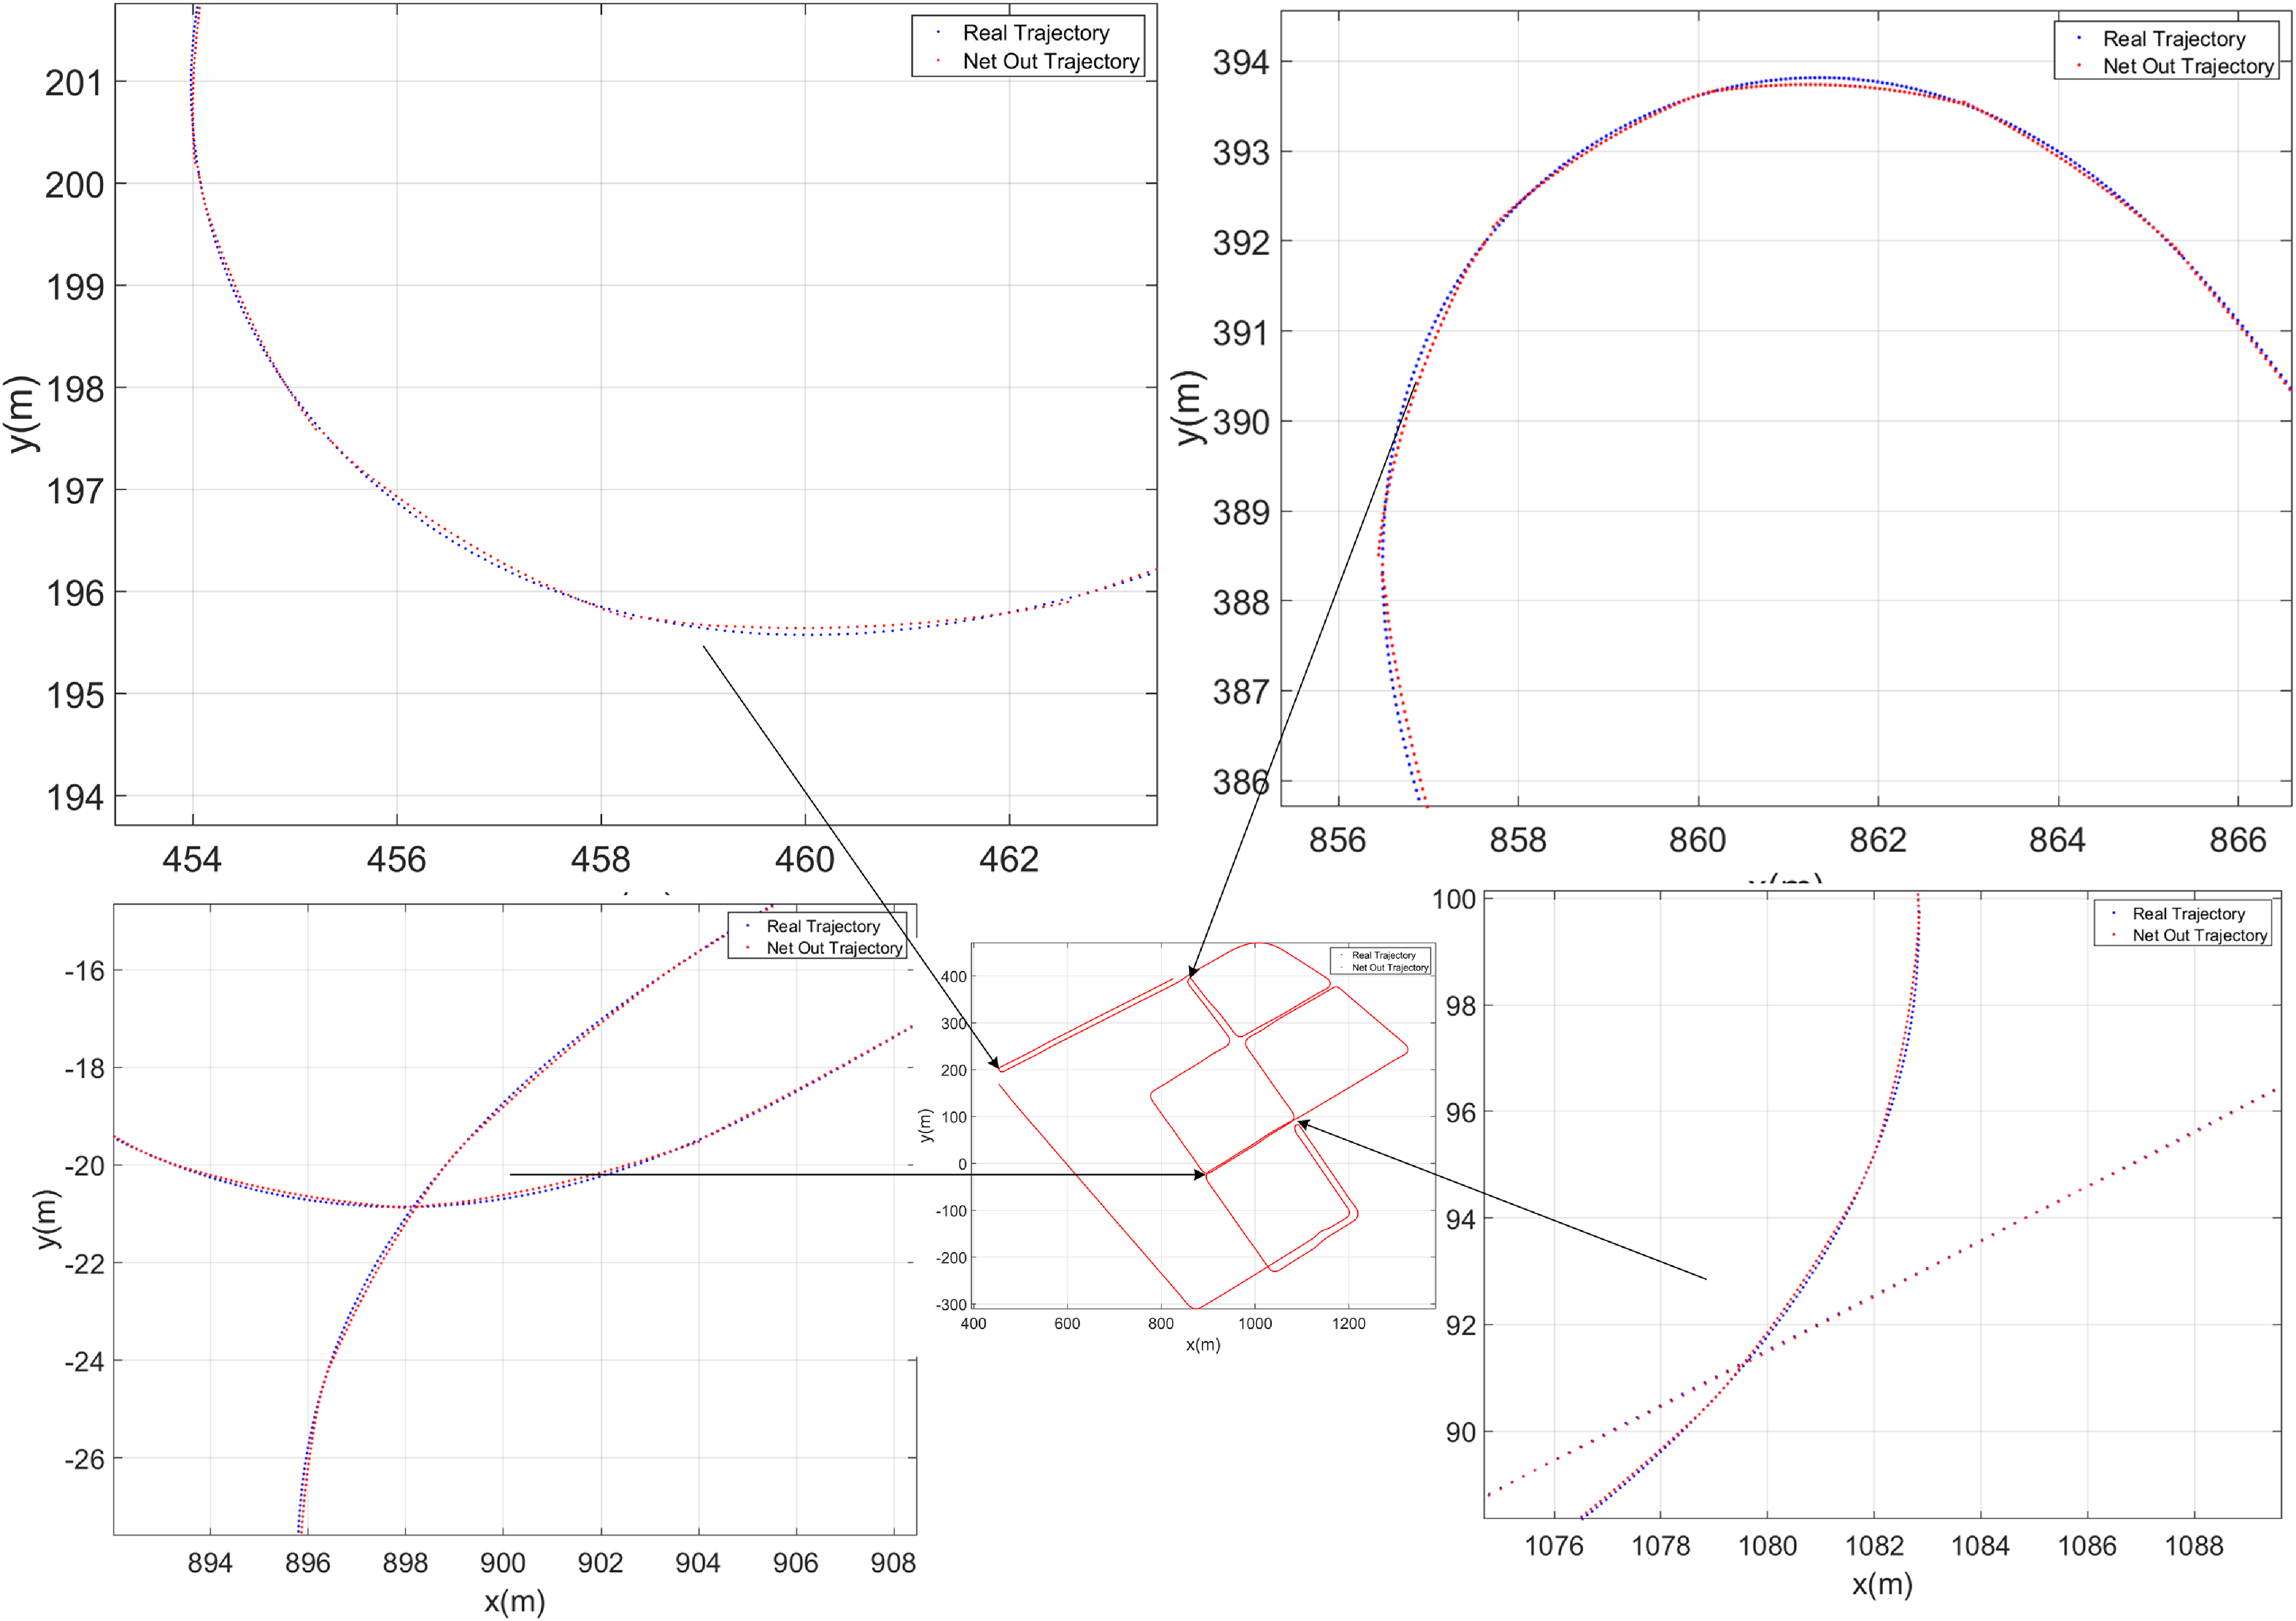
Path generates result by VM-LSTM MPs generation network.

5.3. Evaluation of VM-LSTM MPs generation
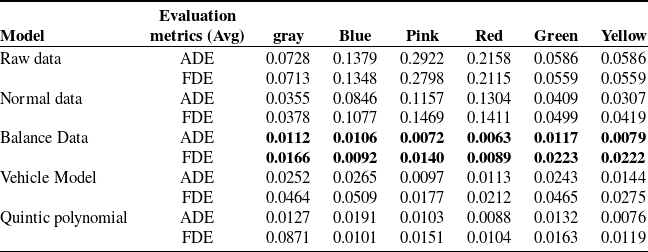
This section tests the MP network mentioned in Sec 4.2. The network aims to produce local MPs at a given starting and target state. The experiment is divided into two parts. The first part uses the test dataset from the original, normal, and data after data balancing to train the LSTM network. The MP generation test is then performed on the data in each category using the classification results from the previous section. We also performed a statistical analysis of the deviations of the vehicle model to generate MPs. The evaluation metrics for generating MPs are the average displacement error (ADE) and the final displacement error (FDE). ADE is the mean square error between all trajectory points output by the network and the real trajectory points. FDE is the mean square error between the target and real target states. Unlike the evaluation metric in the trajectory prediction algorithm, this metric introduces the orientation error and velocity error of the network-generated MPs. The calculation equation is shown as Eq.(8), where N denotes the total number of trajectory points.
 \begin{align}ADE & = \frac{\sum _{i=1}^{N}\left\| \hat{u}_{i}-u_{i}\right\| _{2}}{N}\\[3pt] FDE & = \left\| \hat{u}_{N}-u_{N}\right\| _{2}\nonumber\end{align}
We counted the deviations for the generated data. We obtained the mean and variance values of ADE and FDE between the data and its actual data in each category. The experimental results are shown in Table I. From the results of the data in the table, we can draw several conclusions. (1) VM-LSTM networks can achieve learning of MPs generated by human-driving behavior. As shown in the first row of Table I, the dataset containing anomalous data can also be learned using VM-LSTM. Still, the network is less effective in some cases due to the effect of anomalous data, such as the categories Pink and Red. (2) The fitting effect is significantly improved after excluding abnormal data, but the appropriate accuracy needs to be improved for the categories with a small data volume, such as Pink, gray, Green, and Red. (3) Data balance ensures that the network fits all categories better than the networks trained in the previous two datasets. (4) The results are compared with two traditional methods of generating MPs, vehicle kinematics modeling and quintic polynomials, which are more similar to human-driving trajectories.
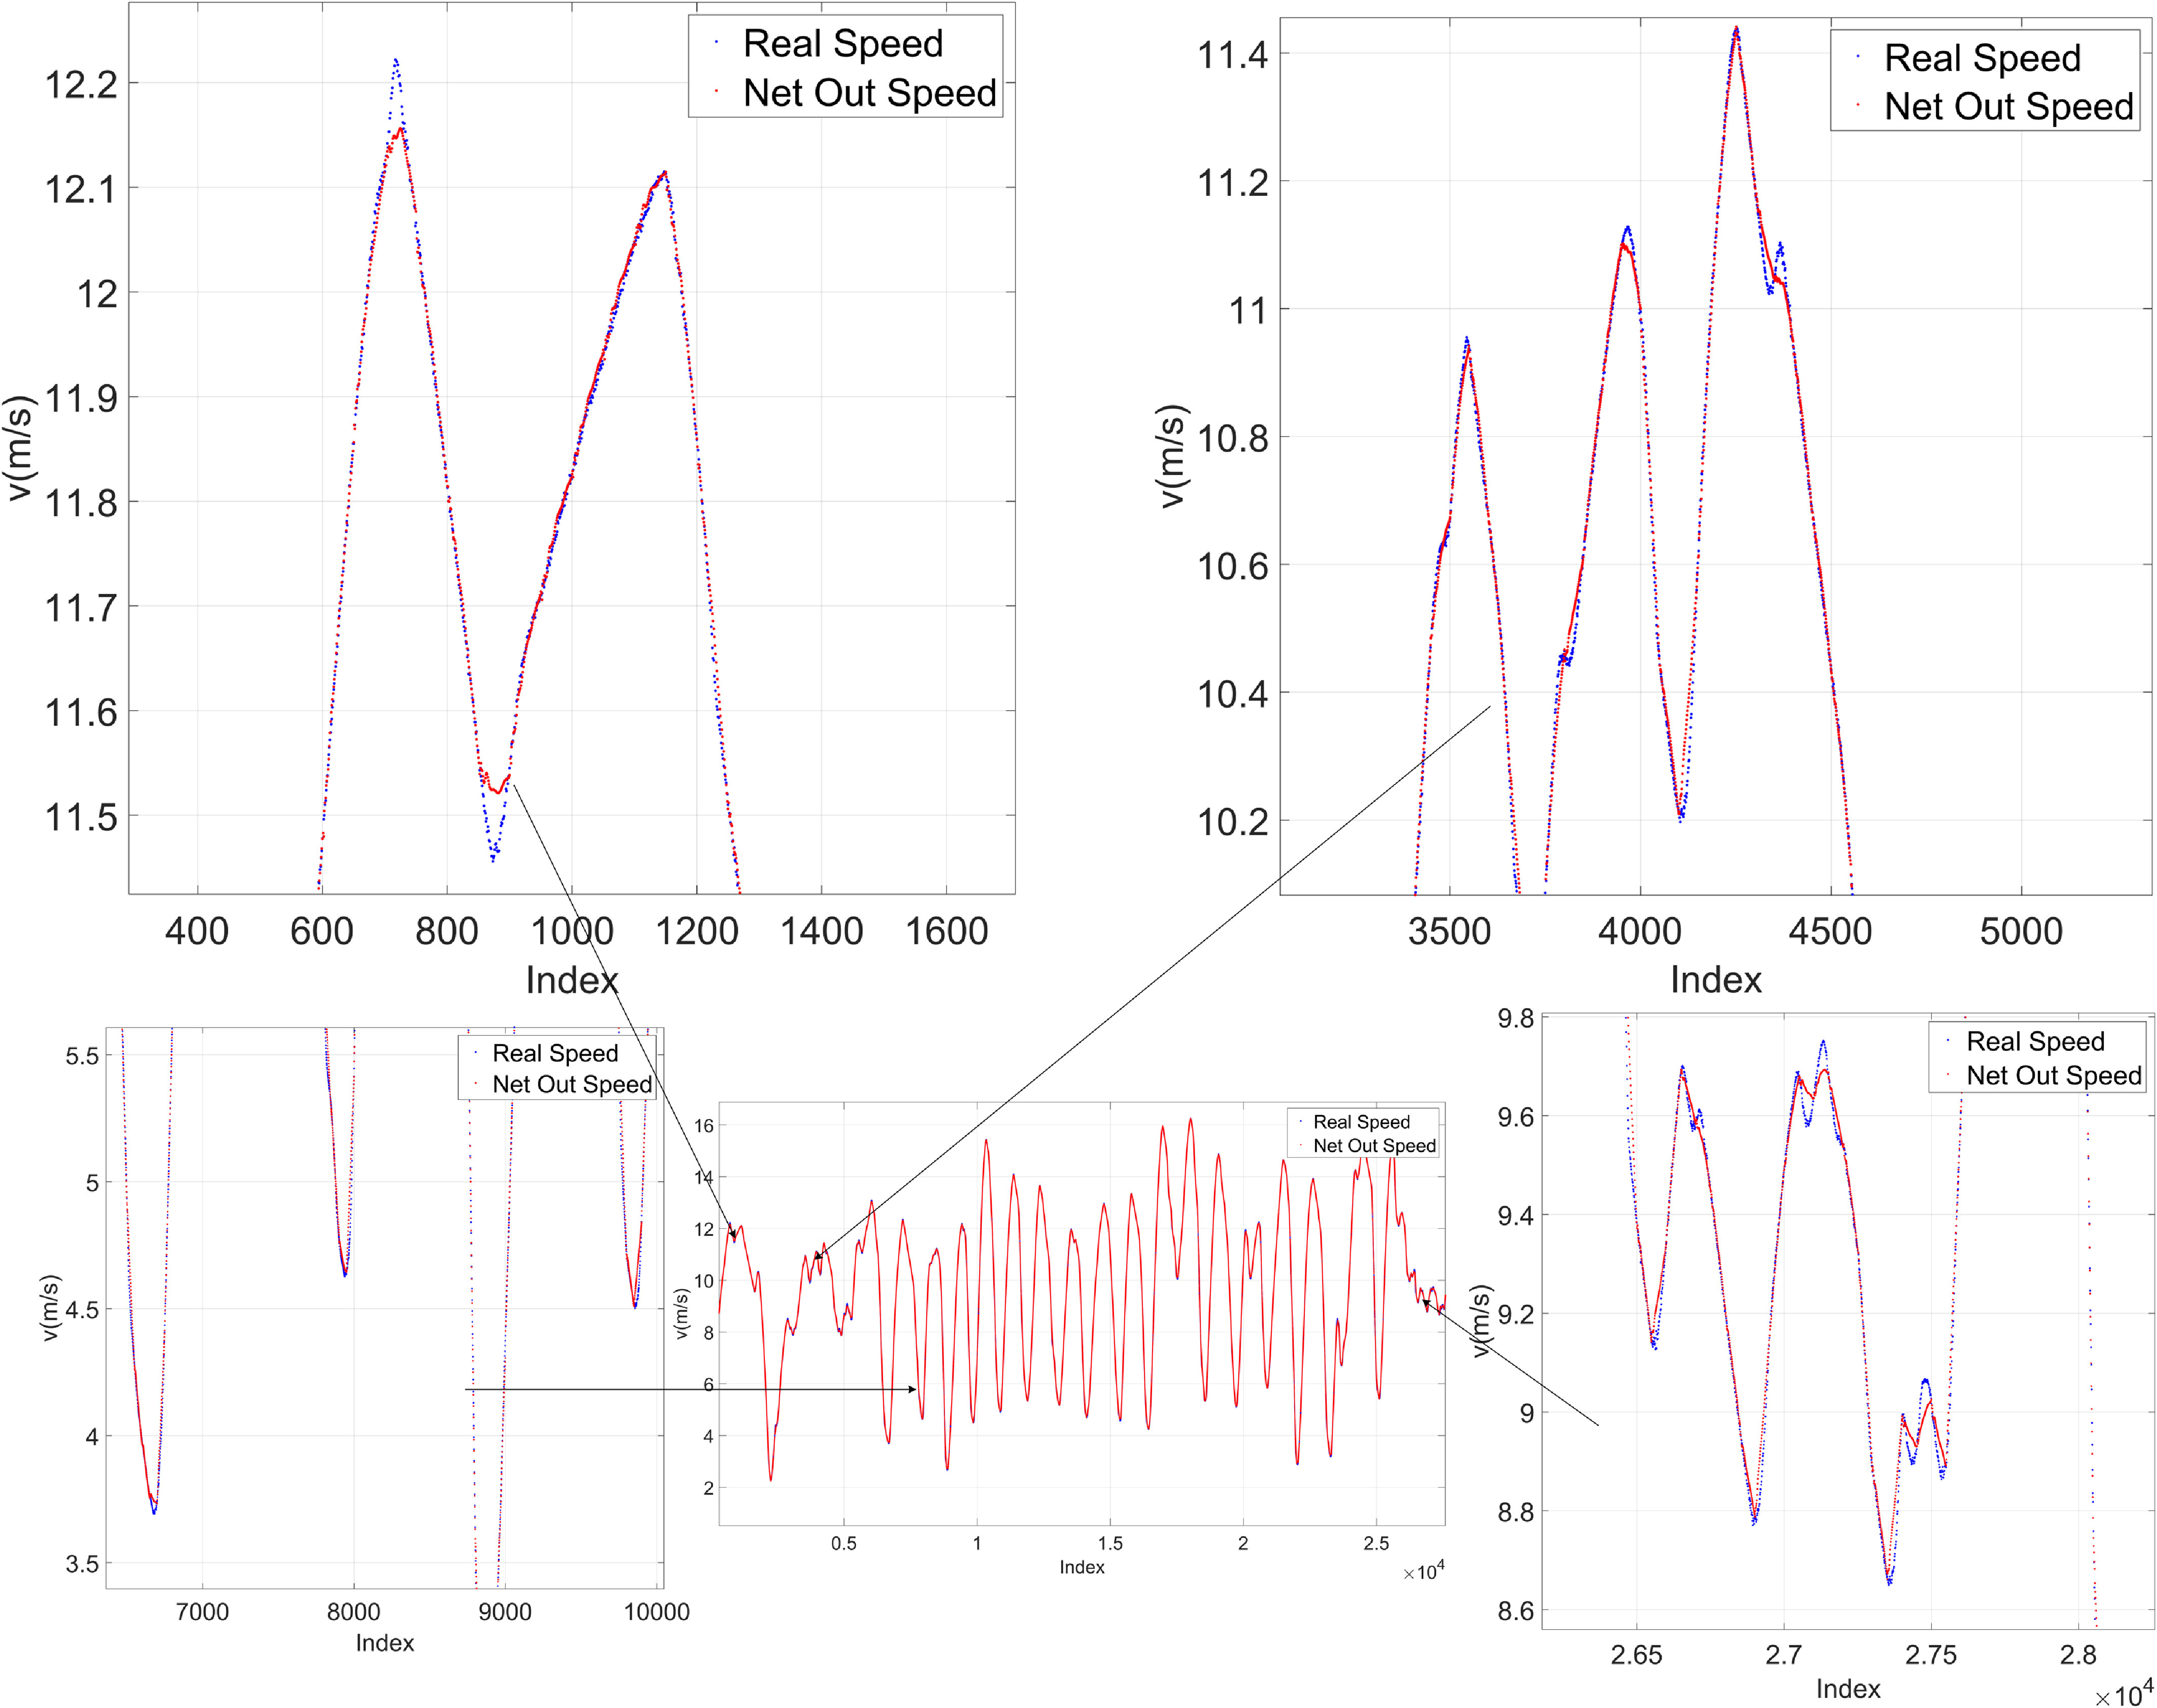
In the second part, we test the proposed algorithm using continuous human-driving trajectories and a representative portion of the trajectory data in the test set, respectively. Using the actual trajectory points as a benchmark, local target states on the trajectory were constantly selected as input to the MP generation network after obtaining the output results of the network, which were compared with the actual trajectory. Figure 12 shows the results. The red dashed line is the real vehicle trajectory, and the blue dashed line is the trajectory of the network-generated MP after the coordinate transformation. The small picture shows a zoomed-in view of a local area, which shows that the network also converges well to the actual vehicle trajectory in the vehicle turns. Figure 13 shows the results of the speed variation over the whole trajectory. The experimental results show that the MPs generated by the network fit closely and smoothly enough with the actual trajectory, and the speed profile is consistent with the actual speed. It can meet the demand for automatic driving. The experiments in this section test the effectiveness of the VM-LSTM MPs generation network based on the dataset and the actual trajectories, respectively. The results illustrate that the network can generate MPs for human-like driving in urban environments at a suitable local state. Regarding computational efficiency, the average time consumption for generating 1000 MPs simultaneously is around 10 ms.
Speed generates result by VM-LSTM MP generation network.

5.4. Evaluation of the sample state for MPs
The experiments in this section use the VM-LSTM MP generation network input in Sec 4.2 as the training data for GMM. As well as a quadratic test for generating MPs for the VM-LSTM network using acceleration constraints and constraints on vehicle velocity and executable trajectory curvature. The goal of the experiment is to validate the plausibility of the GMM model for the evaluation of VM-LSTM generated MPs and the selection of an appropriate GMM probability threshold.
Given random speed
 $(0,17m/s)$
, accelerations
 $({-}3,2m/s^{2})$
, and front wheel angles
 $({-}6,6rad)$
, a vehicle motion model is used to randomly generate 10,000 MP feature vectors, which are treated as local target states obtained by random sampling during motion planning and generate MPs to reach the target state using the method proposed in this paper.
As shown in Table II, we set the screening thresholds of the GMM to −200, −150, −100, and −50, corresponding to a gradual increase in the pass rate of the resulting MPs in the secondary feasibility check. However, since the GMM is a probabilistic model, there is no complete guarantee that the sifted local samples are available, and to retain some of the potentially useful samples, so the probability threshold of the GMM is set to −100.
Feasibility check pass rate for screening with different GMM thresholds.

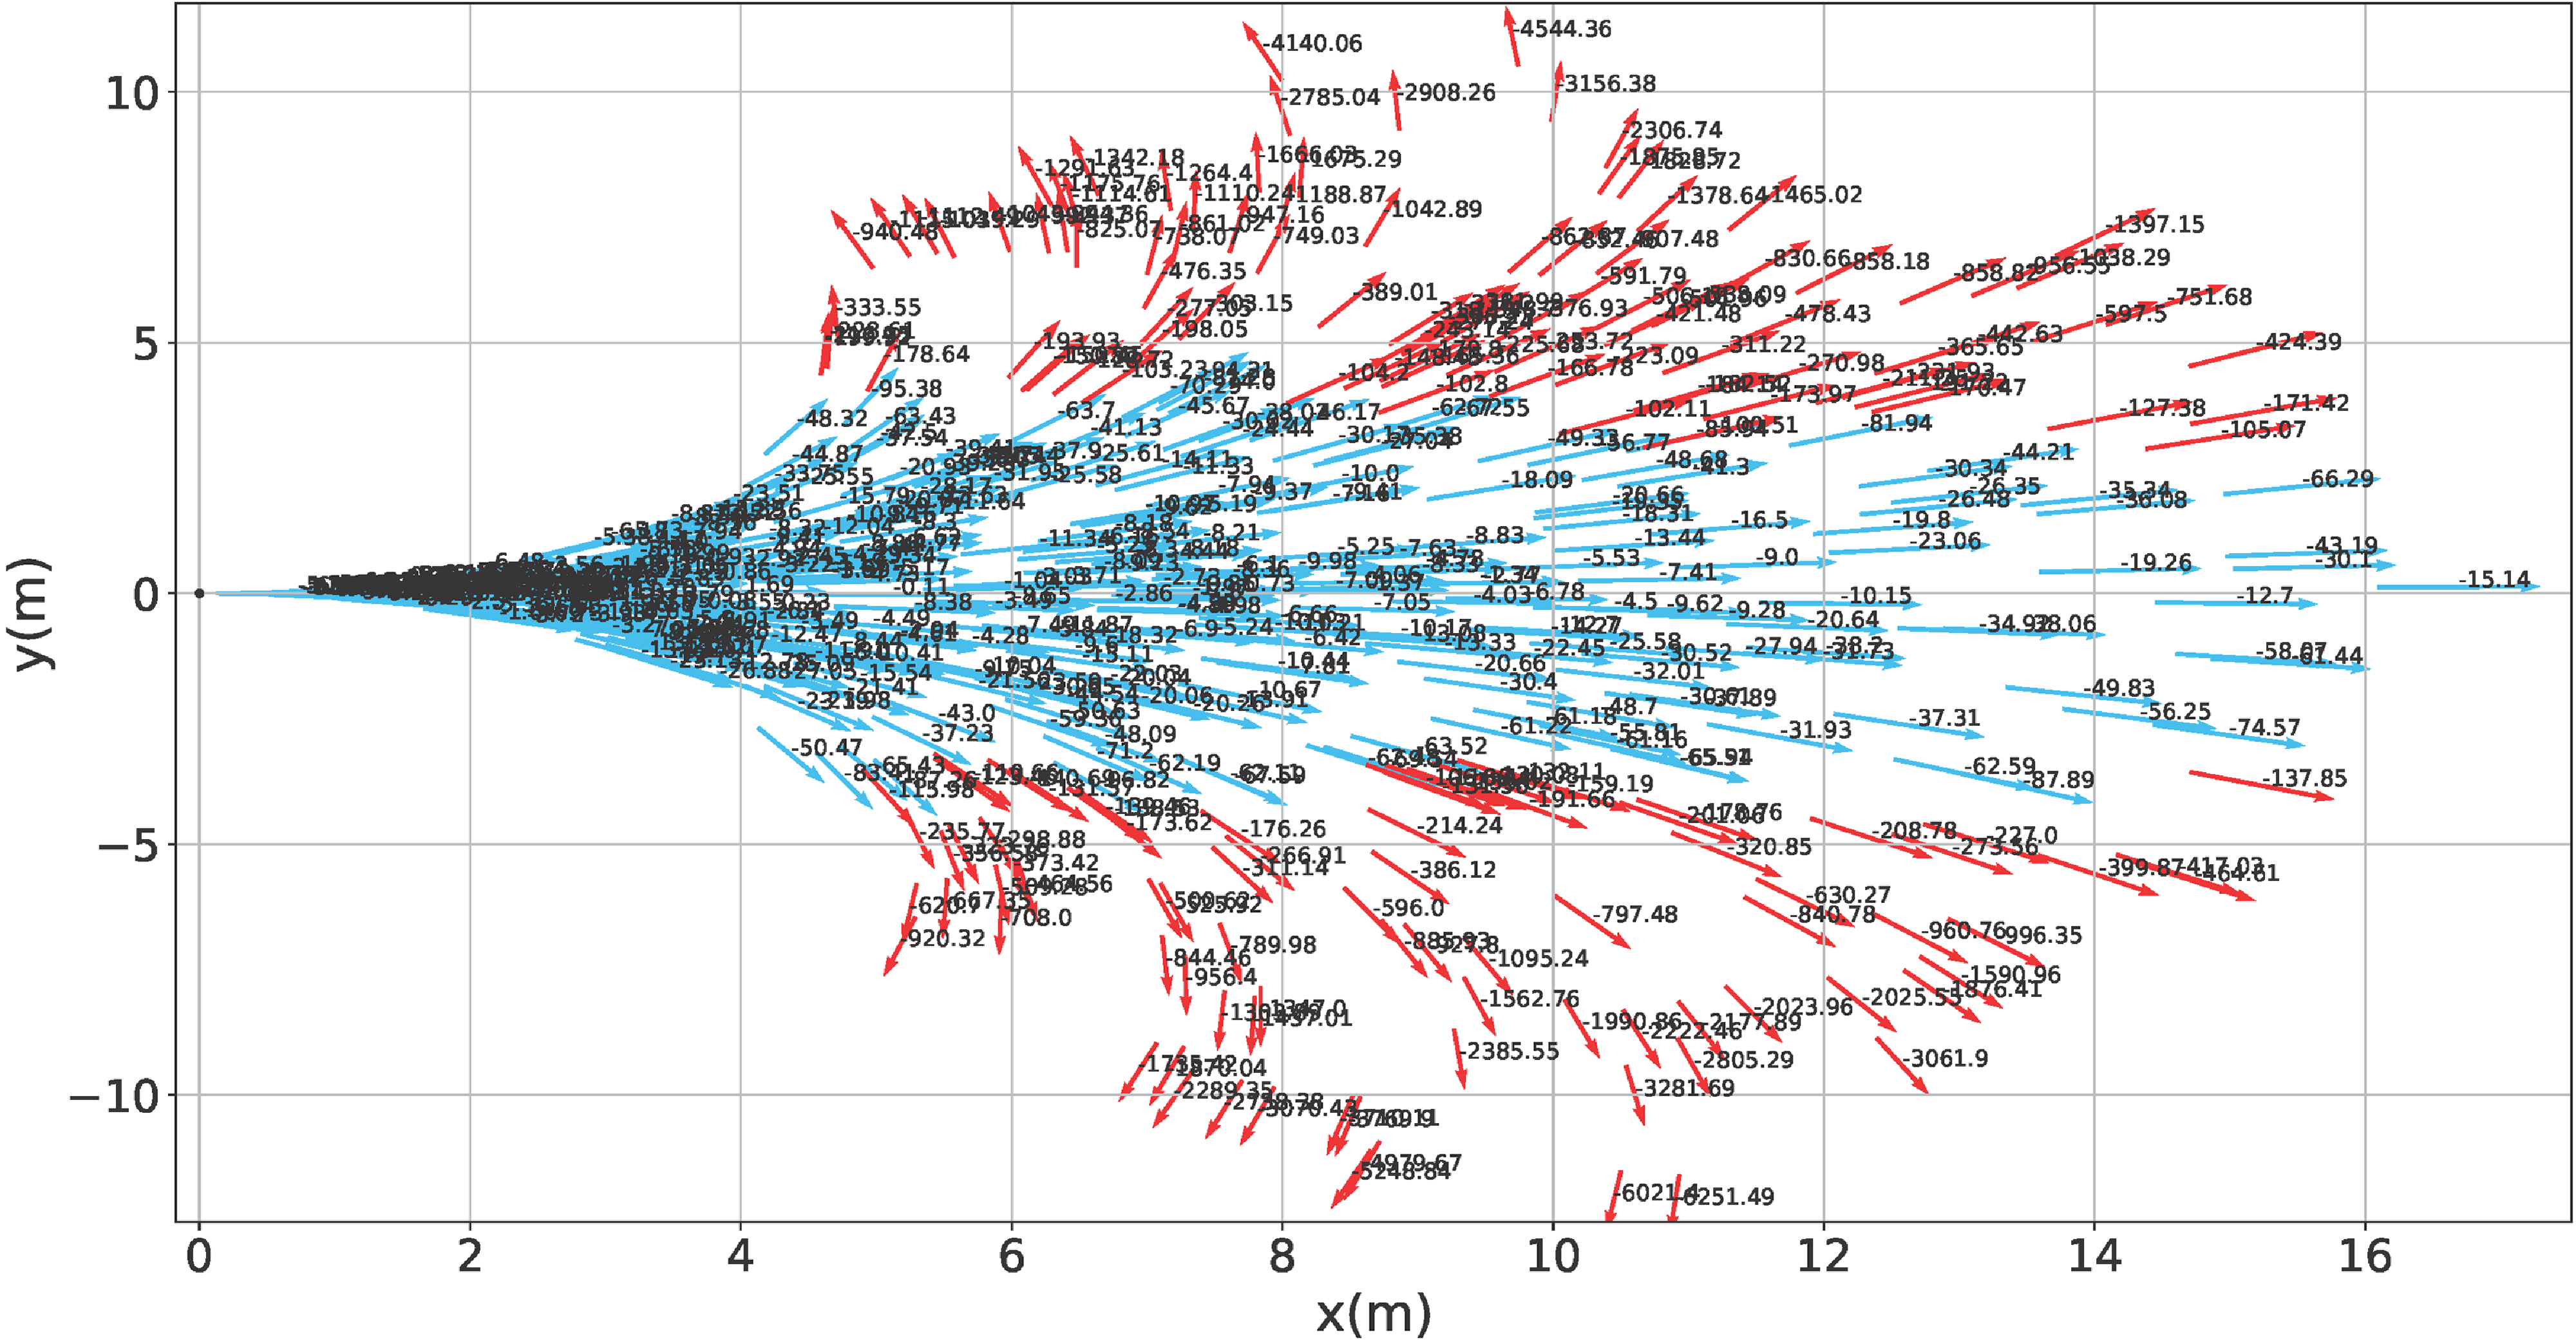
The experimental results of the GMM model are shown in Figure 14. All randomly generated MP feature vectors are represented as arrows in the figure. The farther the position of the arrow in the graph indicates, the higher the velocity of the vehicle. The experiment uses the GMM model to calculate the weighted log probability of each MP’s feature vector, and the values were printed on the graph in black font. The red arrows in the figure indicate MP feature vectors with low probability values, while blue indicates MP feature vectors with high probability values.
MPs feature vector estimation by GMM. Red arrows indicate samples with probability values less than the threshold value, blue indicates samples with probability values greater than the threshold value, and the number above is the probability value of the state sample.

6. Conclusion
This paper proposes a new framework to learn human-driving trajectory data. We use fixed-duration trajectories to represent MPs to facilitate the learning and application of MP. Feature extraction and anomaly detection were performed using an AE network on the original MP data. Classify all normal data in the low-dimensional space and balance the number of data in each class. Finally, we obtained a dataset that covers all daily driving behavior. Based on this dataset, we proposed a learning-based model that combines the vehicle model with LSTM to form a vehicle MP generation network. To quantify the feasibility of describing individual MPs, we use the MP feature vectors to train the GMM model to form probabilistic estimates for the given MP feature vector. Finally, various experiments are designed to demonstrate that these models proposed in the paper can effectively satisfy the generation of multiple types of MPs in the autonomous vehicle motion planning algorithm. The experimental results show that the method can generate a large number of MPs quickly and has a high accuracy, which can meet the requirements for using MPs in motion planning algorithms. The GMM can reflect the degree of feasibility of a given MP feature vector.
The GMM model proposed in this paper evaluates the feasibility of individual MPs. Still, the planning algorithm often needs to plan the trajectory for a long period, and whether the evaluation results of individual MP can be applied to the evaluation of the final trajectory is an issue that needs to be solved. The following work will be based on the MP generation network proposed in this paper combined with the sampling class search algorithm to design a motion planning algorithm that can satisfy scenarios in daily urban areas.
Author contributions
Gengxin Li work realization as well as experiments, article writing. Jianru Xue provides guidance on research directions as well as articles.
Acknowledgments
All authors are with National Key Laboratory of Human-Machine Hybrid Augmented Intelligence, National Engineering Research Center for Visual Information and Applications, and Institute of Artificial Intelligence and Robotics, Visual Cognitive Computing and Intelligent Vehicle Lab (VCC&IV), Xi’an Jiaotong University, Xi’an, P.R.China.
Financial support
This study was not specifically funded by any funding agency, commercial or non-profit sector.
Competing interests
The authors declare no conflict of interest.
Ethical approval
Not application.