Ladin (ISO 639-3: lld) is a Romance language spoken in the Italian Central-Eastern Alps by a community of about 30,000 speakers (Dell’Aquila Reference Dell’Aquila and Raffaele2010). The classification of Ladin within Western Romance has been the subject of a long-lasting scientific and at times ideological debate, particularly because at the end of the 19th century the region was contested between the new-born Italian state and the Habsburg empire. The varieties of Ladin share phonetic-phonological, morphological, syntactic and lexical features with the other languages spoken in the Central-Eastern Alps, such as Friulian and Romansh, thus leading to the identification of the Rhaeto-Romance group (Haiman & Benincà Reference Haiman and Paola1992). However, in Ladin there are still many linguistic phenomena that connect it to the Romance dialects of Northern Italy. Therefore, a clear assignment of Ladin to a group is by no means a simple and uncontroversial operation (Salvi Reference Salvi, Adam and Martin2016).
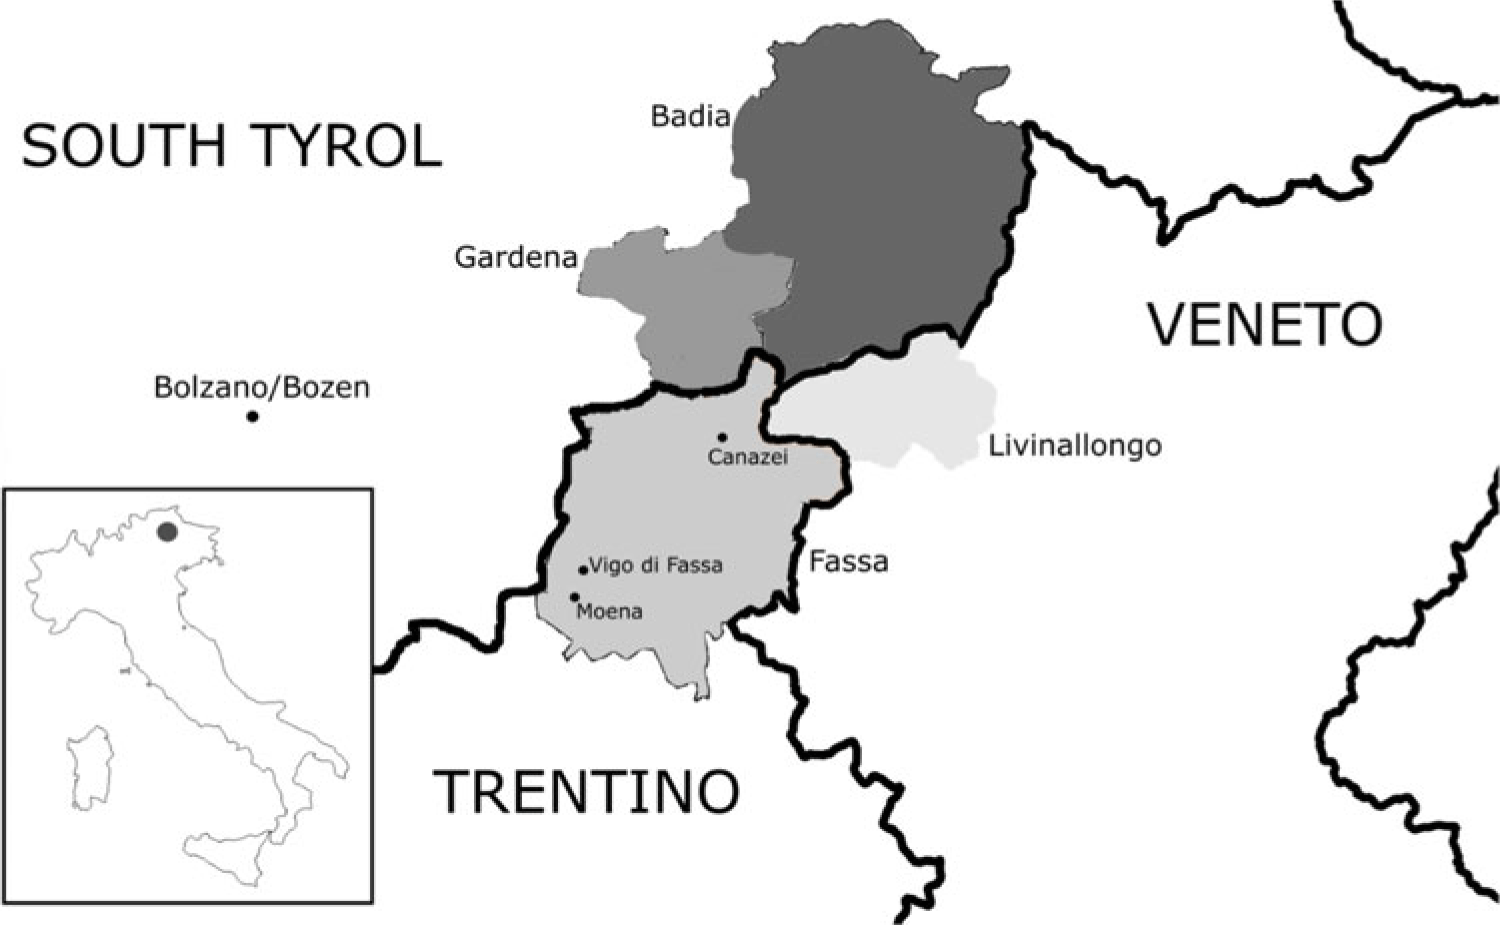
The Ladin community lives in the valleys around a mountain range called the Sella massif. Although the valleys are close to each other, communication between the valleys has not always been easy. In addition, after the First World War, the valleys which were previously part of the Austro-Hungarian Empire were annexed by Italy and divided administratively into three provinces: Bolzano-Bozen (South Tyrol), Trento (Trentino) and Belluno (Veneto) (see Figure 1).
Location of the Ladin community.

Due mainly to the geographical configuration of the territory, the Ladin language shows considerable internal linguistic variation. Ladin is subdivided into different varieties that are spoken in the valleys around the Sella massif. The valleys and their respective varieties are:
(i) Val Badia/Gadertal with two varieties Marèo and Badiòt (further divided into lower valley variety Ladin and upper valley variety Badiòt)
(ii) Val Gardena/Gröden/Gherdëina, with Gherdëina
(iii) Val di Fassa with Fascian, divided into one upper valley variety Cazet and two lower valley varieties Brach and Moenat
(iv) The upper valley of Cordevole river, more specifically the area around the municipality of Livinallongo del Col di Lana (Fodóm), with Fodóm
In this paper we focus on the Val di Fassa Ladin varieties: Cazet, spoken in the village of Canazei, Brach, spoken in the village of Vigo di Fassa, and Moenat, spoken in the village of Moena.
From a sociolinguistic point of view, the Ladin linguistic community is characterized by complex multilingual repertoires that include, depending on the valley, Italian, German, Tyrolean dialect (southern Bavarian dialect), and Trentino and Veneto dialects (Italo-Romance dialects) (Dell’Aquila & Iannaccaro Reference Dell’Aquila and Iannaccaro2006). More specifically, the Badia and Gardena valleys are more in contact with Italian, German and Tyrolean dialect, the Fassa valley with Italian and Trentino dialect, while Livinallongo with Italian and Veneto dialect. The influence of Italian and German in multilingual repertoires poses a threat to the vitality of this language. For this reason, Ladin is protected by Italian law (482/1999) as a minority language. The status of Ladin has been characterized as ‘threatened’ (Simons & Fennig Reference Simons and Charles2018), using the Expanded Graded Intergenerational Disruption Scale (EGIDS) for assessing language endangerment (Lewis & Simons Reference Lewis and Simons2010). In Val di Fassa, Standard Fascian Ladin is taught at school. Standard Fascian Ladin is based on Cazet (Chiocchetti & Iori Reference Chiocchetti and Iori2002, DILF 2013).
Acoustic recordings of Ladin words in this paper were acquired in June 2018 in Vigo di Fassa. The recordings were made onto a laptop computer using a head-mounted USB microphone and Praat software at a sampling frequency of 44,100 Hz (Praat software developed by Paul Boersma and David Weenink, available at http://www.praat.org; Boersma Reference Boersma2001). Four speakers of varieties of Val di Fassa Ladin were recorded: two speakers (both female) from Vigo di Fassa whose pronunciation is representative of Brach, one speaker (female) from Canazei whose pronunciation is representative of Cazet, and one speaker (male) from Moena whose pronunciation is representative of Moenat. The speakers fell within an age range of 18–35 years, and at the time of our recordings, each of our speakers continued to reside at least part of the year in the village where their variety is spoken. Words were elicited in the frame [ˈdime __ ˈmaria] for the speakers of Brach and Cazet and [ˈdimo __ ˈmaria] for the speaker of Moenat, meaning ‘say __, Maria’. Illustrations of the consonants and vowels were collected from speakers across all three varieties; for additional details, including diphthongs, triphthong, and stress, the speaker of Moenat provided illustration.
All four speakers largely converge on the main descriptive points for the sound system of Val di Fassa Ladin. The findings we provide here contribute to the documentation and understanding of the language as a whole. We also make note of some differences in the speech patterns of our speakers and indicate where such they are consistent with previous descriptions of characteristics of regional varieties. However, further work with more speakers would be needed for an investigation of systematic differences across varieties.
Consonants
The consonant phoneme inventory of Val di Fassa Ladin is generally consistent across our speakers with the exception that the speaker of Moenat lacks the affricate /ts/. Further, while our phonemic transcriptions for the sibilants produced posterior to the alveolar region are /s̠, z̠/ and /t̠s̠, d̠z̠/ for all speakers, there are some differences within and across speakers in the realization of these sibilants, as we will discuss presently.

(Near-)minimal pairs were identified for specific consonant contrasts rather than across the entire consonant set, because full (near-)minimal sets were not available in the lexicon. Owing to lexical and phonological variation, a separate set of words was assembled for each variety. The word sets contain pairs that illustrate contrasts for place of articulation, voicing, and manner (plosive vs. affricate, fricative and nasal, affricate vs. fricative, nasal vs. liquid, trillFootnote 1 vs. lateral approximant). Near-minimal pairs match minimally in the vowel following the consonants under comparison. To meet these pairwise aims, in some cases more than one word illustrating a given consonant is included in our wordset. Note that we transcribe the first vocoid in a rising diphthong with /j/, as we discuss later. The transcriptions in the list below are all phonemic.
The Ladin orthography conventions followed here are those used for the Ladin-Fascian standard, as encoded in Chiocchetti & Iori (Reference Chiocchetti and Iori2002) and DILF (2013). In this writing system, an accent is marked on stressed vowels under various conditions that we discuss in the section on word stress. On mid vowels, the choice of accent mark is sensitive to vowel quality such that a grave accent on e or o indicates an open-mid vowel and an acute accent indicates a close-mid vowel.

All consonants can occur in word-initial position, as illustrated in the lists of (near-) minimal pairs, with the exception of /ɲ/, which is rare in this context. Nevertheless, /ɲ/ is attested in a few words in word-initial context, for example, /ɲɔk/ gnoch ‘dumpling’, /ɲiˈɲɔla/ gnignola ‘lizard’, /ˈɲapa/ gnapa ‘mouth (rude, childish)’. Our recorded illustrations of these words are from the Moenat speaker. A minimal pair for /n/ ~ /ɲ/ was identified for post-vocalic context. Although /s/ and /s̠/ both occur in word-initial context, it is difficult to find a minimal pair for this contrast; however, they are contrasted after a vowel. Likewise, pairs contrasting word-initial /z/ and /z̠/ are rare, but a near-minimal pair with these consonants before /a/ was found.
All consonants are attested in word-final context, except voiced obstruents, consistent with what was reported by Heilmann (Reference Heilmann1955) for Moenat.

Voiced plosives
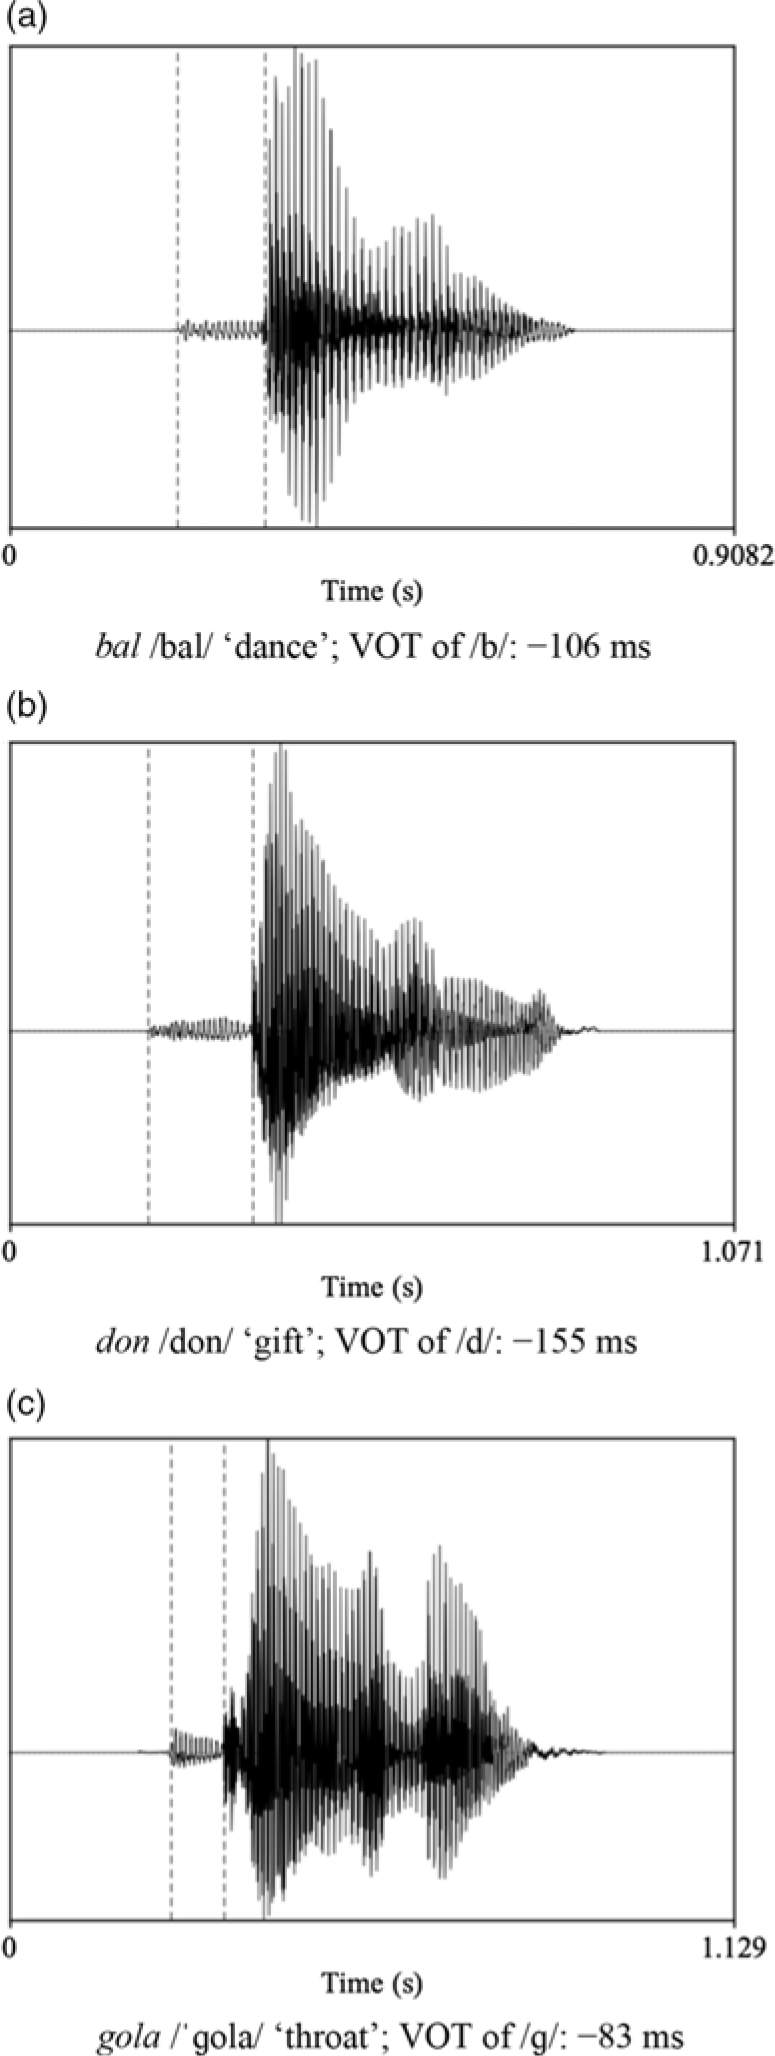
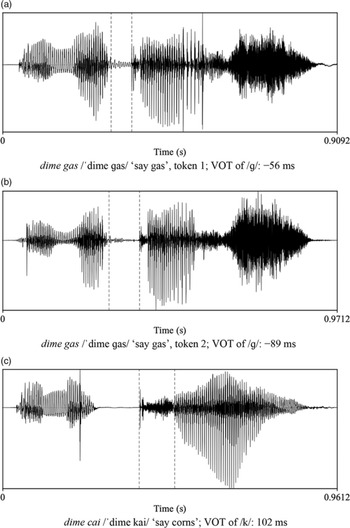
Voiced plosives, /b d ɡ/, show both within and across speaker variations. Though some tokens are perceived to be less voiced than others, they still show a qualitative difference from their voiceless counterparts, /p t k/, and we transcribe these plosives as voiced rather than voiceless unaspirated. For the Moenat speaker, there is typically a clear prevoicing portion of the voiced plosives, with a long negative VOT, as exemplified in Figure 2.
Waveforms of three words pronounced by the Moenat speaker. Intensity is scaled to −70 dB. The duration of VOT is demarcated by two dashed lines in each panel.

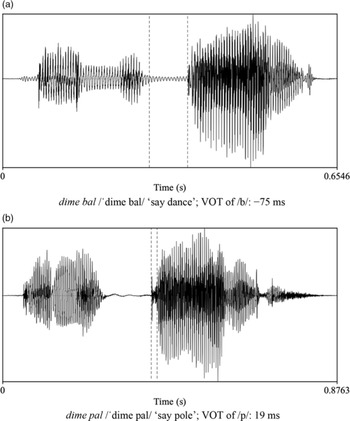
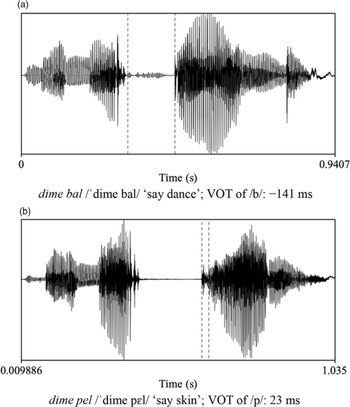
For the Brach and Cazet speakers, there is also prevoicing for /b d ɡ/, as shown by a comparison of representative waveforms for dime bal /ˈdime bal/ ‘say dance’ and dime pal /ˈdime pal/ ‘say pole’ for a Brach speaker in Figure 3. A similar comparison between dime bal /ˈdime bal/ ‘say dance’ and dime pel /ˈdime pɛl/ ‘say skin’ for the Cazet speaker is shown in Figure 4. Since our tokens were embedded in a carrier sentence, the preceding word dime is included for better illustration.
Waveforms of dime bal and dime pal produced by a Brach speaker. Intensity is scaled to −70 dB. The duration of VOT of /b/ and /p/ is demarcated by two dashed lines in each panel. Panel (a) shows prevoicing of bal, comparing to pal in panel (b).

Waveforms of dime bal and dime pel produced by the Cazet speaker. Intensity is scaled to −70 dB. The duration of VOT of /b/ and /p/ is demarcated by two dashed lines in each panel. Panel (a) shows prevoicing of bal, comparing to pel in panel (b).

Nevertheless, some tokens produced by these speakers show less typical prevoicing patterns, with less intense vocal fold vibration. Two tokens of dime gas /ˈdime ɡas/ ‘say gas’ produced by the Cazet speaker are shown in Figure 5 to illustrate this variation. A token of dime cai /ˈdime kai/ ‘say corns’ is also included for comparison.
Waveform of two tokens of dime gas and a token of dime cai produced by the Cazet speaker. Intensity is scaled to −70 dB. The prevoicing portion of onset /g/ is between two dashed lines. The token in panel (a) shows more intense prevoicing than the token in panel (b). Additionally, no prevoicing is observed in panel (c), dime cai /ˈdime kai/. The duration of VOT of the voiceless aspirated /k/ is marked by two dashed lines.

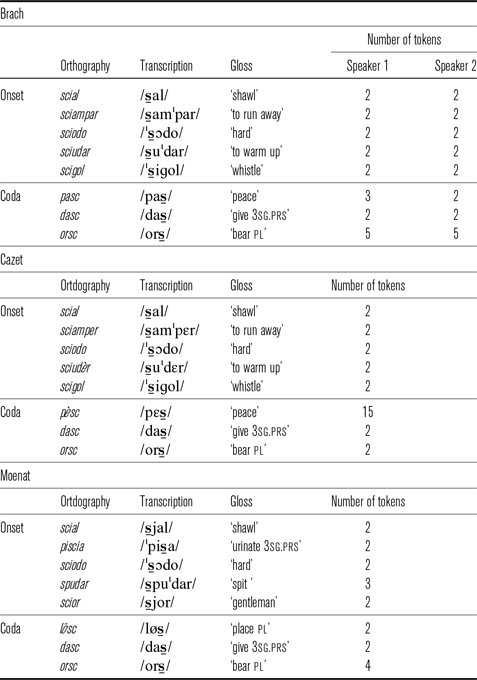
Words for spectral analyses of /s̠/.

Sibilants
Dental/alveolar sibilant fricatives in Val di Fassa Ladin are /s z/, which are commonly dentalized for the Moenat speaker, such as /son/ [s̪on] son ‘sound’, /sal/ [s̪al] sal ‘salt’ and /zal/ [z̪al] śal ‘yellow’. The dental/alveolar affricate /ts/, which figures in the phoneme inventory of the speakers of Brach and Cazet, is produced as /s/ by the speaker of Moenat; compare /ˈpitsa/ piza ‘itch (noun)’, as produced by the Cazet speaker, with /ˈpisa/ piza ‘itch (noun)’, as produced by the Moenat speaker.
The sibilant series produced posterior to the alveolar region are transcribed as /s̠ z̠/ and /t̠s̠ d̠z̠/ with a retracted diacritic. In the absence of articulatory data, we do not make any claims about the apical or laminal nature of these sibilants, but this would be useful to investigate in future work. The postalveolar series for the Moenat speaker stands out in general, tending to be realized as retroflex [ʂ ʐ] and [ɭʂ ɖʐ], while those for the Cazet and Brach speakers, albeit with some variations and neutralization, tend to be [s̠ z̠] and [tʃ dʒ], which are not retroflex but still perceived to be posterior to the dental/alveolar series.Footnote 4 Despite the variations observed in the speech of the Brach and Cazet speakers, to be discussed shortly, the phonemic status of /s z/ and /s̠ z̠/ in Val di Fassa Ladin is supported by spelling and morphological functions. In Ladin orthography, /s/ and /z/ are written as s and ś, while /s̠/ and /z̠/ are written as sc/sci and j. Word-finally, /s/ and /s̠/ are used for distinguishing singular and plural forms, respectively, as well as in the conjugation for verbs. However, there is a low functional load for the contrast between dental/alveolar and postalveolar sibilants. Furthermore, for the Brach and Cazet speakers, the realization of postalveolar fricative phonemes show more inter- and intraspeaker variation, and sometimes they tend to nearly or fully merge with dental/alveolar fricatives. As for the affricates, the contrasts are well maintained and the phonetic realizations are consistent, both within and across speakers.
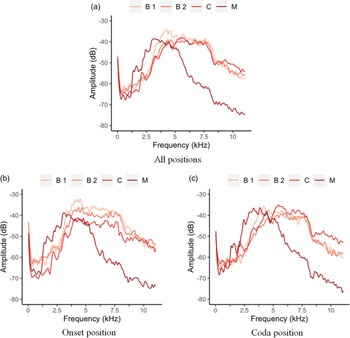
Averaged raw spectra of voiceless postalveolar sibilant /s̠/. Spectra are averaged by speaker: ‘B1’ (Brach speaker 1), ‘B2’ (Brach speaker 2), ‘C’ (Cazet speaker), and ‘M’ (Moenat speaker). Upper panel shows spectra for /s̠/ in all positions, lower left panel for /s̠/ in onset position, and lower right panel for /s̠/ in coda position.

To illustrate the differences across speakers, we first examined the acoustic properties of the voiceless sibilant fricatives. For each speaker, words containing voiceless postalveolar sibilants were selected, as listed in Table 1. For each token, a 40 ms window in the middle of the sibilant was selected, and the spectral envelope of the window was extracted. The averaged spectral envelopes across speakers are shown in Figure 6. We note that these analyses serve as a preliminary study only, since the tokens used for spectral analysis were not strictly controlled for syllable position and vowel quality; however, they offer a basis for future hypothesis formation and investigation.
The general spectral shape for /s̠/ produced by the Moenat speaker is distinguishable from that of the others, with a peak at lower frequency around 2500 Hz – 3000 Hz, across syllable positions. This suggests that the voiceless postalveolar fricative for the Moenat speaker is qualitatively different.
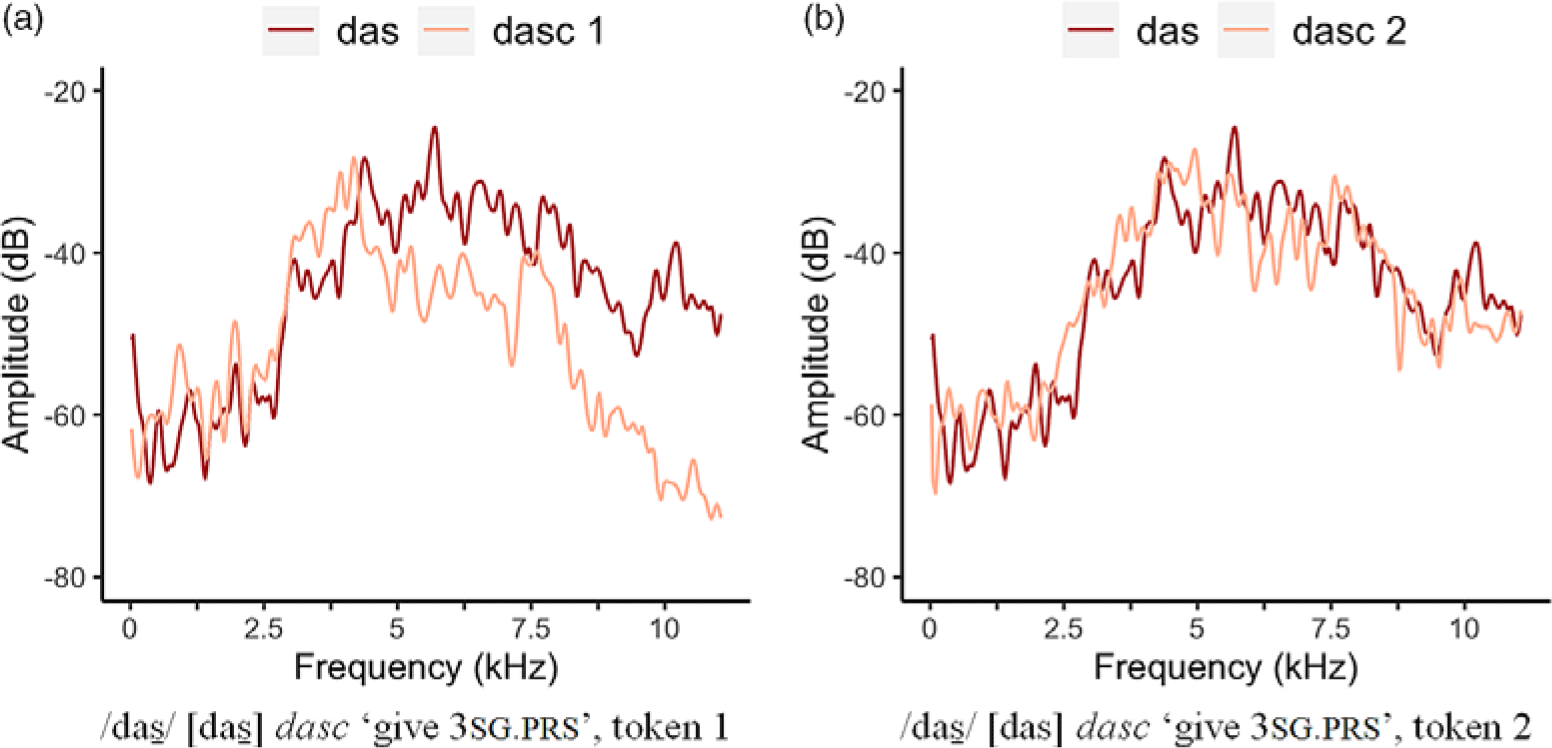
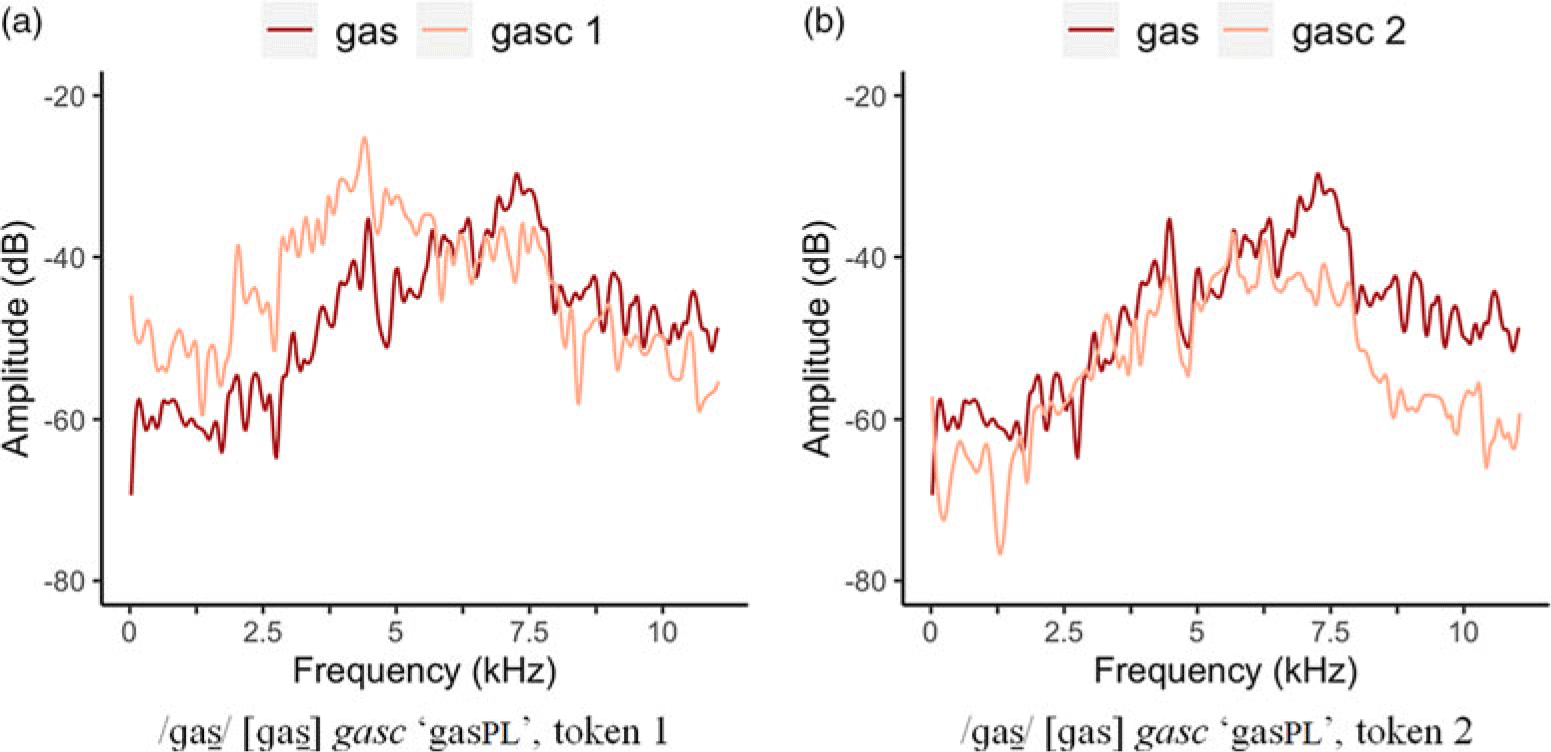
As for the Brach and Cazet speakers, more intraspeaker variation for the phonetic realization of the postalveolar fricatives was found, including the degree of fronting and (near-)merger with the dental/alveolar fricative. For instance, for a Brach speaker, two tokens of /das̠/ dasc ‘give 3sg.prs’ that were acquired from randomized word lists are compared with a token of /das/ das ‘give 2sg.prs’ in Figure 7, where the spectral information of the sibilants is extracted and illustrated with the same method introduced above. In Figure 7(a), the sibilant in /das̠/ [das̠] dasc ‘give 3sg.prs’ shows a different spectral shape from the sibilant in /das/ [das] das ‘give 2sg.prs’, while in Figure 7(b), the sibilant in the other token of /das̠/ [das] dasc ‘give 3sg.prs’ nearly merges with the dental/alveolar sibilant. A similar comparison between /ɡas/ [ɡas] gas ‘gas sg’ and two tokens of /ɡas̠/ [ɡas̠, ɡas] gasc ‘gas pl’ is given in Figure 8 for the Cazet speaker.
Two tokens of dasc compared with a token of das produced by a Brach speaker. The spectra of the sibilants were extracted and plotted. Panel (a) shows a distinctive spectral shape with a peak at lower frequency for the sibilant in dasc; panel (b) shows near-merger.

Two tokens of gasc compared with a token of gas produced by a Cazet speaker. The spectra of the sibilants were extracted and plotted. Panel (a) shows a distinctive spectral shape with a peak at lower frequency for gasc; panel (b) shows near-merger, especially below 7000 Hz, though some difference can be still observed at higher frequencies.

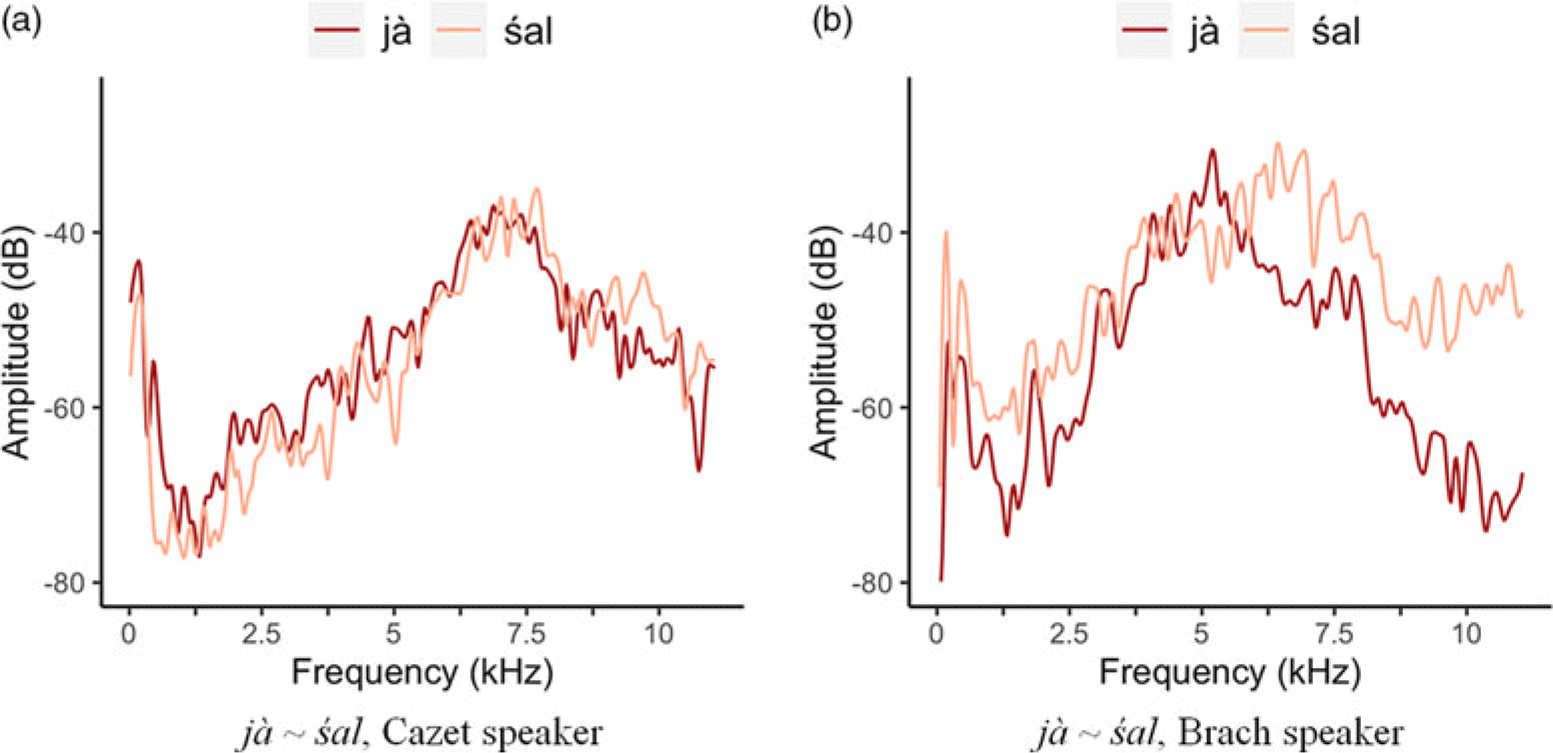
Voiced sibilants are relatively rare in Val di Fassa Ladin. Although the contrast between /z/ and /z̠/ is maintained by the Brach and Moenat speakers, this contrast is almost neutralized for the Cazet speaker, as illustrated by the comparison between the sibilants in Cazet [za] jà ‘already’ and [zal] śal ‘yellow’ in Figure 9(a). Figure 9(b) illustrates that the sibilants in the same words are pronounced distinctly as [z̠a] jà ‘already’ and /zal/ [zal] śal ‘yellow’ by a speaker of Brach.
The sibilants in jà and śal pronounced by the Cazet speaker and a Brach speaker. Panel (a) shows near-merger between the sibilants in jà and śal; panel (b) shows distinctive spectral shapes.

Final devoicing
Voiced obstruents become voiceless in word-final position. Some alternations are illustrated with word pairs from Moenat.

Note that intervocalic voiceless obstruents are permissible, for example, [ˈtʂɔfes̪] ciofes ‘lock (of hair), bunch (of flowers) pl’, [ˈɡrɔpes̪] gropes ‘knot pl’ (Moenat), confirming that the above alternations are the product of final devoicing rather than intervocalic voicing.
Nasal assimilation
Nasals are homorganic with a following consonant in coda clusters. In all three varieties, this results in [ŋ] before [k], as in [foŋk] fonch ‘mushroom’. Further examples of homorganic nasals are provided from Moenat.

Vowels
Monophthongs
The speakers of Brach and Cazet have seven phonemic vowels, /i u e o ɛ ɔ a/, consistent with Standard Fascian Ladin (Chiocchetti & Iori Reference Chiocchetti and Iori2002). The Moenat speaker has an eight-vowel inventory, with an additional mid-rounded vowel /ø/, consistent with previous research on Moenat (Heilmann Reference Heilmann1955). The vowel chart for each variety is illustrated below, followed by lists of (near-)minimal pairs. In the following charts, the relative position of the vowels is marked on the basis of the formant charts shown later in this section. As with the consonants, a separate list of words was formed for each variety due to cross-varietal differences.

Brach

Cazet

Moenat

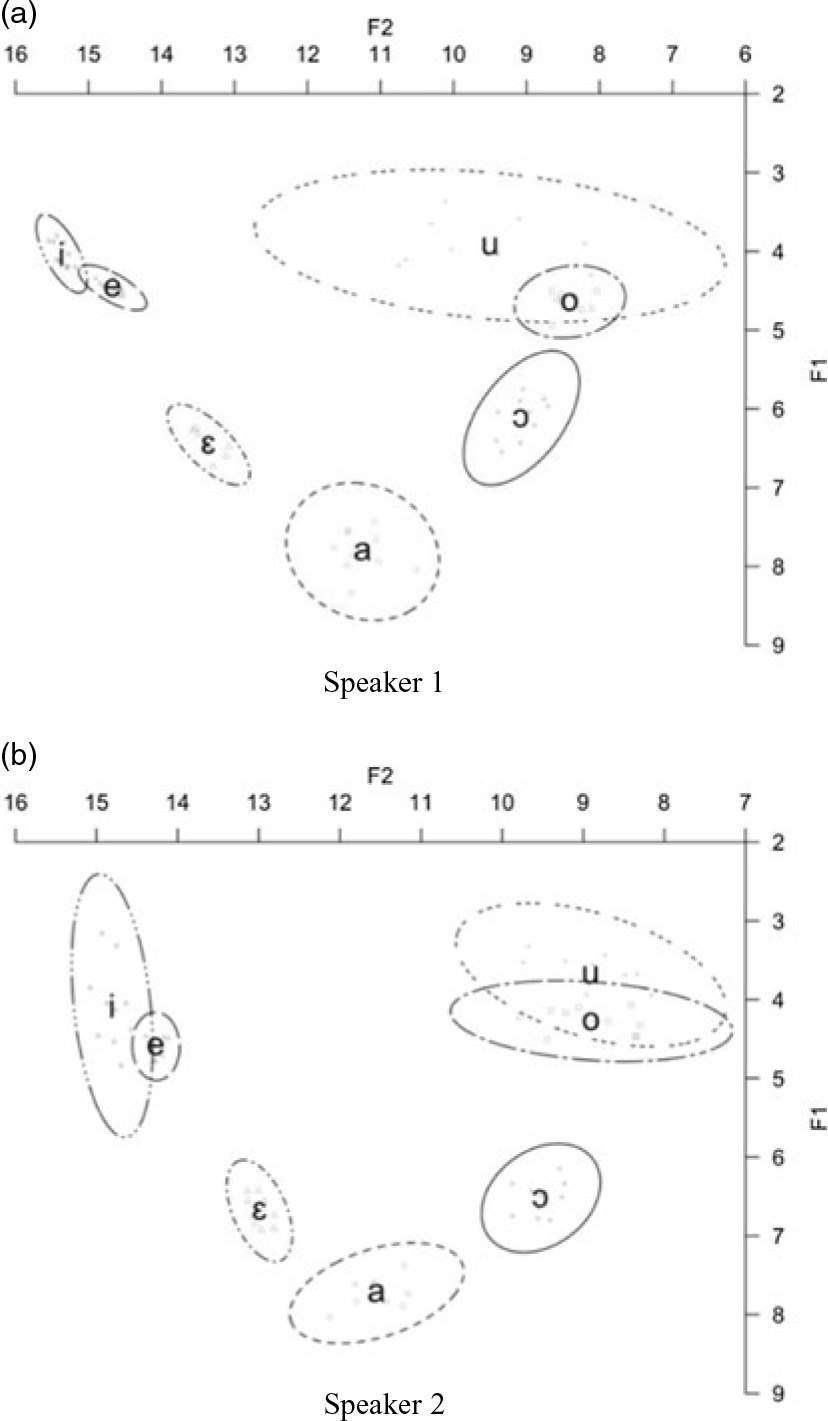
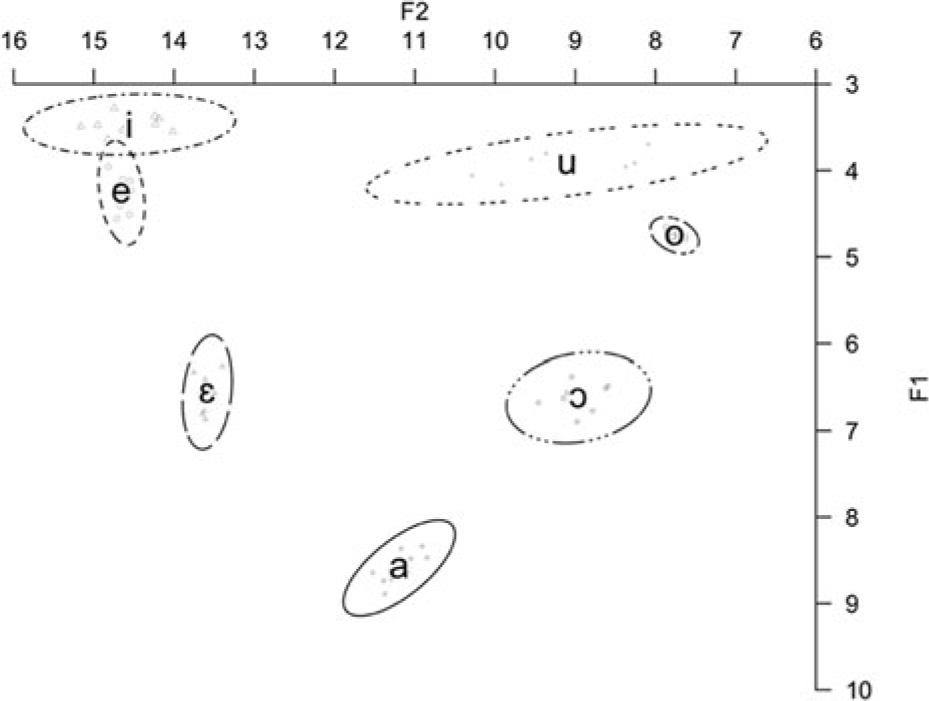
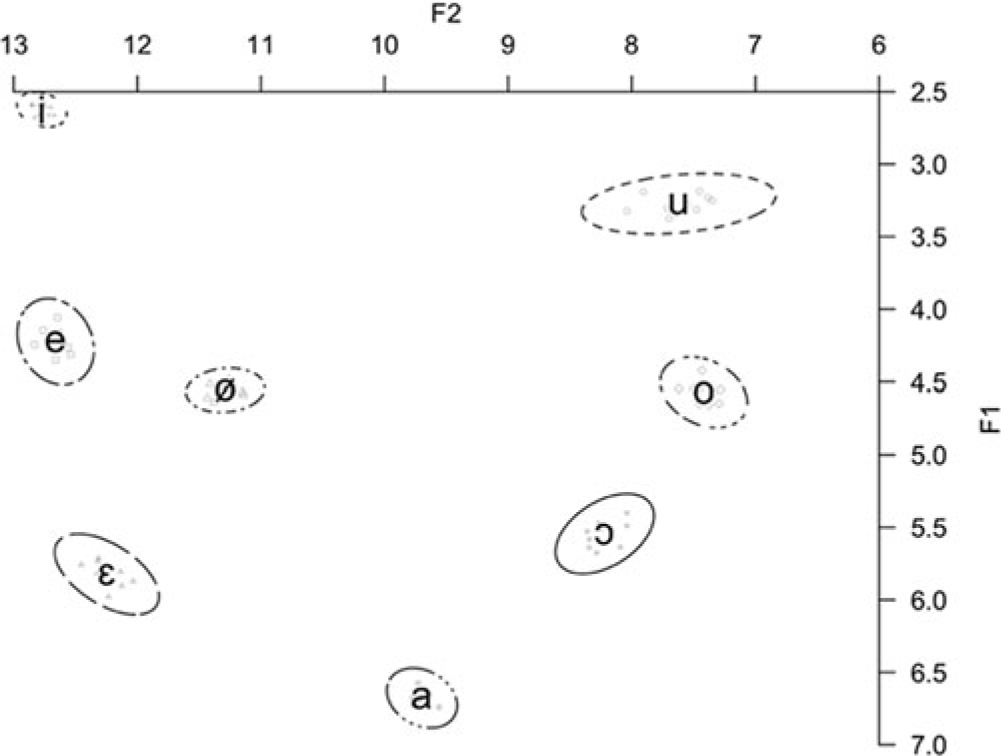
Though the vowel inventory across the speakers is broadly similar, some differences are found in vowel quality, which can be observed quantitatively. To illustrate differences in vowel quality, seven words selected from Brach and Cazet and eight from Moenat were repeated ten times by the speakers, and the formants (F1 and F2) were extracted and analyzed with the Praat script FormantPro (Xu & Gao Reference Xu and Gao2018). Outliers were excluded.Footnote 6 The formant charts in Figures 10–12 below were created with the phonR library in R (McCloy Reference McCloy2016). The words used for measurements are listed below.
Vowel formants in Bark scale for each of two female Brach speakers. The ellipsis indicates 95 $\% $ confidence level.


Vowel formants in Bark scale for a female Cazet speaker. The ellipsis indicates 95 $\% $ confidence level.


Vowel formants in Bark scale for a male Moenat speaker. The ellipsis indicates 95 $\% $ confidence level.


For the speakers of Brach, the data are reported in separate panels for each speaker in Figure 10. The acoustic variation for each vowel is illustrated by an ellipsis, with a confidence level of 95 $\% $ (likewise for the other speakers). For the Brach speakers, there is overlap between high vowels /i u/ and close-mid vowels /e o/, showing a tendency towards a merger. For the speaker of Cazet, close-mid vowels are close to the high vowels, similar to the Brach speakers, as shown in Figure 11. In contrast, the vowels in Moenat are more evenly distributed in the vowel space, as in Figure 12.
Diphthongs and triphthong
Our discussion of diphthongs and triphthongs focuses on Moenat. There are eight diphthongs in Moenat: /eu ɔu au ei oi øi ɛi ai/. The list below gives examples of the diphthongs, including a phrase with vowels and diphthongs only.

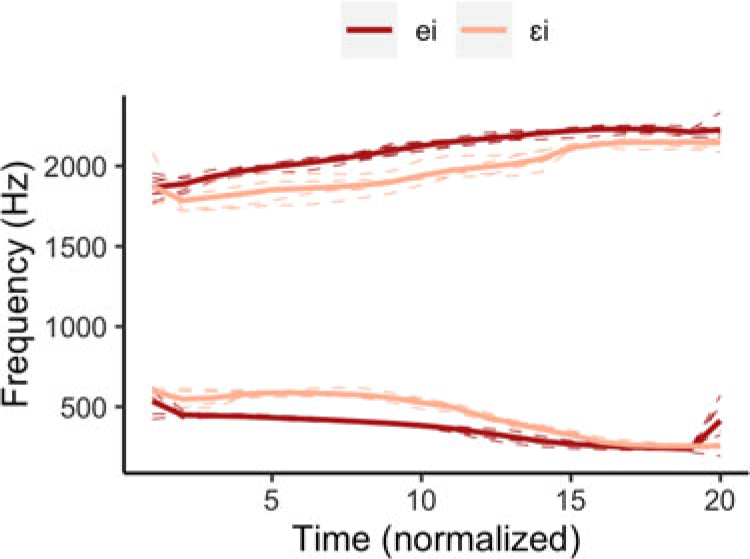
F1 and F2 trajectories of /ɛi/ and /ei/ in words produced by the Moenat speaker, extracted from multiple tokens of gei /d̠z̠ɛi/ (two tokens), ei /ɛi/ (two tokens), deit /deit/ (two tokens), deic /deit̠s̠/ (two tokens), and pei /pei/ (two tokens). The formants are time-normalized automatically by FormantPro (Xu & Gao Reference Xu and Gao2018). The dashed lines indicate the raw trajectories of each token; the solid lines are the average trajectories.

Though there are eight diphthongs in Moenat, /eu/, /ɔu/, and /ɛi/ are rare. In most cases, /ɔu/ in Brach and Cazet corresponds to /oi/ in Moenat, and it is not very common. Our speaker was aware of only two Moenat words in which /ɛi/ exists. Despite the rarity of /ɛi/, there is a clear difference in quality between /ei/ and /ɛi/ for our speaker of Moenat. Figure 13 shows time-normalized formant trajectories of /ei/ and /ɛi/ extracted from multiple Moenat words containing these diphthongs. In the graph below, /ɛi/ shows a stable portion of /ɛ/, in contrast to /ei/.
There are also several combinations that are usually called ‘rising diphthongs’, such as /je/, /jø/, /jɛ/, /ja/, /ju/, /jo/, and /jɔ/. However, in related languages such as Italian, these are usually viewed as a sequence of a glide and vowel, where the glide is analyzed as part of a complex onset (e.g. Krämer Reference Krämer2009). Therefore, we do not describe these combinations in detail.
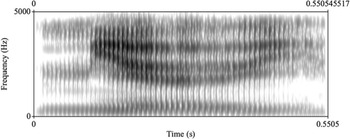
In Moenat, there is only one sequence of a glide followed by a diphthong, /jøi/, which is traditionally called a triphthong. Some examples are given below, followed by a spectrogram in Figure 14 illustrating the formant trajectories.

Spectrogram of miöi.

Word stress
In general, primary stress falls on one of the last three syllables in a word. Illustrations of stress in each of these positions are provided with words from Moenat.
Final stress

Penultimate stress

Antepenultimate stress

In the orthographic tradition that we follow here, the stressed syllable may be indicated by an accent mark. The accent mark is grave for all vowels except those pronounced as close-mid /e/ or /o/, for which the accent is acute. An accent is regularly marked in words ending in a vowel with stress on the final syllable and to indicate the pronunciation of words with vowel hiatus, such as /saˈuk/ saùch ‘cricket, grasshopper; elder tree’ (Brach), which is pronounced distinct from a diphthong /au/. An accent is often used in words ending in a vowel with stress on the antepenultimate syllable, and in words ending in a stem consonant with stress on the penultimate syllable, e.g. /ˈtsɛkol/ zécol ‘stick’ (Brach). It is also sometimes marked on a mid vowel in a penultimate stressed syllable regardless of the word shape to indicate whether the vowel is open-mid or close-mid. According to these conventions, when no accent mark is present in a polysyllabic word, stress is most often penultimate. Further research is needed to gain insight into Ladin foot structure and any categorical or gradient influences of word shape on the locus of stress assignment.Footnote 7
Transcriptions of the recorded passage ‘The North Wind and the Sun’
Brach
Orthographic transcription
Na dì l vent del nord e l soreie i costionaa su chi che l’era l più fort, canche l’é passà n viajador fat ite te n ciaut mantel. Chisc i se à metù a una che l prum che fossa stat bon de ge far tirar fòra so mantel l fossa stat conscidrà più fort che chel auter. Emben l vent del nord l’à sofià più fort che l podea, ma più fort che l sofiaa e più l viajador se fajea ite te so mantel; e tinultima l vent del nord à zedù. Te chel moment l soreie l’à tacà a sciudar, e sobito l viajador se à tirà fòra so mantel. E coscita l vent del nord à cognù ameter che l soreie l’era l più fort di doi.
Phonemic transcription
na di l̩ ven del nɔrd el soˈrɛie i kos̠tjoˈna su ki ke ˈlera l̩ pju fɔrt, ˈkanke le paˈsan vjazaˈdor fat ˈite ten t̠s̠au manˈtɛl. kis̠ i se a meˈtu a ˈuna kel prum ke ˈfosa s̠ta bon de d̠z̠e far tiˈrar ˈfɔra so manˈtɛl l̩ ˈfosa stat (…)Footnote 8 kons̠iˈdra pju fɔrt ke kel ˈauter. emˈben l̩ ven del nɔrd la ˈsof ia pju fɔr kel poˈdea, ma pju fɔrt kel sof iˈa e pjul vjazaˈdor se faˈze ˈite te so manˈtɛl; e tiˈnultima l̩ vent del nɔrd a tseˈdu. te kel moˈment l̩ soˈrɛie la taˈka a s̠uˈdar, e ˈsobito l̩ vjazaˈdor se a tiˈra ˈfora so manˈtɛl. e koˈs̠ita l̩ ven del nɔrd a koˈɲu aˈmeter kel soˈrɛie ˈlera l̩ pju fɔrt di doi.
Cazet
Orthographic transcription
Na dì l vent del nord e l soreie i costionèa su chi che l’era l più fɔrt, canche l’é passà n viajador fat ite te n ciaut mantel. Chisc i se à metù a una che l prum che fossa stat bon de ge fèr tirèr fòra l mantel l fossa stat conscidrà più fort che chel auter. Emben l vent del nord l’à sofià più fort che l podea, ma più fort l sofièa più l viajador se fajea ite te si mantel; e inultima l vent del nord à zedù. Cosci l soreie l’à tacà a sciudèr, e sobito l viajador se à tirà fòra si mantel. E coscita l vent del nord à cognù ameter che l soreie l’era l più fort di doi.
Phonemic transcription
na di l̩ vent del nɔrd el soˈrɛie i kɔs̠tioˈnea su ki ke lɛra l̩ pju fɔrt, ˈkanke le paˈsan vjazaˈdor fat ite ten ˈt̠s̠jaut manˈtɛl. kis i se a meˈtu a ˈuna kel prum ke ˈfosa s̠tat bon de d̠z̠e fɛr tirɛr ˈfɔra l̩ manˈtɛl l̩ ˈfosa s̠tat kons̠iˈdra (i) pju fɔrt ke kel ˈauter. emˈbɛn l̩ vent del nɔrd la ˈsof ia pju fɔrt ke l̩ poˈdea, ma pju fɔrt l̩ sɔˈf ia pju l̩ vjaˈzadɔr se faˈzɛ ite te si manˈtɛl, e inulˈtima (…) el ven del nɔrd a ˈtsedu. koˈs̠i el soˈrɛie la taˈka a ˈsudɛr, e soˈbito l̩ vjaˈzador se a tiˈra foˈra si manˈtɛl. e koˈs̠ita el vent del nɔrd (…) a koˈɳu aˈmeter kel soˈrɛie lɛra pju fɔrt di dɔi.
Moenat
Orthographic transcription
Na dì l vent del nord e l sol i costionava su chi che l’era l più fort, canche l’é passà n viajador fat int te n ciaut mantel. Chisc i se à metù a una che l prim che fosse stat bon de ge far tirar fòra so mantel l fosse stat conscidrà più fort che chel auter. Emben l vent del nord l’à sofià più fort che l podeva, ma più che l sofiava e più l viajador l se fajeva int te so mantel; e inultima l vent del nord l’à zedù. En te chela l sol l’à tacà a sćiaudar, e subit l viajador se à tirà fòra so mantel. E coscita l vent del nord l’à cognù ameter che l sol l’era l più fort dei doi.
Phonemic transcription
na di el ven del nɔrd el sol i kos̠tjoˈnava su ki ke lɛra l̩ pju fɔrt, ˈkanke le paˈsan vjaˈz̠ador fat int ten ˈt̠s̠jaut manˈtɛl. kis̠ i se a meˈtu a ˈuna kel prim ke ˈfose s̠tat bon de d̠z̠e far ˈtirar fɔˈra so manˈtɛl el ˈfose s̠tat kons̠iˈdra pju fɔrt ke ke ˈlauter. emˈbɛn el vent del nɔrd la soˈf ia pju fɔrt kel poˈdeva, ma pju kel soˈf iava e pjul vjaˈz̠ador el se faˈz̠eva int te sɔ manˈtɛl, e inulˈtima l̩ vent del nɔrd la seˈdu. en te ˈkela l̩ sol la taˈka a s̠t̠s̠auˈdar, e ˈsubit el vjaˈz̠ador se a tiˈra ˈfɔra sɔ manˈtɛl. e koˈs̠ita l̩ vent del nɔrd la koˈɳu aˈmeter kel sol ˈlɛra l̩ pju fɔrt dei doi.
Acknowledgments
We are grateful to the speakers of Ladin who participated in this research for their generous help with consultation and recording. We are also deeply grateful to Khalil Iskarous for leading the fieldtrip to Fassa Valley, as part of the course Endangered Language Documentation Ladin, and for his insights on investigating the Ladin language. We would like to thank the other scholars and students who participated in the course, and the Problems without Passports program of the USC Dornsife College of Letters, Arts and Sciences for supporting endangered languages documentation. We also thank Fabio Chiocchetti for providing The Ladin Cultural Institute as the venue for the project. Finally, we thank the JIPA editor Marija Tabain and two anonymous reviewers for their valuable suggestions and comments which greatly improved the manuscript.
Supplementary material
To view supplementary material for this article (including audio files to accompany the language examples), please visit https://doi.org/10.1017/S0025100320000262