Few issues of our political system worry American voters more than the role of money in elections. Most Americans feel, to quote Senator John McCain, that “… there’s too much money washing around the political arena today.”Footnote 1 Indeed, “nearly 90 percent of people in the United States say there is too much corporate money in politics” according to one recent poll.Footnote 2 Such concerns have brought with them calls for reform. Advocating for reform on the Senate floor, Senator Tom Harkin (D, IA) declared: “By limiting the influence of big money in politics, elections can be more about the voters and their voices, not big money donors and their deep pockets. We need to have a campaign finance structure that limits the influence of the special interests and restores confidence in our democracy.”Footnote 3 Sharing this sentiment, Governor Andrew Cuomo of New York told supporters that “nothing will restore the trust more than campaign finance [reform] … And until we have [it], nothing else will.”Footnote 4
Despite this longstanding concern, we still do not understand the likely effects of proposed reforms because we do not have clear estimates of the effects of money in elections.Footnote 5 The campaign finance literature, which largely predates recent calls for reform, has focused on the effects of spending within an individual race (e.g., Jacobson Reference Jacobson1978; Abramowitz Reference Abramowitz1988; Green and Krasno Reference Green and Krasno1988; Jacobson Reference Jacobson1990; Levitt Reference Levitt1994; Gerber Reference Gerber1998; Erikson and Palfrey Reference Erikson and Palfrey2000; Gerber Reference Gerber2004).Footnote 6 This focus—while relevant for many political questions—does not provide an accurate picture of the effects at the level of the whole legislature. Even with a well-identified estimate for the effects of campaign spending in a particular race or for a particular kind of candidate, adding these effects up across races or candidates would not provide an estimate of the systemic effects of campaign spending. Spending by one candidate might affect other races, for example. Spillovers prevent easy aggregation of individual effects and may bias individual effects themselves as well. Moreover, systemic shocks to the campaign finance landscape produce general equilibrium changes in behavior that individual-level estimates cannot account for. Predicting the effect of reforms that affect the entire legislature at once thus requires an estimate that applies to the whole legislature.
In this paper, I provide such an estimate by taking advantage of variation across US states over time in the implementation and removal of campaign contribution bans on corporations. Unlike variation in campaign spending in a given campaign, variation in these bans is plausibly exogenous in a “difference-in-differences” design that accounts for fixed differences across states and time. I show that implementing a ban on corporate contributions in a state legislature causes a large increase in the Democratic party’s share of the legislature. Using data on campaign contributions, I show that this effect is proportional to the effect these bans have on Democratic campaign receipts. Corporations donate more money to Republican candidates than to Democratic candidates; when they are banned from contributing, the Democratic share of all contributions in an electoral cycle subsequently increases. Combining these effects using an instrumental variables approach, I estimate that a 1 percentage-point increase in the Democratic party’s share of all campaign contributions in an electoral cycle causes an almost 0.5 percentage-point increase in its share of the legislature. There are large and important systemic effects of campaign spending.
The remainder of the paper is organized as follows. In the next section, I provide a background of the corporate campaign contribution bans I use in the paper and I explain the data and empirical strategy employed. In the third section, I apply this strategy to state legislative elections, 1950–2012. In the penultimate section, I use an instrumental variables strategy based on the corporate campaign contribution bans to back out the effect of campaign contributions on electoral outcomes. Finally, I conclude by discussing the implications of the findings.
BACKGROUND AND EMPIRICAL STRATEGY
Over the past century, the US states have experimented with a variety of regulations over which political actors can make direct contributions to state-level political campaigns. One popular version of such reforms targets corporations. In states and times where corporations are permitted to make direct contributions to state-level political campaigns, they are responsible for ~29 percent of all contributions.Footnote 7 They are thus a hugely important part of the campaign finance landscape.
A total of 36 states have banned corporations from making campaign contributions at one time or another, and 23 currently employ one.Footnote 8 Variation in these bans within states over time offers a unique opportunity to investigate their electoral effects. Conveniently, this variation occurs in both directions, with some states implementing bans whereas others remove them.
A review of recent history suggests that states put these bans in place because of voter anger against “corruption” and “special interests,” not because of explicitly partisan concerns. Rhode Island’s legislature passed its ban on corporate contributions in 1992 amidst an unprecedented run of ethics scandals on both sides of the aisle. A New York Times headline, for example, read “Rhode Island Scandals Ignite Revolt by Voters” (1992). In Alaska, where the state legislature passed a contribution ban in 1996 in anticipation of a ballot initiative to achieve the same goal, supporters expressed non-partisan reasons for supporting the policy. One advocate who collected signatures for the ballot initiative decried that “[t]he decisions of elected officials appear too often to be linked to campaign contributors [rather] than to the merits of the issues” (State of Alaska v. Alaska Civil Liberties Union).Footnote 9 The 2002 ban on corporate contributions in Colorado was similarly focused on special interests on both sides of the aisle. Colorado voters passed the constitutional amendment by ballot initiative with over 65 percent of the vote.Footnote 10 Colorado’s case is particularly clear-cut, as well, because leaders of both parties opposed the ban (Booth Reference Booth2002). Although information about the removal of corporate bans is harder to come by, they also seem likely to occur separate from the partisan considerations of legislators. The lifting of New Hampshire’s ban in 2000, for example, resulted from a court case rather than a political action.Footnote 11
These bans provide useful leverage on the effects of money in politics for two reasons. First, as I will document, they shift the partisan distribution of money; banning corporations from contributing to campaigns increases the Democratic party’s share of campaign receipts. Second, though states that implement these bans may differ from those that do not, a difference-in-differences design—in which changes over time in states that implement bans are compared with the same changes in control states that do not implement the bans—appears to account for such differences well. Placebo tests shows that “treated” states do not differ from “control” states in their partisan trends within the difference-in-differences framework. Even if politicians in some states had the will and ability to change corporate contribution rules strategically, these decisions do not appear to be linked to systematic trends in the partisan voting behavior of the state.
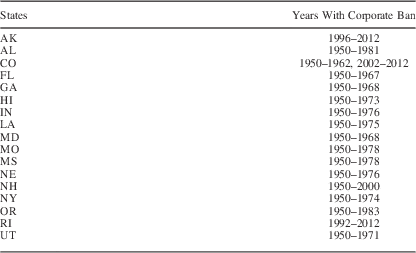
To carry out this empirical approach, I employ three main data sets. The information on the timing of corporate campaign contribution bans comes from the study by La Raja and Schaffner (Reference La Raja and Schaffner2014), who compile the data set by matching laws collected by the National Conference of State Legislatures (NCSL) to historical records. Though this data set begins well before 1950 (and indeed many states passed or lifted bans before this time), I only use information from 1950 to 2012 in order to match bans to the data on legislative control. Table 1 lists the states that implement or remove corporate contribution bans within the period 1950–2012 along with the year range for which the ban was active. The table does not list states that had or did not have a ban for the entire time period. These latter states are used in the analysis to provide counterfactual trends but do not directly contribute to the estimated effect of bans, which will rely on within-state changes in ban status.
States that Implement or Remove Corporate Contribution Bans Within the Sample Timeframe
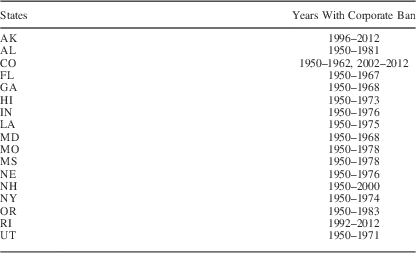
Source: La Raja and Schaffner (Reference La Raja and Schaffner2014).
Note: year ranges indicate the range of years within the data set’s timeframe, 1950–2012, that the state had a corporate ban. A beginning year of 1950 indicates beginning of the sample, not necessarily the first year the ban was put in place. Table does not include states that always have or do not have corporate bans during this time period.
The data set also provides information on the timing of union contribution bans. I do not focus the analysis on these bans for two reasons. First, unions donate far less money than corporations in state legislatures. For the years for which I can estimate these totals (see explanation below), corporations contribute roughly 4 million dollars per state per election cycle, on average, whereas unions contribute just over 1 million dollars on average. Second, there are almost no cases in which a state implements a union contribution ban without either already having, or also implementing, a corporate ban.Footnote 12 There are, however, many states with corporate bans and not union bans. Thus, while I use union bans as a control variable, I do not discuss effects for union bans. Finally, the data set also contains information on the timing of union and corporate expenditure bans—the focus of La Raja and Schaffner (Reference La Raja and Schaffner2014), a study on the possible consequences of the Citizen’s United ruling, the Supreme Court’s decision that made these bans, but not contribution bans, unconstitutional. As these latter two reforms do not affect contribution activity directly, they do not have any “first-stage” effect on Democratic campaign receipts, but they might have their own effects on electoral outcomes. At several points I thus use them as pre-treatment control variables for robustness and precision, but I do not investigate their effects in depth (for this, see La Raja and Schaffner Reference La Raja and Schaffner2014).
Information on the partisan control of state legislatures, 1950–2010, comes from Dubin (Reference Dubin2007), who compiled the information from primary sources, as coded and extended to subsequent years through 2010 by Folke, Hirano and Snyder (Reference Folke, Hirano and Snyder2011). The data set provides the numbers of sitting Democrats and Republicans in each state legislative chamber in each year. I extend this data set to 2012 using information available on the NCSL website.
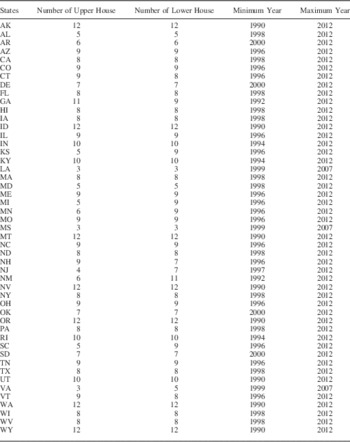
Finally, for information on political contributions I use data from the National Institute on Money in State Politics (http://www.followthemoney.org). The website provides text files containing itemized donations for state political campaigns starting in 1990, although the exact date ranges differ by state owing to data availability. By processing the text files in an automated program, I condense the information down to candidate totals. Summing these candidate totals, I calculate the total amount of money received by the Democratic and Republican parties, respectively, in each state and chamber in each year. This makes it possible to calculate the share of total donations, across all races, received by the Democratic party. For analyses of the effects of bans on electoral outcomes, I use the larger data set that runs from 1950 to 2012. When investigating the effects of money, I use the fully merged data set, which thus runs from 1990 to 2012. For this fully merged data set, I list the exact states and years present in Table A3.
THE ELECTORAL EFFECTS OF CAMPAIGN CONTRIBUTION BANS
In the first analysis, I consider the electoral effects of corporate campaign contribution bans using the full year range of the electoral data: 1950–2012. Within this timeframe, I show that the implementation of these bans causes a large increase in the Democratic seat share of the legislature. As the bans affect corporations, which prefer to donate to Republicans on average,Footnote 13 we can infer from these “reduced-form” results that campaign contributions (and thus, spending) are likely to affect electoral outcomes. Subsequent to these results, we will consider the small year range (1990–2012) for which campaign finance data is also available. In this smaller data set, we can confirm that there is in fact a “first-stage” effect of these bans on the Democratic share of campaign contributions. Taken together, the two analyses therefore establish the systemic effect campaign spending has in state legislatures.
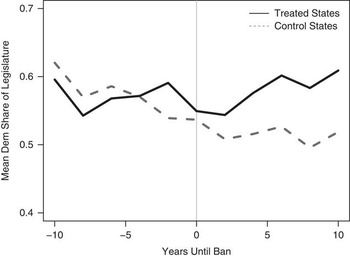
Before presenting formal results, Figure 1 offers a visual analysis. The plot compares the average Democratic seat share in state senates that implement corporate campaign contribution bans over time to the set of states that never implement such a ban, over the same relative time period. As the plot shows, these two sets of states look quite similar before the treated states put their bans in place; after the bans are in place, the treated states display a marked increase in average Democratic seat share, whereas no such change (and in fact, a decrease) is seen in the control states. The plot thus suggests that corporate bans have a positive effect on the Democratic party’s fortunes.
Effect of corporate contribution ban on Democratic seat share (state senates)

Using the full electoral data, I estimate a reduced-form equation of the form:
 $$Dem\,Seat\,Pct_{{ict}} =\beta _{1} \,Corporate\,Ban_{{ict}} {\plus}\gamma _{{ic}} {\plus}\delta _{t} {\plus}\epsilon _{{ict}} ,$$
where Dem Seat Pct ict measures the Democratic share of the legislature in percentage points (0–100) in state i, chamber c∈{lower, upper} in year t. The variable Corporate Ban is a dummy variable indicating the presence of a corporate campaign contribution ban. Finally, γ ic stands in for state-chamber fixed effects,Footnote 14 and δ t represents year fixed effects. The equation therefore represents a difference-in-differences design in which changes over time in the Democratic share of the legislature in “treated” states—those that implement or remove a ban—are compared with changes over the same time periods in the “control” states that do not implement or remove a ban. The quantity of interest is β 1, the coefficient on the treatment variable.
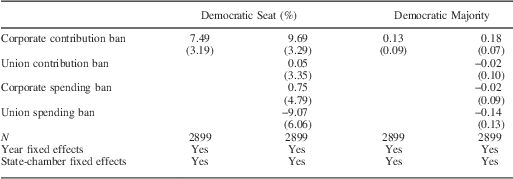
In the first column of Table 2, I estimate this equation using OLS. In this main specification, corporate campaign contribution bans are estimated to cause, on average, an increase of 7.49 percentage points in the Democratic share of the legislature. In the second column, I re-estimate this equation by adding controls for the other three types of campaign finance reform recorded in the study by La Raja and Schaffner (Reference La Raja and Schaffner2014). As the results show, controlling for these pre-treatment variables increases the estimated effect. Finally, in the third and fourth columns I replicate these specifications using as the outcome variable a dummy indicator for a Democratic majority in the legislature. A corporate contribution ban is estimated to cause a 13–18 percentage-point increase in the probability that the Democrats win a majority in the legislature.
Corporate Contribution Bans and Democratic Seat Share, US State Legislatures (1950–2012)
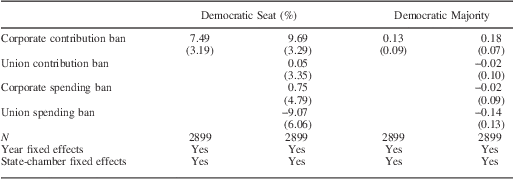
Note: corporate contribution bans are shown to cause a large increase in Democratic electoral fortunes. Robust standard errors clustered by state-chamber in parentheses.
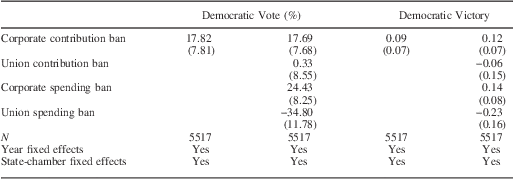
To investigate the robustness of this finding, I also applied the same econometric strategy to other statewide offices affected by state-level campaign finance reform—most notably gubernatorial races, but also races for offices like secretary of state, treasurer, etc. Table A4 presents the results as well as further discussion. I again find large, positive effects of corporate bans on Democratic electoral fortunes.
Threats to Empirical Strategy Considered
Overall, implementing a ban on corporate campaign contributions appears highly beneficial to the Democratic party. This suggests that, at the level of the legislature, campaign contributions translate into electoral success. Before moving on, however, it is important to validate the key identifying assumption of the difference-in-differences design. Although the design accounts for any time-invariant differences between states, as well as any common shocks across time, it will not provide valid causal estimates if the states that implement or remove corporate bans are trending in a different partisan direction than other states. For example, if states implement corporate bans at a time when they are becoming more Democratic at a different rate than other states, the results would be biased. This could occur if Democratic legislators are able to pass corporate bans strategically during times when they are gaining power in the legislature, or likewise if Republicans are able to remove bans when they are gaining power. On the other hand, even if Democrats or Republicans strategically pass or remove bans because they are powerful in a given state in general, the results will be valid in the difference-in-differences design; the strategic behavior would have to depend on trends in partisanship rather than overall levels to bias the results. Although the historical review offered in the “Background and Empirical Strategy” section provided some anecdotal evidence that such trending behavior is not present, we can now consider more rigorous statistical evidence for the validity of the design.
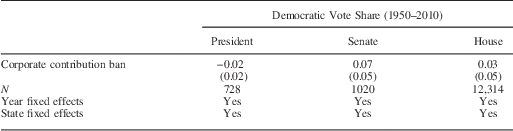
To ensure that the results are not driven by remaining unobserved differences between treated and control states—even controlling for state and year effects—I re-estimate Equation 1 using three placebo outcome variables. These variables are as follows: the Democratic presidential vote share in state i at time t; the Democratic senatorial vote share in state i at time t; and the average Democratic US House vote share in state i at time t.Footnote 15 The logic of all three tests is the same; because these bans only affect contributions to state-level races and not federal races, they should have no effect on these other outcomes if the design is valid.Footnote 16 If the design is invalid, however, unobserved partisan differences between treated and control states are likely to show up in these tests. As Table 3 shows, we cannot reject the null of no difference in any of the three tests, and all three differences are close to 0 (and in conflicting directions). It does not appear that treated states are trending differently than control states in their partisanship.
Placebo Tests
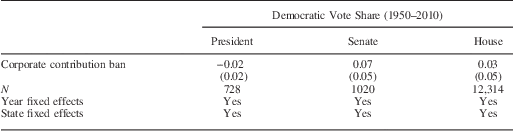
Note: corporate contribution bans, which only affect state legislatures, do not have similar electoral effects on national political outcomes.
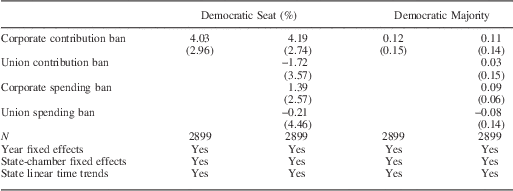
In Table A1, I investigate the validity of the design another way. I relax the so-called “parallel trends” assumption by including linear time trends for each state. Although adding these extra variables reduces precision, corporate bans are still estimated to cause marked increases in the Democratic seat share. In the baseline specification, bans are estimated to cause a 4.03 percentage point increase in the Democratic seat share and a 0.12 point increase in the probability of a Democratic majority. Based on these tests, the difference-in-differences design appears plausible. Though the reduced magnitude of these alternative estimates does suggest that the parallel trends assumption may not be perfect, the fact that the results continue to be positive and meaningful in size is reassuring.
THE EFFECT OF CAMPAIGN CONTRIBUTIONS ON ELECTORAL OUTCOMES
The previous section demonstrates that corporate contribution bans cause a large increase in the Democratic share of the legislature, and thereby implies but does not establish directly an important role for campaign finance at the level of the legislature. In this section, I measure the “first-stage” effect of bans on contribution behavior using data on campaign contributions in state legislatures in order to link the electoral effects of these bans to their effects on money in elections.
Unlike the previous analysis, where all data from 1950 to 2012 was available, the merged data set of electoral outcomes and financial outcomes only runs from 1990 to 2012. This has several methodological consequences, which are not lightly dismissed. First, this truncated time period features much less within-state variation in corporate bans. This makes inference difficult because the difference-in-differences design uses only within-state variation in the treatment variable. Only three states—New Hampshire, Colorado, and Alaska—implement or remove a corporate ban in this time period. Further complicating matters, one of these states (Alaska) implements a union contribution ban at the same time as the corporate ban. The difference-in-differences estimation controlling for this union ban is thus driven by two states, New Hampshire and Colorado, though all states are still included in the analysis and contribute to the calculation of counterfactuals based on the year fixed effects. By itself, this analysis therefore cannot be decisive. The small amount of variation in bans in this time period makes the results sensitive to a small number of observations and prevents accurately estimated standard errors (e.g., Imbens and Kolesar Reference Imbens and Kolesar2012).Footnote 17 Fortunately, however, these results do not stand alone. The strong reduced-form results presented in the previous section bolster confidence in the results presented here on the smaller data set.
Formally, I begin by estimating equations of the form:
 $$\eqalignno{ Y_{{ict}} = \,\beta _{1} \,Corporate\,Ban_{{ict}} {\plus}\beta _{2} \,Union\,Ban_{{ict}} \cr {\plus} \beta _{3} \,Corporate\,Ban_{{ict}} {\times}Union\,Ban_{{ict}} {\plus}\gamma _{{ic}} {\plus}\delta _{t} {\plus}\epsilon _{{ict}} , $$
where all variables are defined as before and the variable Y stands in for either Dem Seat Share ict, as before, or for Dem Money Share ict, the share (in percentage points) of all campaign contributions that flow to the Democratic party in state i, chamber c∈{lower, upper} in year t.
The added variable Union Ban is a dummy indicating the presence of a union contribution ban. I include this variable as well as its interaction with the corporate ban dummy in order to address the co-instances of the two bans discussed in the previous paragraph. Omitting these two terms has two consequences as follows: first, the effect of the corporate ban is confounded with the effect of the union ban as both occur at the same time in one state; and second, results become highly imprecise because corporate bans and union bans work in opposite directions, with union bans plausibly shifting money toward the Republican party.Footnote 18
The quantity of interest is again β 1, which now measures the effect of a corporate contribution ban in the absence of a union contribution ban. Owing to the high degree of multicollinearity and the fact that union contribution bans almost never occur without corporate contribution bans, I do not discuss the coefficient estimates on the interaction term or the main effect on the union ban. These are available in Table A2.
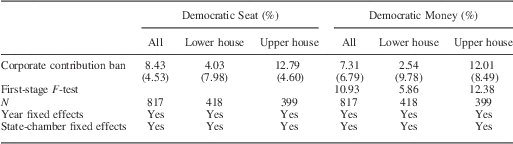
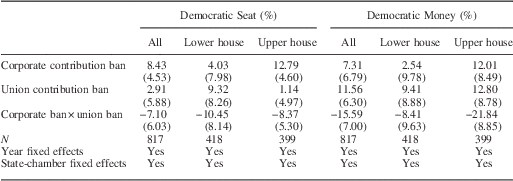
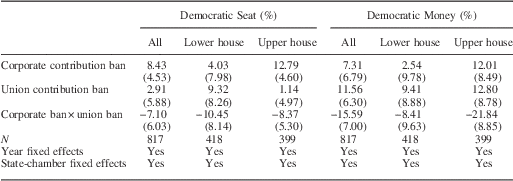
I begin by replicating the reduced-form result from the previous section on this truncated data set and modified specification. The first three columns of Table 4 estimate Equation 2 where the outcome is Dem Seat Share like in the previous section. In the first column I include all chambers (lower and upper). Although noisy, the estimated effect (8.43) is highly similar to the effect from the previous section using all of the data (7.49).
Reduced-Form and First-Stage Effects of Corporate Contribution Bans (1990–2012)
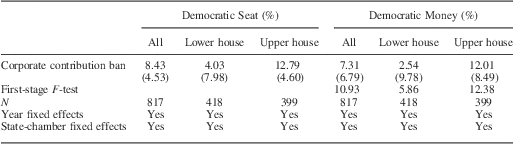
Note: corporate bans are seen to cause an increase in the Democratic share of the legislature and the Democratic share of all campaign contributions. These effects are both much larger in state upper houses. All regressions include controls as in Equation 2. Robust standard errors clustered by state-chamber in parentheses.
In the next two columns, I separate this effect by lower and upper chambers, for reasons that will become clear shortly. The effect appears to be much larger in upper houses than in lower houses. Though we cannot reject the null that the effects are the same in an interactive specification, the magnitude of the difference is massive.
The final three columns of the table examine the “first-stage” effect of corporate contribution bans on the distribution of campaign contributions across the parties. Overall, as the fourth column shows, a corporate campaign contribution ban is estimated to cause a 7.3 percentage point increase in the share of contributions flowing to the Democratic party. As the final two columns show, this effect, too, is much larger in upper houses than in lower houses (although again we cannot reject the null that they are the same in an interactive specification). The table also reports the value of the F-test for the instruments—the corporate ban, the union ban, and their interaction. Following the F>10 rule of thumb, we see that there is a strong first stage overall and in upper houses, but not for lower houses.
Though it is worth restating the inferential concerns that stem from this truncated data set, the pattern of results in conjunction with the large and precise reduced-form estimates from the previous section point to a systemic effect of campaign contributions. The variation in this effect across lower and upper chambers further reinforces this conclusion.Footnote 19 The crucial assumption in attributing the effect of corporate contribution bans to the role of money in elections is the so-called “exclusion restriction,” that is, the assumption that these bans only affect electoral outcomes through their effect on the distribution of campaign contributions. The fact that bans appear to have little or no effect on electoral outcomes in lower chambers, the very same place where they appear to have little or no effect on the distribution of money, provides empirical support for the exclusion restriction’s validity.
The lack of a first-stage effect in lower houses also highlights a difficulty in inferring effects of campaign contributions or spending from “reduced-form” estimates of campaign finance. When one observes a null effect of reforms on electoral outcomes (e.g., La Raja and Schaffner Reference La Raja and Schaffner2014), one must still investigate to determine whether the null effect is due to money playing no role in elections or due to there being no first-stage effect, that is, no effect of the reform itself on the distribution of money.
Why is there no first-stage effect in state lower houses? Answering this question is beyond the scope of the present study—concerning as it does the specific workings of these bans rather than their observable effects—but we can speculate. Corporations, like other access-seeking donors, are likely to channel contributions to candidates for whom their value is highest (e.g., Ansolabehere and Snyder Reference Ansolabehere and Snyder1998). By virtue of the smaller chamber size and less frequent elections (in many states), each state senator possesses more power for longer than does each state representative. Corporations are thus likely to contribute more money, both in total and as a share of all contributions, to upper-house races.Footnote 20 Verifying this pattern in state legislatures directly is not possible because the state contribution data does not explicitly identify corporate donors, but a variety of stricter or looser classifications of donors as corporations suggests it is present, taking advantage of the fact that the data does identify individual donors versus group donors. For example, defining a corporate donor to be any non-individual donor not in the Labor, Government, Ideology, Party, Labor, or Lawyers categories (as defined from disclosure requirements by FollowTheMoney), the share of all money contributed by “corporations” in an electoral cycle is found to be 2.3 percentage points higher (p<0.005) in upper-house races than in lower-house races before a corporate ban is put in place.Footnote 21
Finally, having presented these preliminary results, we can combine them to estimate a causal effect of contributions on legislative electoral outcomes. Like any instrumental variables analysis, this causal effect will be specific to a “local” population: the set of states that “comply” with the corporate ban (e.g., Angrist, Imbens and Rubin Reference Angrist, Imbens and Rubin1996). The results therefore do not speak directly to, for example, states that have never had corporate bans, but they will be suggestive.
Specifically, I use two-stage least squares to estimate the system of equations:
 $$\eqalignno{ Dem\,Money\,Share_{{ict}} =\pi _{1} \,Corporate\,Ban_{{ict}} {\plus}\pi _{2} \,Union\,Ban_{{ict}} \cr \quad\qquad\qquad\qquad\qquad{\plus} \pi _{3} \,Corporate\,Ban_{{ict}} {\times}Union\,Ban_{{ict}} {\plus}\gamma _{{ic}} {\plus}\delta _{t} {\plus}\eta _{{ict}} \cr Dem\,Seat\,Share_{{ict}} =\alpha _{1} \,Dem\,Money\,Share_{{ict}} {\plus}\gamma _{{ic}} {\plus}\delta _{t} {\plus}\nu _{{ict}} . $$
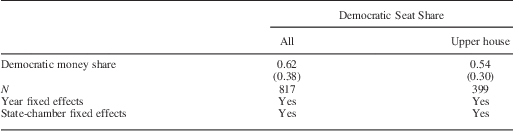
The results are presented in Table 5. In the first column, I again include all observations; in the second, I restrict the sample to only upper chambers. I do not report a specification for lower chambers by themselves because, as the previous table showed, there is no first-stage effect for lower chambers—a violation of one of the necessary conditions for instrumental variables.
Two-Stage Least Squares Estimates for Systemic Effects of Campaign Spending
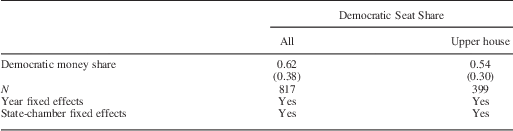
Note: regression specifications as in Equation 3. Robust standard errors clustered by state-chamber in parentheses. Lower house omitted owing to lack of first-stage effect.
As the results show, a 1 percentage-point increase in the Democratic share of all contributions in an election cycle induced by campaign contribution bans is estimated to cause roughly a 0.54–0.62 percentage point increase in the Democratic share of the legislature. For example, a 10 percentage-point increase in the Democratic share of all contributions would be estimated to cause more than (approximately) a 5 percentage-point increase in the Democratic party’s share of the legislature.
For these estimates to be credible, there must be no other effects of contribution bans on electoral outcomes. As I discussed above, the lack of an electoral effect in lower-house races, where there is no change in the distribution of money, makes the exclusion restriction plausible empirically. Any violation of this assumption would have to involve direct effects stronger in upper houses than in lower houses. There are certainly ways in which bans could have general equilibrium effects on the strategies of interest groups, candidates, and other political actors. Perhaps, these could be more salient in upper-house races; even if so, though, one might expect these to bias the results toward 0. For example, if conservative groups react to the new friction introduced by corporate bans by ramping up their efforts, this should act to cancel out the effects rather than make them stronger. Between the empirical validation of the exclusion restriction and these theoretical reasons to expect any bias from its violation to be in the opposite direction, the instrumental variables strategy seems sound. That being said, we must always keep in mind that the exclusion restriction is, by nature, untestable. The IV results in the paper must thus be regarded with due caution.
At the level of the legislature, campaign contributions exert a systemic effect on electoral outcomes. The results in this section must be regarded carefully owing to the inferential obstacles discussed above that, among other things, prevent precise estimation. Nevertheless, in conjunction with the documented effects of corporate campaign contribution bans in the previous section, there is good evidence for a causal link between the share of contributions a party secures in an electoral cycle and its electoral performance.
DISCUSSION AND CONCLUSION
There has been a tremendous debate about the role of money in US elections. Although many political practitioners and observers call for campaign finance reform, many academics point to studies that suggest the role of money in elections is limited. However, these reforms affect many elections at once. Past estimates of the effects of money, focused on individual races, cannot predict the effects of such reforms, nor can they directly speak to systemic effects of campaign spending that occur at an aggregated level. What is more, the highly strategic behavior of candidates and donors creates fundamental biases in observational studies of individual election contributions and spending, leading to a wide variety of positive, negative, or null findings in the previous literature.
In this paper, I have focused instead on estimating the systemic effects of campaign spending—that is, the effect of varying campaign contributions at the level of the legislature. Estimating this effect is both more relevant for discussions of possible reforms and of policy outcomes, and more tractable owing to the availability of exogenous variation from campaign finance reforms within states over time. Following this strategy, I have established that money matters for electoral outcomes. Giving more money to one party than the other increases that party’s share of the legislature. Campaign contributions thus have the power to help determine who controls the legislature.
Leaving aside past null effects in the literature estimating the impact of spending, this positive effect of spending on elections should be unsurprising, given two well-known empirical facts about elections. First, candidates devote an enormous amount of effort to fundraising.Footnote 22 Although it is possible that this behavior is the result of a systematic misperception among political operatives, a more likely explanation is that candidates and campaigners believe, correctly, that campaign funds help them improve their electoral fortunes.
The second fact reinforces the views of those participating in political campaigns. A large literature in political science documents directly how “Get Out the Vote” (GOTV) efforts can increase turnout (e.g., Gerber and Green Reference Gerber and Green2000; Gerber, Green and Larimer Reference Gerber, Green and Larimer2008; Green and Gerber Reference Green and Gerber2008). By spending money on turnout efforts among targeted populations, campaigns can convert money into votes. Advertising, too, can be used for similar purposes (Gerber et al. Reference Gerber, Gimpel, Green and Shaw2011).
In addition to helping explain the large, positive effects found in this paper, these literatures also structure our expectations about how the estimates presented here, on state legislatures, would pertain to our federal legislatures. Many effective GOTV and advertising efforts are directed at federal elections, and candidates for federal elections clearly think money is important for their electoral prospects. Thus, we have good reasons to suspect that the effects estimated here speak to more than just state legislative races.
The role of money in elections documented in this paper has other implications, too. “Access-oriented” donors—those who give money for strategic rather than ideological reasons—do not contribute for no reason. Indeed, their contribution patterns reveal highly strategic motivations (Snyder Reference Snyder1992; Fouirnaies and Hall Reference Fouirnaies and Hall2014; Grimmer and Powell Reference Grimmer and Powell2014). Recent evidence documents some of the value these groups receive in exchange for their contributions: donors who disclose their donation behavior when requesting meetings with members of Congress are more likely to have their requests granted and are more likely to have these meetings with higher level officials (Kalla and Broockman Reference Kalla and Broockman2014).
As contributions matter for electoral outcomes, access-oriented groups insulate incumbents by contributing to them in exchange for office. The value that incumbents can offer to interest groups, and the money they receive in exchange for this value, are thus likely to be an important part of the incumbency advantage we observe in American politics also (Fouirnaies and Hall Reference Fouirnaies and Hall2014).
Concerns that candidates can translate money into votes, and the distorting effects that this relationship could have for political representation, have led to numerous calls for reform. This paper has contributed to this issue by documenting the actual effect of money in elections in a way that is both unbiased and directly relevant for issues of reform. Reforms affect entire legislatures at once. To understand the possible effects of reforms, we need to measure the systemic effects of campaign spending. As this paper has demonstrated, these systemic effects are large.
Appendix A
In Table A1, I relax the “parallel trends” assumption of the difference-in-differences design by including state-specific linear time trends. Although we continue to see a large, positive effect of corporate bans on the Democratic seat share and probability of majority party status, the coefficients do shrink in magnitude. This may suggest that the “parallel trends” assumption is not perfectly accurate, or it may be the result of noise in the estimates. The estimates are less precise owing to the loss of degrees of freedom, but the general similarity of the point estimates suggest that the reported results in the paper are reasonable.
Corporate Contribution Bans and Democratic Seat Share, US State Legislatures (1950–2012)
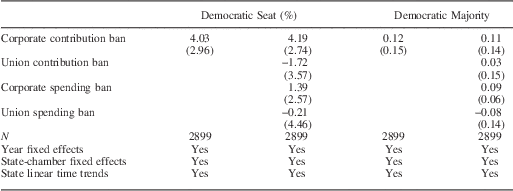
Table A2 offers more details on the estimated coefficients for Table 4 in the paper. However, the coefficient on union contribution ban is essentially meaningless owing to the almost total lack of independent variation in union bans. Corporate bans appear to lose their “effect” when combined with union bans (see the negative interaction terms in the third row). This is very likely because union bans should be expected to hurt the Democratic party, as unions contribute almost exclusively to the Democratic party, whereas contributions act in the opposite direction.
Reduced-Form and First-Stage Effects of Corporate Contribution Bans (1990–2012)
Effects on Other Statewide Elections
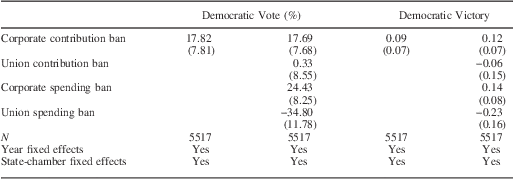
Here I replicate the same analysis on vote outcomes from the paper but using other statewide electoral outcomes. I use the replication data from Eggers et al. (Reference Eggers, Fowler, Hainmueller, Hall and Snyder2015), which includes electoral outcomes for the following statewide US offices: Agriculture, Attorney General, Auditor, Clerk, Comptroller, Education, Finance, Governor, Inspector, Insurance Commissioner, Labor, Lands, Lt. Governor, Mines, Printer, Reporter, Secretary of State, Surveyor, and Treasurer.
As Table A4 shows, I find a very large effect of corporate campaign contribution bans on Democratic vote share in these elections. However, it is worth noting that the effect is much smaller, though still positive, when I estimate it only for gubernatorial races ( $$\hat{\beta }=4.4$$
, t=0.54). The large effects might therefore indicate the increased importance of corporate contributions in low salience elections—a possibility worth further investigation in future work.
Observations in Merged Data Set with Contributions, by State and Chamber

Corporate Contribution Bans and Democratic Electoral Fortunes, US Statewide Elections (1950–2012)