I. Introduction
Much is published about the stochastic nature of the ratings that critics and judges assign to wines (see, e.g., Hodgson (Reference Hodgson2008a, Reference Hodgson2008b); Ashton (Reference Ashton2012, Reference Ashton2013); Bodington (Reference Bodington2012, Reference Bodington2017).) Those results show that a rating is one draw from a latent distribution, that a rating observed is one instance of in some cases many possible instances. Those results also show that the ratings assigned by a panel of judges to wine are not IID; the ratings may be independent (I) but they are not identically distributed (ID). Some judges are more consistent than others.
Wine competition sponsors describe their judges as experts; see, for example, the descriptions of judges by the “top ten” competitions in Beverage Trade Network (2019). The International Organisation of Wine and Vine (OIV, 2015) suggests but does not require qualifying and monitoring examinations for judges. Hodgson and Cao (Reference Hodgson and Cao2014) proposed a test using blind replicates. A few European competitions require that judges pass an OIV ISO 4120 (9) triangle test, and the California State Fair (CSF) Commercial Wine Competition requires that some judges take a class and examination offered by UC Davis.Footnote 1, Footnote 2, Footnote 3
Difficulties with the descriptions, suggestions, and testing summarized previously are that there is no precise definition of expertise and that test conditions do not match conditions in practice. Expertise could involve wine and winemaking knowledge but not tasting skills. An ability to differentiate between a few wines, as in a triangle test and the UC Davis exam, is not the same as assigning quality ratings, nor is it the same as assessing sometimes more than 50 wines a day for two or three days in a row. A solution to those problems is proposed and tested in this short article.
Section II presents a description of the 2,811 wines judged at the 2019 CSF. In Section III, that large sample is employed to test using correlations to rate judges. Those judge-specific ratings show that there is statistically significant concordance among most judges, but the ratings also identify specific judges whose purported tasting expertise may need reconsideration. Section IV concludes.
II. Commercial Competition Data
The CFS conducts an annual Commercial Wine Competition. Vintners submit wines to the CSF, and each wine is assessed and rated by a panel of judges. For 2019, 2,811 wines were submitted. Fifty-four judges were assigned to 18 panels, each panel had three judges, and each panel assessed between approximately 120 and 150 wines. Each judge assigned a rating of Gold+, Gold, Gold–, Silver, Bronze, or No Award to each wine assessed. That set of ratings is equivalent to assigning, with replacement, a rank from among #1 (Gold+) through #6 (No Award) to each wine.
The author obtained the judge-specific ratings from the CSF pursuant to a California Public Records Act (PRA) request.Footnote 4
III. Rate the Raters
The objective of this research is to propose and test a tool that wine competition organizers and participants can employ to identify judges, or structural aspects of a competition's tasting protocol, that harm the identification of a statistically robust consensus among judges. Likewise, that tool can be employed to identify judges who tend to agree on ratings and are thus the foundation of an aggregate consensus rating.
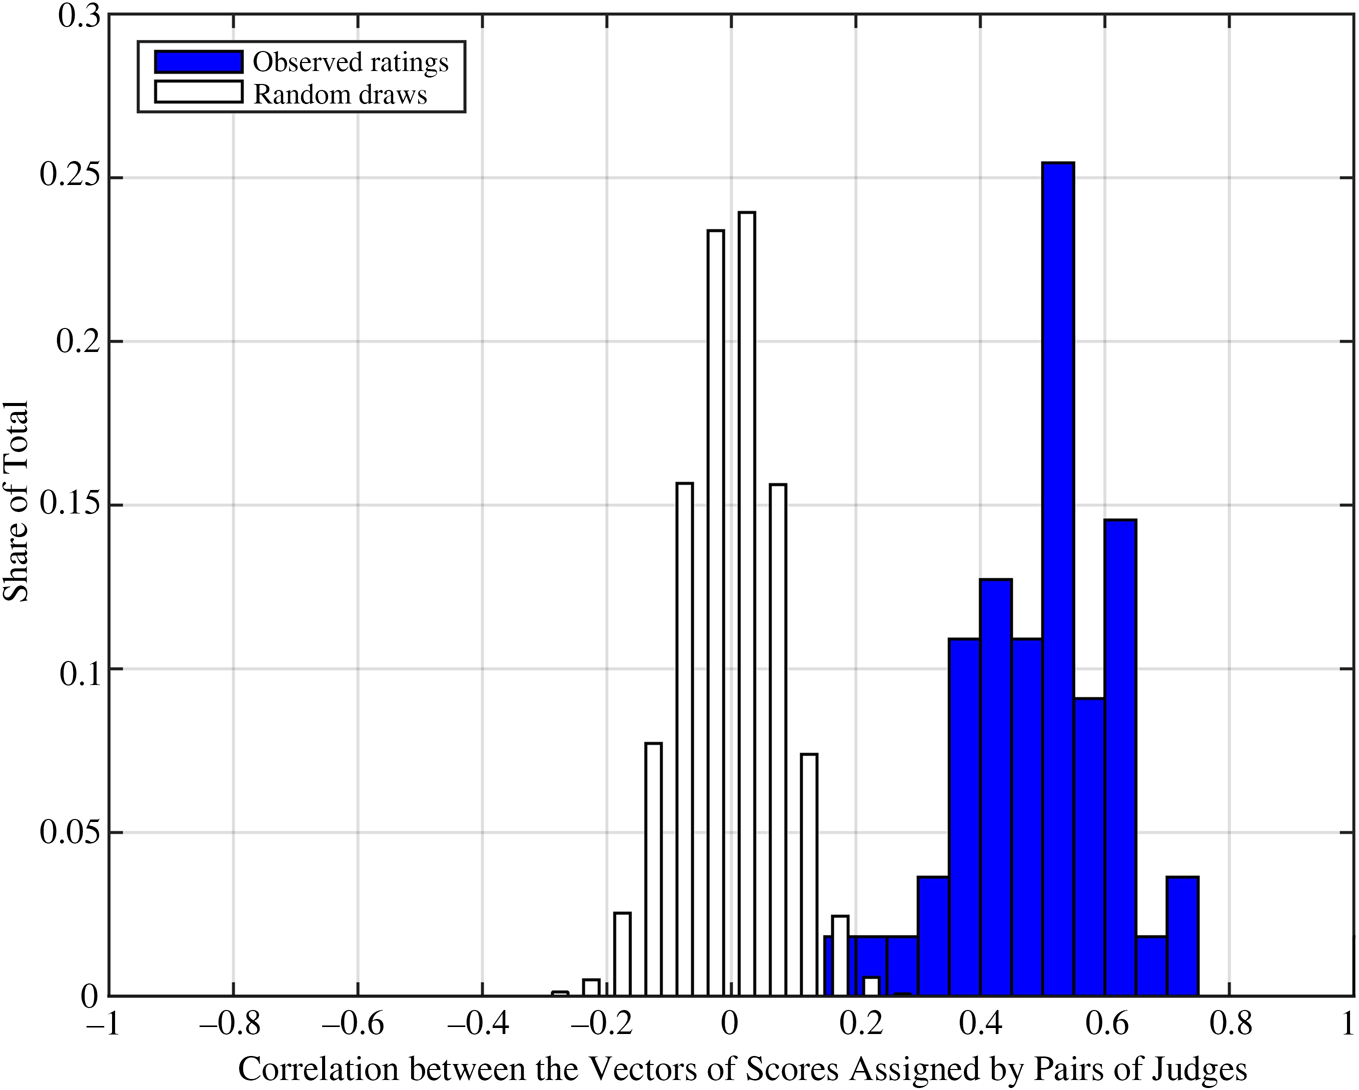
The ratings assigned by the same judges to the same wines in the same sequence can be expressed as a matrix. Every column in that matrix is the vector of ratings assigned by a judge; every row in that matrix is the vector of ratings assigned to a wine. The correlation coefficient between two columns in that matrix is a measure of the similarity in the ratings assigned by two judges to the same wines. For all crosses of judges, the frequency distribution of correlation coefficients for the 2019 CSF appears in Figure 1. In addition, Figure 1 shows the distribution of correlations as if the same judges had assigned ratings randomly. The data and MATLAB code are available on request.
CSF, Frequency Distribution of Correlations between Judges’ Ratings

The striking result in Figure 1 is how little the observed and random distributions overlap. The ratings assigned by most judges are positively correlated with the ratings assigned by most other judges. The small overlap in the distributions, with p-values < 0.001 for most of the correlations, shows that there is much non-random concordance among judges. However, there are a few correlations within the overlap.
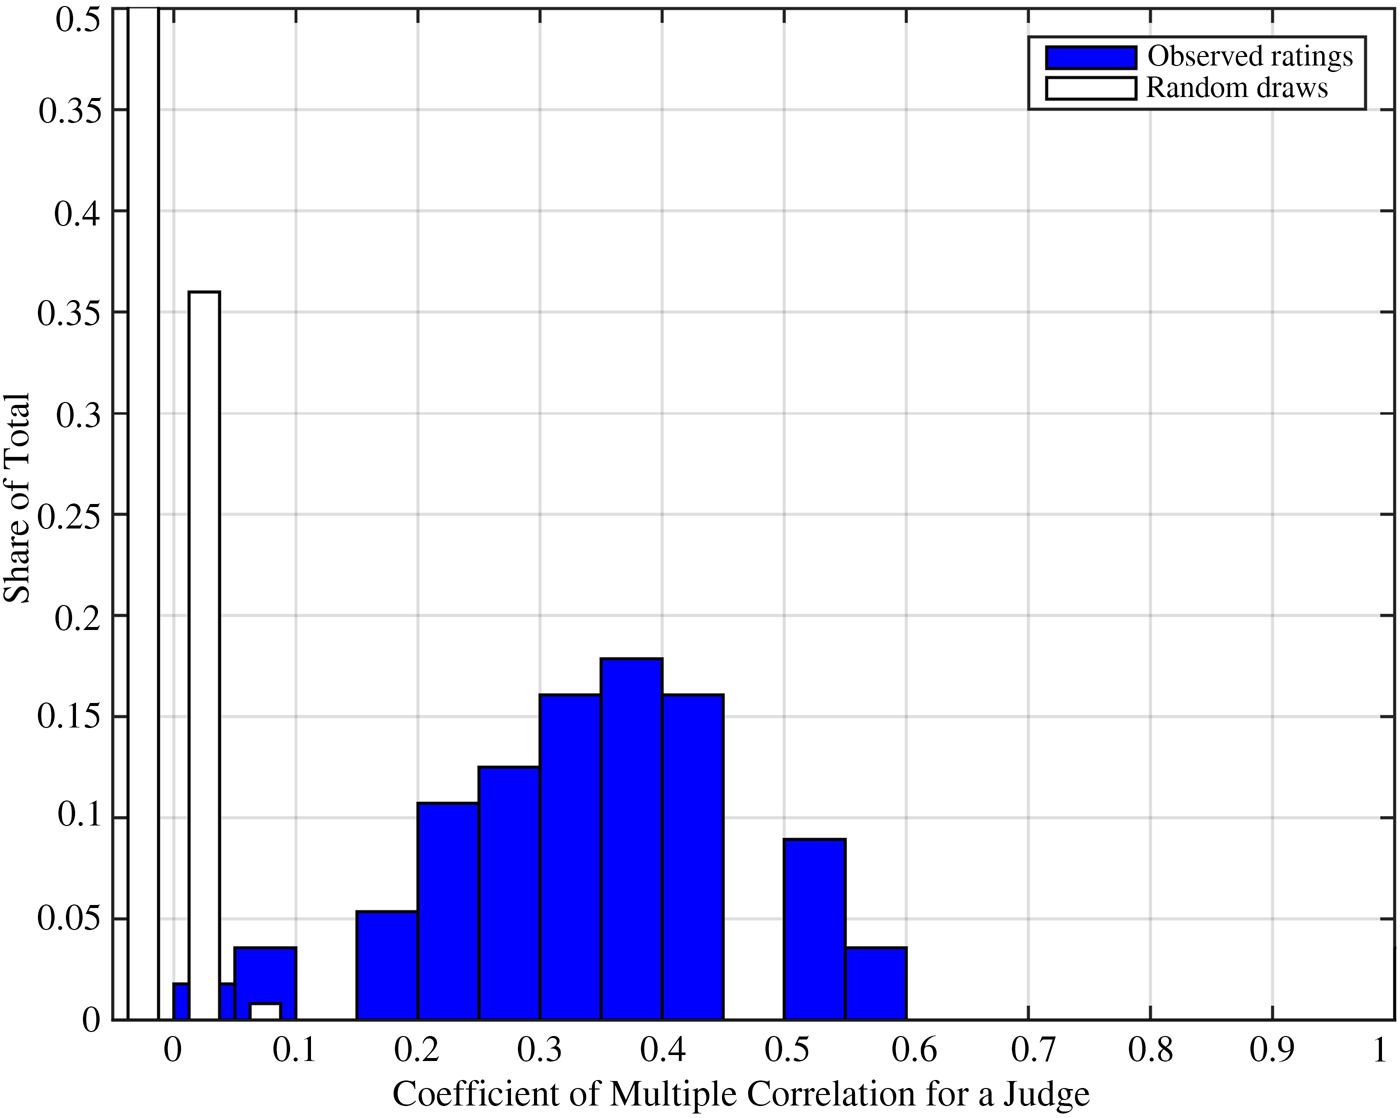
A difficulty with Figure 1 is that, showing cross correlations, a low value could be for a judge who correlates poorly with one judge but very well with another. Figure 1 is useful, but it does not identify the individual judges who do not correlate well with any other judges and whose rating assignments are thus indistinguishable from random. Those judges are identified in Figure 2 by calculating a coefficient of multiple correlation (R 2). Among many references, see, for example, Jensen (Reference Jensen2006) and Abdi (Reference Abdi and Salkind2007). The vector of ratings assigned by each judge is expressed as a linear regression model of the vectors of ratings assigned by the other judges to the same wines in the same sequence, and R 2 is the Pearson correlation coefficient between the vectors of predicted and observed ratings for a judge.Footnote 5 A low R 2 for that linear model implies that the ratings assigned by the subject judge are not well correlated with those assigned by any other judge. Again, the data and MATLAB code are available on request.
CSF, Frequency Distribution of Coefficients of Multiple Correlation

Like in Figure 1, the striking result in Figure 2 is how little the distributions overlap. Although none of the correlations are high, they do show some concordance among most judges. Within the overlap, the results also identify a few judges whose ratings are indistinguishable from random assignments. The p-values for those low correlations are higher than the customary thresholds for statistical significance that include 0.10 and below.
For 6 of the 54 CSF judges, R 2 was lower than 0.20. According to the CSF, there were no pouring, data recording, or data reporting errors that explain those results.Footnote 6 It is possible that some of those judges would correlate with judges not at the CSF in 2019. It may also be that certain aspects of the CSF's protocol, such as including unusual flavor profiles in a sequence, contributed to an appearance of randomness. Those possibilities can be tested by examining the ratings assigned by the subject judges in other competitions. According to the CSF, the 2018 data are not available in a form that enables checking the correlation coefficients for those subject six judges during 2018. On that basis, a program was underway to evaluate those judges and variations in the competition's tasting protocol during the 2020 CSF. Due to virus-related cancellation of the Wine Competition in 2020, that plan is deferred to 2021.
Finally, the results noted earlier are consistent with the correlations of ratings among prominent critics of red Bordeaux wines. Both Luxen (Reference Luxen2018) and Ashton (Reference Ashton2013) reported correlations among those critics, presumed to be experienced and skilled, of approximately 0.60. In addition, Frick (Reference Frick2020) showed that changes in the teams of critics who rate wineries in Germany do have a small but statistically significant effect on winery ratings. To summarize, judges can assign ratings that differ but are positively correlated.
IV. Conclusion and Discussion
Correlation coefficients and R 2 can be employed to rate the critics and judges who assign ratings to wines. Those ratings for 54 judges at the 2019 CSF show that there is a strong and positive correlation between the ratings assigned by most judges to most wines. However, those rate-the-rater correlations also show that the wine ratings assigned by approximately 10% of the judges are indistinguishable from random assignments.
Using correlations to rate wine judges has several advantages. First, the only measure of a judge's good or poor performance is whether or not there is statistically significant agreement with at least another judge on the relative merits of the wines under consideration. Competition sponsors can but do not need to set any standard for what is a good or poor wine. The judges’ ratings do not have to be IID, they must be independent, but they do not have to be identically distributed. The exact distribution of random ratings can be calculated, and the extent to which a judge's ratings appear to be random can then also be calculated. Both can be expressed in graphs that have intuitive meaning to a broad range of skill-set parties, and those intuitive implications can be supported with p-values. The results enable wine competition sponsors and participants to identify judges who provide a foundation for consensus-based awards and also to identify judges whose expertise could be reconsidered.
Although the advantages of using correlations to rate wine judges appear appealing, this application is nascent. Testing on the same judges over time and on other large data sets appears worthwhile, and the author has that program underway. Calculating a variation of R 2 for small data sets that are less than full rank may be useful. Finally, although the results in Figures 1 and 2 show a material correlation among most judges, those correlations are not 1.0. That gap between 1.0 and the observed correlations may lead to parameterizations of the latent distributions from which judges draw their ratings.