Hospital emergency departments (EDs) are critical sources of health care during and immediately after natural disasters such as hurricanes. In fact, the Emergency Medical Treatment and Labor Act requires EDs to examine and stabilize patients, regardless of their ability to pay, in the time of an emergency. 1 Examination of historical ED utilization patterns can contribute important information about community health needs following disasters and help state and local organizations plan future emergency responses.
Previous studies have examined changes in hospital utilization during hurricanes. These analyses were focused on a single storm, a single state, 1 age group, or specific health conditions, yet all showed an increase in ED utilization within the hurricane evacuation zone. Reference Gotanda, Fogel and Husk2-Reference Mortensen and Dreyfus8 Two studies found a significant increase in ED utilization for older adults after Hurricane Sandy, Reference Gotanda, Fogel and Husk2,Reference Malik, Lee and Doran7 and others noted an increased need for services that are not typically performed in the ED, such as dialysis, Reference Gotanda, Fogel and Husk2,Reference Lee, Smith and Carr5-Reference Malik, Lee and Doran7 and prescription refills. Reference Gotanda, Fogel and Husk2,Reference Greenstein, Chacko and Ardolic3,Reference Malik, Lee and Doran7 The unique contribution of this study is to examine ED utilization rates for the weeks during and after 7 US hurricanes between 2005 and 2016, across 5 patient age groups, across a range of disease categories, and by proximity to the hurricane’s path.
METHODS
Data Sources
This was a retrospective observational study of ED visits in 9 states where the Federal Emergency Management Agency (FEMA) declared at least 1 county a disaster area after any of the following 7 hurricanes: 9 Dennis, Wilma, Gustav, Irene, Isaac, Sandy, and Matthew. FEMA-designated disaster counties were classified as in, near, or remote to the hurricane path based on the National Oceanic and Atmospheric Administration data for hurricane trajectories. 10,11
Data on ED utilization came from the Healthcare Cost and Utilization Project (HCUP) State Emergency Department Databases, which capture records for ED visits that do not result in admission to the same hospital, and from the HCUP State Inpatient Databases, which capture inpatient records that began in the ED (i.e., ED visits resulting in admission to the same hospital). 12 For each hurricane, encounter-level data for ED visits for the 4 weeks preceding the start date of the hurricane and the following 4 weeks were summarized by age and condition into weekly volume. The HCUP databases include 1 record per hospital encounter with clinical information such as diagnoses and procedures, in addition to patient demographics.
Analytic Sample and Hurricanes
Two of the storms represented in this analytic sample made landfall in Florida. Hurricane Dennis made landfall in the Florida panhandle in July 2005 as a Category 3 storm. Significant wind gusts occurred in several counties and the storm surge rose above normal tide levels, causing flooding. 13 The analysis included information from 27 EDs in FEMA-designated disaster counties in Florida with over 600000 ED visits a year. Later, in October 2005, Hurricane Wilma made landfall in southwestern Florida as a Category 3 storm. Affected counties experienced high wind, heavy rainfall, storm surge, and tornadoes. 13 The analysis included information from 103 EDs in FEMA-designated disaster counties in Florida, with over 3.4 million ED visits a year.
Two of the storms represented in this analysis first made landfall in Louisiana but had extensive impacts on Florida. Hurricane Gustav made landfall in the southeastern coastal counties of Louisiana in September 2008 as a Category 2 storm. The affected counties were impacted by heavy rainfall, storm surge, freshwater flooding, and tornadoes. 13 The analysis included information from 14 EDs in FEMA-designated disaster counties in Florida with over 500000 ED visits a year. Hurricane Isaac made landfall on the coast of Louisiana in August 2012 as a Category 1 storm but days prior had impacted the Florida Keys. Flooding was caused by storm surge and heavy rains. 13 The analysis included information from 37 EDs in FEMA-designated disaster counties in Florida with almost 1.3 million ED visits a year.
The analysis also includes 3 hurricanes that made landfall in other states on the eastern seaboard. Hurricane Irene made landfall in coastal counties of North Carolina in August 2011 as a Category 1 storm. The coastal counties experienced heavy rainfall and tidal surge. 13 The analysis included information from 313 EDs in FEMA-designated disaster counties in Maine, Maryland, Massachusetts, New Jersey, New York, North Carolina, Rhode Island, and Vermont, with over 14.7 million ED visits a year. In October 2012, Hurricane Sandy made landfall in New Jersey as an extratropical storm, causing significant tidal surges and coastal flooding in coastal counties. 13 The analysis included information from 234 EDs in FEMA-designated disaster counties in Maryland, Massachusetts, New Jersey, New York, and Rhode Island with over 13.4 million ED visits a year. In October 2016, Hurricane Matthew also made landfall in the coastal counties of South Carolina as a Category 2 storm. The affected counties experienced hurricane-force winds, heavy rainfall, and storm surge flooding. 13 The analysis included information from 176 EDs in FEMA-designated disaster counties in Florida, Georgia, North Carolina, and South Carolina, with almost 8.6 million ED visits a year.
Statistical Methods
Weekly ED visit volumes were based on the patient’s county of residence. Population-weighted rates of weekly ED visits were calculated for the 4 weeks preceding the hurricane (averaged to define a rate for the pre-hurricane period), the hurricane week, and the 3 weeks post-hurricane. Rates are reported as ED visits per 10000 population.
Weekly rates were stratified by age (0–17, 18–44, 45–64, 65–79, and 80 years or older) and disease category. The first-listed diagnosis was grouped into categories using International Classification of Diseases (ICD) coding. We focused on 6 disease categories which were likely to be seen after a hurricane (injury, disorders of the respiratory, digestive, circulatory, genitourinary, and nervous systems) and used ICD chapters to define most of the categories (see Table 1). The data for Hurricane Matthew included ICD, Tenth Revision, Clinical Modification (ICD-10-CM) coding, whereas the earlier hurricanes had data coded in the Ninth Revision (ICD-9-CM). Statistical significance of differences in rates was tested using two-sample t-tests for means and a threshold of P < 0.05.
Coding Ranges for Disease Categories

Abbreviations: ICD-9-CM, International Classification of Diseases, Ninth Revision, Clinical Modification; ICD-10-CM, International Classification of Diseases, Tenth Revision, Clinical Modification/Procedure Coding System.
Limitations
The analysis of the changes in ED utilization after a hurricane was limited to states included in the HCUP ED databases for the applicable data year, however, not all states participate in HCUP. In addition, for states included in the analysis, no information was publicly available about EDs that were closed or damaged during the hurricane.
The analysis was complicated by the coding change from ICD-9-CM to ICD-10-CM diagnoses for 1 hurricane. Within each hurricane, the definition of disease categories was consistent, but the specific diagnoses within a disease category may vary slightly across the 2 coding systems. We ran a sensitivity analysis comparing post-hurricane ED utilization (using ICD-9-CM coded data) for the 6 hurricanes occurring prior to 2015 with utilization (using ICD-10-CM coded data) for the hurricane in 2016. We found that overall, and for respiratory and circulatory conditions, the magnitude of change of the post-hurricane ED utilization was similar. Differences were noted in the magnitude of change in ED utilization for injury in remote counties. This demonstrates that the use of ICD-10-CM coding for the 1 later hurricane did not disproportionately change our results.
RESULTS
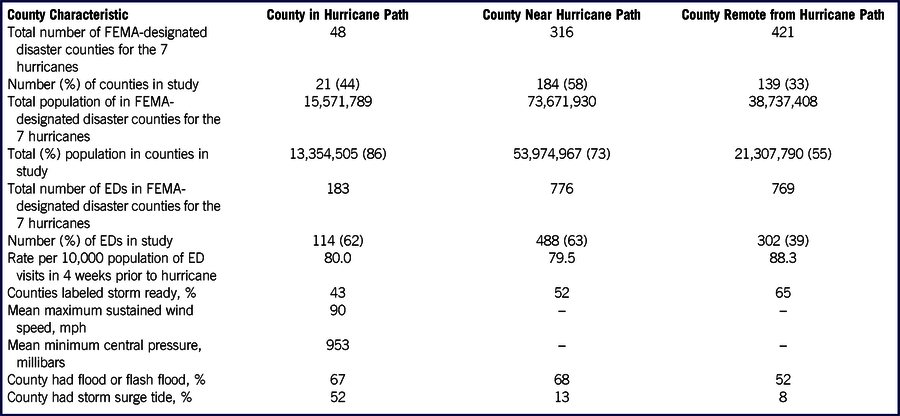
The HCUP data for the 7 hurricanes included ED visits in 904 EDs across 344 counties and involving 88 million individuals (Table 2). For in-path counties, the mean maximum sustained wind speed across the 7 hurricanes was 90 miles per hour, and the mean minimum central pressure was 953 millibars.
Characteristics of Counties by Proximity to Hurricane Path

Abbreviations: ED, emergency department; FEMA, Federal Emergency Management Agency.
Source: Agency for Healthcare Research and Quality, Healthcare Cost and Utilization Project, State Emergency Department Databases and State Inpatient Databases, 11 states, 2005–2016, and National Oceanic and Atmospheric Administration Best Track data for Hurricanes Dennis (Florida; 2005), Wilma (Florida; 2005), Gustav (Florida; 2008), Irene (Maine, Maryland, Massachusetts, New Jersey, New York, North Carolina, Rhode Island, and Vermont; 2011), Isaac (Florida; 2012), Sandy (Maryland, Massachusetts, New Jersey, New York, and Rhode Island; 2012), and Matthew (Florida, Georgia, North Carolina, and South Carolina; 2016).
Overall ED Utilization
The overall rate of weekly ED visits for counties affected by the hurricanes (80.0 for in-path counties, 79.5 for near-path counties, and 88.3 for remote counties) either did not change significantly or decreased by less than 4% from the pre-hurricane period to the hurricane week or any of the 3 post-hurricane weeks (Figure 1, Supplemental Table 1).
Percent Change in Weekly ED Visits per 10,000 from Prehurricane to the Hurricane Week and 3 Weeks Posthurricane, by Hurricane Proximity and Patient Age.

Patient Age
Compared with the pre-hurricane rate, children in in-path and remote counties demonstrated a delayed increase in ED utilization in post-hurricane week 3 (11.3% and 9.6%, Figure 1, Supplemental Table 1). In contrast, adults aged 65 years and older in in-path counties had a significant increase in utilization during the hurricane week, with the magnitude of change decreasing as the distance from the hurricane increased from in-path to remote counties. For adults aged 65–79 years, the rate of ED visits during the hurricane week increased by 17.7% for in-path counties, 9.4% for near-path counties, and 4.1% for remote counties. Larger increases were seen for adults aged 80 years and older (22.1% for in-path counties, 14.4% for near-path counties, and 5.2% for remote counties). Post-hurricane ED visit rates for adults aged 80 years and older from in-path counties remained significantly higher than the pre-hurricane rates for the 3 weeks studied, but rates for adults aged 65–79 years from in-path counties returned to baseline by the second post-hurricane week.
Disease Categories
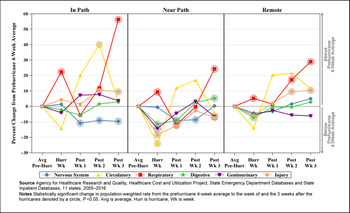
Figures 2, 3, and 4 (Supplemental Tables 2, 3, 4, 5, and 6) depict changes in ED utilization rates for the 6 disease categories by patient age. For children in in-path counties, only the rate of weekly visits involving respiratory disorders significantly increased during the hurricane week, and the magnitude of the change decreased with the distance from the hurricane (22.4% for in-path counties, 9.3% for near-path counties, and 5.2% for remote counties) (Figure 2, Supplemental Table 2). The largest increases in visits involving respiratory disorders occurred between the pre-hurricane period and post-hurricane week 3 (56.4% for in-path counties, 24.2% for near-path counties, and 29.0% for remote counties). The most common respiratory conditions for children during the hurricane week were bronchitis, acute tonsillitis, acute upper respiratory infections, and asthma. For pediatric ED visits involving injuries, there was about a 10% increase in weekly ED visit rates from the pre-hurricane period to post-hurricane weeks 2 and 3 for in-path and remote counties. Near-path counties had decreased rates for injuries during most of the post-hurricane weeks.
Percent Change in Weekly ED Visits per 10,000 from Prehurricane to the Hurricane Week and 3 Weeks Posthurricane, by Hurricane Proximity, Patients Aged 17 Years and Younger.

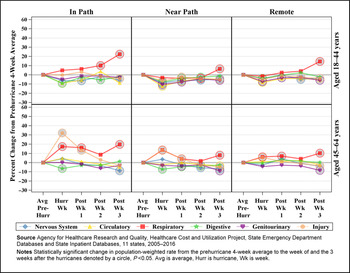
Percent Change in Weekly ED Visits per 10,000 from Prehurricane to the Hurricane Week and 3 Weeks Posthurricane, by Hurricane Proximity, Patients Aged 18 to 44 Years and Aged 45 to 64 Years.

Percent Change in Weekly ED Visits per 10,000 from Prehurricane to the Hurricane Week and 3 Weeks Posthurricane, by Hurricane Proximity, Patients Aged 65 to 79 Years and Aged 80 Years Older.

ED visits involving respiratory disorders increased in varying patterns for adults aged 18–44 years and 45–64 years (Figure 3, Supplemental Tables 3 and 4). ED visits involving respiratory disorders for adults aged 45–64 years significantly increased during the hurricane week. The magnitude of the change decreased with the increase in distance from the hurricane from 17.5% for in-path counties, to 13.6% for near-path counties, and to 6.2% for remote counties. In addition, increased rates were observed for this age group for post-hurricane weeks 1 and 3. Younger adults aged 18–44 only showed an increase in ED visits for respiratory disorders in post-hurricane weeks 2 and 3 for in-path counties (10.0% and 22.4%, respectively), and post-hurricane week 3 in near-path and remote counties (6.4% and 14.6%, respectively).The largest increases in ED visits involving respiratory disorders occurred from in-path counties in post-hurricane week 3 (22.4% for adults aged 18–44 years and 19.7% for adults aged 45–64 years). During the hurricane week, the most common respiratory conditions for adults aged 18–64 years were acute pharyngitis, asthma, bronchitis, acute upper respiratory infections, and pneumonia.
ED visits involving injuries for adults aged 45–64 years significantly increased during the hurricane week (Figure 3, Supplemental Table 4). The magnitude of the change decreased with the increase in distance from the hurricane, from 32.0% for in-path counties, to 13.4% for near-path counties, and to 5.6% for remote counties. Increased rates continued for in-path and remote counties until post-hurricane week 1 and then either returned to baseline or declined from the pre-hurricane average rates of ED visits.
In-path counties showed either no change or a decrease in weekly ED visits for adults aged 18–44 and 45–64 years for the other 4 diagnoses: circulatory disorders, digestive disorders, genitourinary disorders, and nervous system disorders (Figure 3, Supplemental Tables 3 and 4). ED visits for adults aged 18–44 years in near-path counties showed a significant 4% to 12% decrease during the hurricane week and the post-hurricane week 1 for all 4 diagnoses. ED visits for adults 45–65 years showed significant decrease in the 4 diagnoses for varying post-hurricane weeks, with no notable pattern. Remote counties also showed a significant decrease of 3% to 8% in ED visits for adults aged 18–44 years for the 4 diagnoses during some of the hurricane or post-hurricane weeks. Only ED visits for adults 45–65 years for genitourinary disorders showed a significant decrease, in remote counties, during the third post-hurricane week.
For adults aged 65–79, as well as those aged 80 years and older, ED visits involving respiratory disorders significantly increased during the hurricane week; the magnitude decreased with distance from the hurricane (Figure 4, Supplemental Tables 5 and 6). For adults aged 65–79 years, ED visit rates involving respiratory disorders increased during the hurricane week by 34.1% in in-path counties, 33.1% in near-path counties, and 9.5% in remote counties. For adults aged 80 years and older, ED visit rates involving respiratory disorders increased during the hurricane week by 38.1% in in-path counties, 32.9% in near-path counties, and 9.9% in remote counties. The most common respiratory disorders for adults aged 65 years and older during the hurricane week were bronchitis, pneumonia, chronic obstructive pulmonary disease, and respiratory failure.
For adults aged 65–79 years, ED visit rates involving injury increased during the hurricane week by 44.1% in in-path counties, 30.0% in near-path counties, and 15.1% in remote counties. A similar pattern of increased rates for ED visits involving injury during the hurricane week with decreased magnitude with distance from the hurricane was observed for adults aged 80 years and older (52.9% for in-path counties, 29.7% in near-path counties, and 8.7% in remote counties). For both older age groups (65–79 and over 80 years), the ED visit rates related to injuries returned to the pre-hurricane rate by the third post-hurricane week.
For adults aged 80 years and older, ED visit rates involving genitourinary disorders increased during the hurricane week by 17.1% in in-path counties and 11.5% in near-path counties. The most common conditions seen in the ED during the hurricane week were urinary tract infections, acute renal failure, and calculus of the ureter or kidney.
ED visit rates related to disorders of the nervous system increased during the hurricane week in both in-path and near-path counties for adults aged 65–79 years (21.4% and 7.2%, respectively), but only in near-path counties for adults aged 80 years and older (16.7%). The most common conditions for adults aged 65 years and older, reported during the hurricane week, were Alzheimer’s disease, transient ischemic attack, epilepsy, vertigo, and chronic pain. For both older age groups (65–79 and over 80 years), the ED visit rates for nervous system disorders returned to the pre-hurricane rates by the second post-hurricane week.
DISCUSSION
In aggregate, changes in ED visits appear relatively small during the hurricane week, as well as 3 weeks after the hurricane. However, these small changes mask striking changes in ED utilization by specific subpopulations. Individuals younger than 18 years and older than 44 years had an increased need for ED respiratory services during the week of the hurricane. The magnitude of the increased need declined with the distance from the patient’s county of residence to the hurricane’s path. Adults older than 44 years also had a significantly increased need for ED services related to injury during the week of the hurricane, with the magnitude of the change decreasing with the distance from the hurricane. Only adults aged 65 years and older had a significantly increased need for ED services for disorders of the genitourinary and nervous systems in the weeks during or following the hurricane.
Some changes in ED utilization were not in an expected direction. For example, rather than diminishing after the hurricane had passed, ED visits involving respiratory disorders were at their highest rates during post-hurricane week 3, for patients younger than 65 years. This delay may reflect a latency period after exposure to fungi, lack of air conditioning because of power outages, and other factors. Reference Rath, Young and Harris14
Decreases in ED visits for children and adults in near-path counties were also unexpected. Further research is needed, but this finding may suggest that ED volume following a hurricane is affected by migration out of in-path areas and, in some cases, temporary hospital closures.
CONCLUSIONS
This analysis shows that ED utilization data can reveal striking changes in the use of specific categories of ED services by subgroups of the population in the aftermath of hurricanes. Findings on the increased use of ED visits related to respiratory conditions by people of all ages and for services related to injury and disorders of the genitourinary and nervous systems by older people may be useful in short- and longer-term service plans of facilities located in areas that are frequently affected by these types of events. The availability of ED utilization data makes further work in this area highly feasible. Additional analyses should examine the association between hurricane characteristics and the epidemiology of conditions. Knowing the short- and long-term impact on ED utilization for specific types of storms by clinical specialty would be valuable to emergency planners and local healthcare providers.
Funding
This research was supported by the Agency for Healthcare Research and Quality (AHRQ), Healthcare Cost and Utilization Project (HCUP) Contract No. HHSA-290-2018-00001-C.
Disclaimer
The views expressed in this article are those of the authors, and do not necessarily reflect those of the Agency for Healthcare Research and Quality or the United States Department of Health and Human Services.
Acknowledgments
The authors gratefully acknowledge Thomas Flottemesch, PhD (while with IBM Watson Health) and Minya Sheng, MS (IBM Watson Health) for assistance with data management and programming; Frank Yoon (IBM Watson Health) and Hal Skinner (while with IBM Watson Health) for statistical guidance; Emma Mollenhauer (IBM Watson Health) for assistance with preparation of figures; and Linda Lee, PhD (while with IBM Watson Health) for providing editorial review of the manuscript. We also wish to acknowledge the 11 HCUP Partner organizations that contributed to the HCUP State Databases used in this study: Florida Agency for Health Care Administration, Georgia Hospital Association, Maine Health Data Organization, Maryland Health Services Cost Review Commission, Massachusetts Center for Health Information and Analysis, New Jersey Department of Health, New York State Department of Health, North Carolina Department of Health and Human Services, South Carolina Revenue and Fiscal Affairs Office, Rhode Island Department of Health, and the Vermont Association of Hospitals and Health Systems.
Abbreviations
- FEMA:
-
Federal Emergency Management Agency
- ED:
-
Emergency Department
- HCUP:
-
Healthcare Cost and Utilization Project
Supplementary material
To view supplementary material for this article, please visit https://doi.org/10.1017/dmp.2020.281