


In the United States’ first century, Congress appropriated funds for thousands of discrete local projects. The purpose of these appropriations ranged from the construction and maintenance of lighthouses, roads, canals, customs houses, post offices, forts, arsenals, and armories to the dredging of rivers and harbors and the installation of beacons and buoys. Despite the potential value of such projects, their piecemeal nature and the opaque political process by which they were funded soon made them an object of scorn, as the epitome of wasteful spending—and the subject of numerous presidential vetoes. In 1832, for example, President Andrew Jackson argued that appropriations to fund local “internal improvements” projects without a coherent set of criteria to judge their national significance promoted “a mischievous and corrupting influence upon elections by holding out to the people the fallacious hope that the success of a certain candidate will make navigable their neighboring creek or river, bring commerce to their doors, and increase the value of their property.” He added that these incentives favored “combinations to squander the treasure of the country upon a multitude of local objects, as fatal to just legislation as to the purity of public men.”
Elements of Jackson’s perspective have since acquired the status of stylized facts, used to illustrate various accounts of distributive politics. Yet the extent to which the actual allocation of localized benefits in this formative period of U.S. governance conforms to the stylized view, and thus, to the expectations of canonical distributive theories, is not entirely clear. Did members of Congress pursue federally subsidized local economic benefits to enhance their electoral prospects, or those of their local party organizations? Did the beneficiaries of local appropriations form themselves into “combinations” in support of ruinous spending, and if so, did those combinations constitute minimal winning, or oversized, universalistic coalitions? Or were ideological divisions over economic policy in general, and government spending specifically, more determinative of congressmen’s support for local projects than whether their own districts directly benefited?
Answering these questions is difficult primarily because, to date, there has existed no comprehensive data source on local appropriations during this period to draw on. As a result, scholars have been forced to rely on limited or qualitative sources of evidence when theorizing about the politics surrounding this area of public policy. For example, the view that nineteenth century river and harbor appropriations were paradigmatic examples of universalistic logrolls has its origins in the writings of nineteenth-century critics: Albert Bushnell Hart, in describing the 1887 River and Harbor Bill, noted that “there are a hundred pleas for expenditure against one protest at extravagance . . . almost every congressman is an interested party” (Hart Reference Hart1887, 183). Lord Bryce, writing in The American Commonwealth, confirmed Jacksonian suspicions of the electoral motivations behind pork-barrel spending, observing that “[a]n ambitious congressman is . . . forced to think day and night of his renomination, and to secure it . . . by procuring, if he can, grants from the federal treasury for local purposes” (Bryce Reference Bryce1995 [1888], 158).
To address this paucity of systematic data, we assemble an original dataset of almost 9,000 unique congressional appropriations on local projects in the United States from 1789 to 1882, geospatially matched to congressional districts and, by extension, their representatives. We use these data to evaluate the accuracy of distributive accounts that explain local appropriations via a logic of credit-claiming by reelection-minded legislators. Our investigation reveals that, in contrast with the view that members of Congress used local appropriations to improve their electoral prospects via credit-claiming (or, given the nature of politicians’ careers during the period, those of their local party organizations), until the 1870s, members of Congress were no more likely to receive appropriations in their districts before they stood for election than after—at which point credit-claiming would avail them little. Similarly, we find that in post-election sessions in the prebellum period, districts with members exiting the chamber (through either rotation with copartisans or replacement by partisan opponents) received as much funding as districts whose members were returning. Moreover, we find no systematic relationship between appropriations to a district and that district’s electoral competitiveness, no evidence that committee membership boosted access to particularistic goods, and no evidence that the allocation of local expenditures served to “grease the wheels” of the legislative process (Evans Reference Evans2004; Crowe Reference Crowe1969) by funneling appropriations to pivotal legislators in exchange for their votes on other legislation.
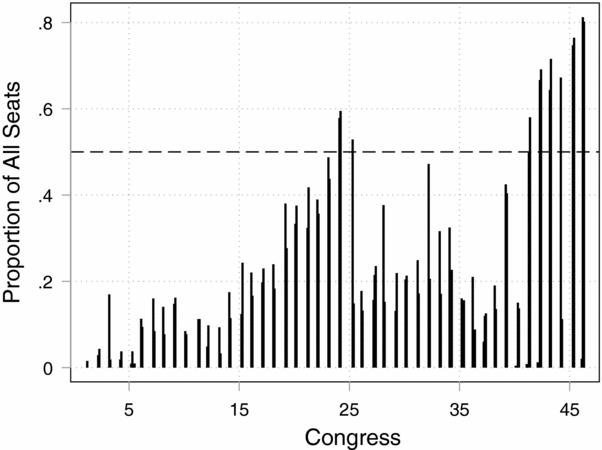
In the second part of our analysis, we determine the fraction of legislators who had districts directly benefiting from local appropriations in a given congressional session. Contrary to both minimum winning and universalistic coalition hypotheses, and in contrast to findings by Wilson (Reference Wilson1986) for the period 1889–1913 and Ferejohn (Reference Ferejohn1974) for the period 1947–1968, we find that the number of legislators directly benefiting from local appropriations (whether aggregated by bill, session, or congress) consistently totaled less than 50% of House seats until the 1870s, when the proportion crept over 50% and toward a supermajority.
The conjunction of these findings with those of Wilson (Reference Wilson1986) suggest that canonical accounts of nineteenth-century distributive politics may apply only to the last quarter of the century. What, then, explains earlier legislative support for—or opposition to—these expenditures? By combining congressional voting data on key bills from the period with the actual appropriations described in those bills, we demonstrate that until the first session of the 44th Congress (1875–76), when Democrats assumed control of the House for the first time since before the Civil War, a legislator’s ideology—in particular, his support for the Anti-Jacksonian/Whig/Republican economic program—was a far more reliable predictor of vote choice than whether a particular bill provided distributive benefits to his or nearby districts. This structure abruptly changed in 1875: At that point, the parties ceased to split on local appropriations legislation, and the size of both support coalitions and the set of districts directly benefiting approached supermajority levels.
We link this change to two concurrent trends in the political economy of the period. The first is an increase in the demand for internal improvements by Southern Democrats returning to Congress in the waning days of Reconstruction (Seip Reference Seip1983; Harris Reference Harris1976). When the Democrats assumed control of Congress in 1875 for the first time since before the Civil War, Republicans did not abandon their traditional support of internal improvements legislation, but Southern Democrats led their party to newfound and enthusiastic acceptance of the spending. Interestingly, while Woodward (Reference Woodward1951) argues that the 45th Congress (1877–1879) saw Southerners finally realizing distributive gains for their region as an implicit component of the Compromise of 1877, we document significant growth in support from Southern Democrats and appropriations to their districts beginning with the lame duck session of the 43rd Congress (in 1875) and continuing through the 44th—prior to the Compromise.Footnote 1 The second trend is a simple ratchet effect: Over the course of the nineteenth century, the set of discrete projects in which the federal government invested grew incrementally. However, many of those projects, once built, required recurrent expenditures for their upkeep. Lighthouses needed to be rebuilt or modernized; harbors required redredging; and damaged or obsolete facilities required upgrades. Through a process of accretion, the set of federally financed projects eventually spanned a large majority of districts.
Our findings contribute to the scholarly understanding both of the particular historical period under scrutiny and of distributive policymaking generally. With respect to the former, they suggest that some understandings of the early Congress drawn from contemporary accounts must be reevaluated, and provide a template for reconciling disparate findings concerning the historical functioning of the electoral connection. In particular, they suggest the value of delimiting the domains of policy in which legislator responsiveness to voter demands are more or less likely to manifest themselves. With respect to the latter, our results suggest that pork-barrel policies need not bear the hallmarks of pork-barrel politics (cf. Lowi Reference Lowi1964). Patterns of support for, and opposition to such policies among legislators may not always be reducible to a desire to secure benefits for credit-claiming purposes. Rather, they may instead correspond to persistent ideological cleavages more consistent with disagreement regarding the provision of programmatic public goods.Footnote 2
BACKGROUND
The Historical Context of Local Appropriations
Over the course of the United States’ first century, a wide array of local elites and federal officials expressed interest in constructing a comprehensive program of federally subsidized infrastructure investment. The idea of using federal funding for “internal improvements” emerged with the Republic itself: in 1789, the First Congress voted to transfer operational authority of coastal lighthouses and navigational aids to the federal government, and appropriated $24,076.66 for the construction of a lighthouse at Cape Henry on the mouth of Chesapeake Bay.Footnote 3 Internal improvements were a key component of Alexander Hamilton’s economic program, as detailed in his 1791 Report on Manufactures. They also featured in the “American System,” a set of economic policies first proposed by Henry Clay at the conclusion of the War of 1812 that later laid the foundation for the Whig party platform. Yet despite periodic congressional appropriations on roads, navigational improvements, public buildings, and military installations—bolstered by the Supreme Court’s 1824 ruling in Gibbons v. Ogden (holding that Congress was entitled under the interstate commerce clause to regulate navigable waterways)—such spending engendered significant legislative and presidential opposition, and a comprehensive national plan for internal improvements never came to fruition.Footnote 4 Federal infrastructure investment remained small relative to state and local investment throughout the nineteenth century (e.g., Goodrich Reference Goodrich1960; Larson Reference Larson2001; Minicucci Reference Minicucci2004).Footnote 5
A number of reasons may be cited for the failure of a national plan to emerge. The first is constitutional: Article I, Section 8 of the U.S. Constitution explicitly delegates to Congress only the powers to establish post offices, build post roads, and erect “forts, magazines, arsenals, dock-yards, and other needful buildings.”Footnote 6 Thus, proponents of federal funding for other categories of local spending were forced to justify the constitutionality of such spending via creative interpretations of the commerce and necessary and proper clauses.
Other hindrances were more political in nature. During the presidency of Andrew Jackson, opposition to internal improvement spending (often led by Jackson himself) was closely linked to southern states’ animosity toward the tariff and a desire to retire the national debt. Agricultural products in southern states had more ready access to navigable waterways, lessening the demand in those states for federal infrastructure spending until the postbellum period. At the same time, northern states that undertook their own projects after being stymied at the national level were loath to finance subsequent improvements in rival states (Goodrich Reference Goodrich1960; Larson Reference Larson2001). From the Monroe to Buchanan presidencies, roughly half of all presidential vetoes were of internal improvement bills—some citing constitutional objections, others simple waste, and others the absence of a “national character” to the appropriations.
After the Civil War, some of the northern representatives whose states had earlier benefited from federal expenditures found themselves new disciples of fiscal rectitude when it came to investment in other parts of the country (Woodward Reference Woodward1951; Brady and Morgan Reference Brady, Morgan, McCubbins and Sullivan1987). However, their conversion came too late: constitutional objections from the executive branch had waned, and demand from southern and western states was growing. As a result, local appropriation bills became a perennial feature of the legislative process.
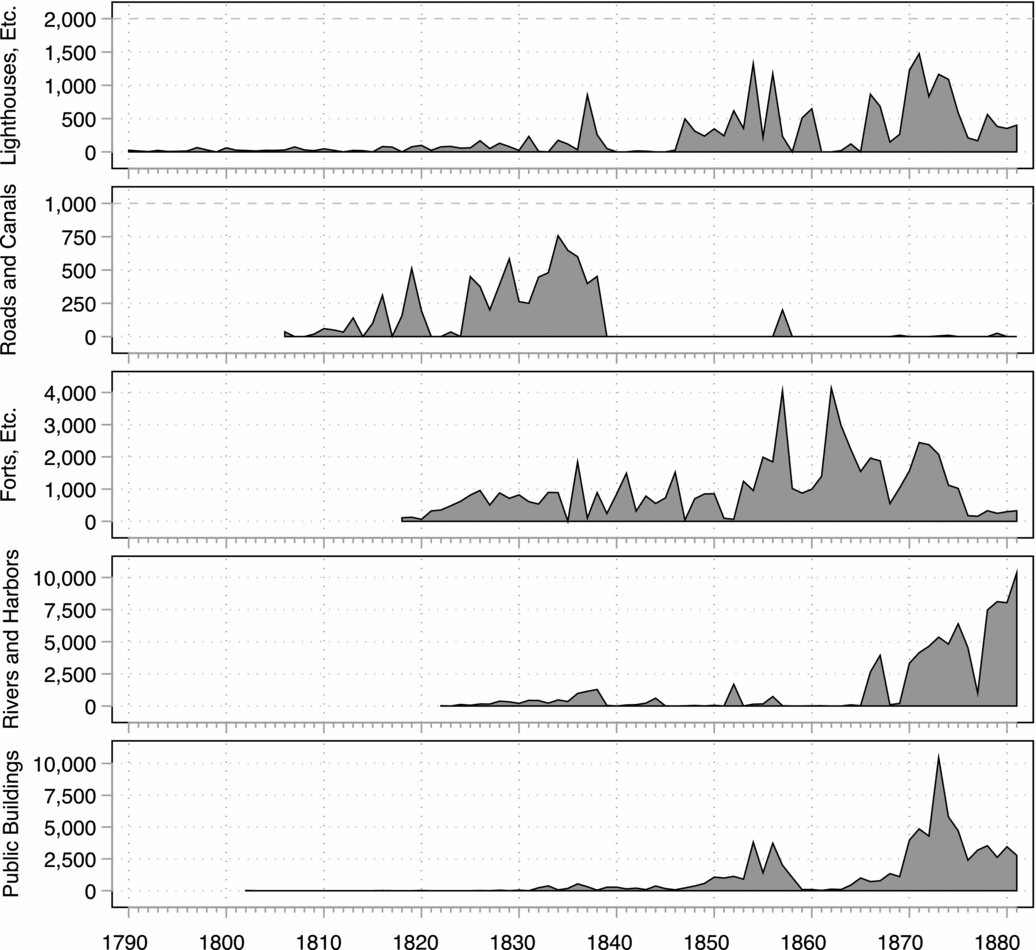
Figure 1 provides a preliminary glimpse at our data on the allocation of local federal spending across spending objects in the first 90 years of the Republic. Spending on military assets constitutes a sizable portion of appropriations beginning in the 1820s. Other categories fluctuate. There are large jumps in appropriations to roads and canals between the 1810s and 1830s, due mostly to work on the Cumberland Road (in the 1810s) and to canal subscriptions (in the 1820s).Footnote 7 Lighthouses, beacons, and other navigational aides date to the beginning of the Republic, but hover at a low level until the 1830s. River and harbor appropriations commence in the 1820s, and accelerate after the Civil War. Finally, spending on public buildings takes off in the 1850s, and then again after the War.
Programmatic Distribution of Localistic Federal Appropriations, 1790–1880.

The (Historical) Pork Barrel, the Electoral Connection, and the Ideology of Internal Improvements
The premise that legislators secure electoral benefits by claiming credit for government spending on behalf of their constituencies (Mayhew Reference Mayhew1974) forms the basis for an immense body of theoretical and empirical scholarship on the functioning of legislative institutions, the dynamics of federal appropriations, and the composition of legislative coalitions. The institutional benefits of majority party (Balla et al. Reference Balla, Lawrence, Maltzman and Sigelman2002; Berry, Burden, and Howell Reference Berry, Burden and Howell2010; Albouy Reference Albouy2013; Dynes and Huber Reference Dynes and Huber2015) and committee membership (Weingast and Marshall Reference Weingast and Marshall1988) have been posited to be particularly valuable in ensuring access to local benefits and facilitating logrolls across multiple policy areas.Footnote 8 Variation in pork-barrel spending over time has been examined with reference to legislators’ incentives to target government expenditures early in the election cycle to vulnerable legislators (Bickers and Stein Reference Bickers and Stein1996), or stack appropriations in the states of senators whose terms are closest to expiring (Shepsle et al. Reference Shepsle, Van Houweling, Abrams and Hanson2009). Finally, the logic of legislative credit-claiming has had a range of implications for the nature and size of coalitions supporting bills that allocate localized benefits: some theoretical scholarship postulates that such bills should receive the support of, and distribute benefits to, a minimum-winning or (in the presence of uncertainty) slightly oversized coalition (Riker Reference Riker1962; Carrubba and Volden Reference Carrubba and Volden2000); other scholars have suggested that the persistence of uncertainty and the need to sustain cooperation over time could even yield universalistic coalitions in equilibrium (Ferejohn Reference Ferejohn1974; Weingast Reference Weingast1979; Shepsle and Weingast Reference Shepsle and Weingast1981; Niou and Ordeshook Reference Niou and Ordeshook1985; Groseclose and Snyder Reference Groseclose and Snyder1996).Footnote 9
While much of the research on the electoral connection has focused on its operation in the twentieth and twenty-first centuries, its scope and function in the nineteenth century has also been the subject of considerable scholarly debate. Although nineteenth-century commentators bemoaned legislators’ self-interested catering to their constituencies, a number of more modern scholars have argued that features of the early American republic—such as high levels of rotation in office, party- rather than office-centered careerism, and the party ballot—prevented the electorate from holding legislators accountable, thus diminishing the incentives of legislators to secure benefits for their constituents (Formisano Reference Formisano1974; Price Reference Price and Ornstein1975; Kernell Reference Kernell1977; Skeen Reference Skeen1986; Aldrich Reference Aldrich1995; Katz and Sala Reference Katz and Sala1996). Recently, however, researchers have presented evidence of a nineteenth-century electoral connection with regard to bills increasing Congress’s compensation (Bianco, Spence, and Wilkerson Reference Bianco, Spence and Wilkerson1996), the House of Representatives’ vote for president in 1824 (Carson and Engstrom Reference Carson and Engstrom2005), district-specific war casualties (Carson et al. Reference Carson, Jenkins, Rohde and Souva2001), and the president’s allocation of discretionary funding (Rogowski Reference Rogowski2016). More generally, Stewart (Reference Stewart1989) argues that legislators were concerned with reelection (and thus with obtaining federal funding for their districts) by the second half of the nineteenth century, while Carson and Sievert (Reference Carson and Sievert2017) show that, throughout the nineteenth century, individual legislators who could motivate constituency support were a valuable addition to party ballots.
The accounts described above set aside the question of whether underlying partisan or ideological disagreement might drive patterns in legislative demand for local federal expenditures.Footnote 10 Yet federal investment in local projects was a key bone of partisan contention in the first two U.S. party systems, due both to competing visions of the economic development of the new United States (Meinig Reference Meinig1995) and to sectional differences between agrarian and urban regions.Footnote 11 At the risk of gross simplification, the Jeffersonian (and later Jacksonian) view envisioned an agrarian future for the U.S., while the Hamiltonian (and later Whig) view envisioned one grounded in commerce and industry. If nineteenth-century legislators viewed local expenditures through partisan lenses, a district’s direct benefits might have borne little relationship with its representative’s electoral viability or institutional position.Footnote 12
DATA AND APPROACH
Data Sources and Scope of Inquiry
Appropriations
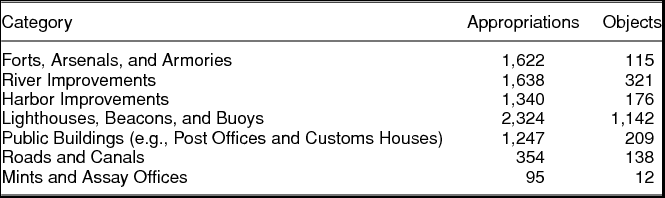
Our primary source of data is Senate Executive Document No. 190 (U.S. Department of the Treasury 1886): an 1886 volume compiled for the Senate by the Treasury Department that lists federal public works expenditures between 1789 and 1882. The information contained in this compendium includes the appropriation date, the volume, page, and section of the associated law in United States Statutes at Large, and its monetary amount, purpose, and geographic focus. Years and amounts of actual expenditures, repayments, and other associated financial transactions are also recorded. Table 1 details the number of unique appropriations in seven spending categories. Also described in the Table are the number of unique spending objects in the data for each of the seven categories (for example, the Sandusky River or the Cape Fear Light Station, each of which received multiple appropriations during the time period in question).
Unique Appropriation Transactions and Spending Objects in the Data, by Category

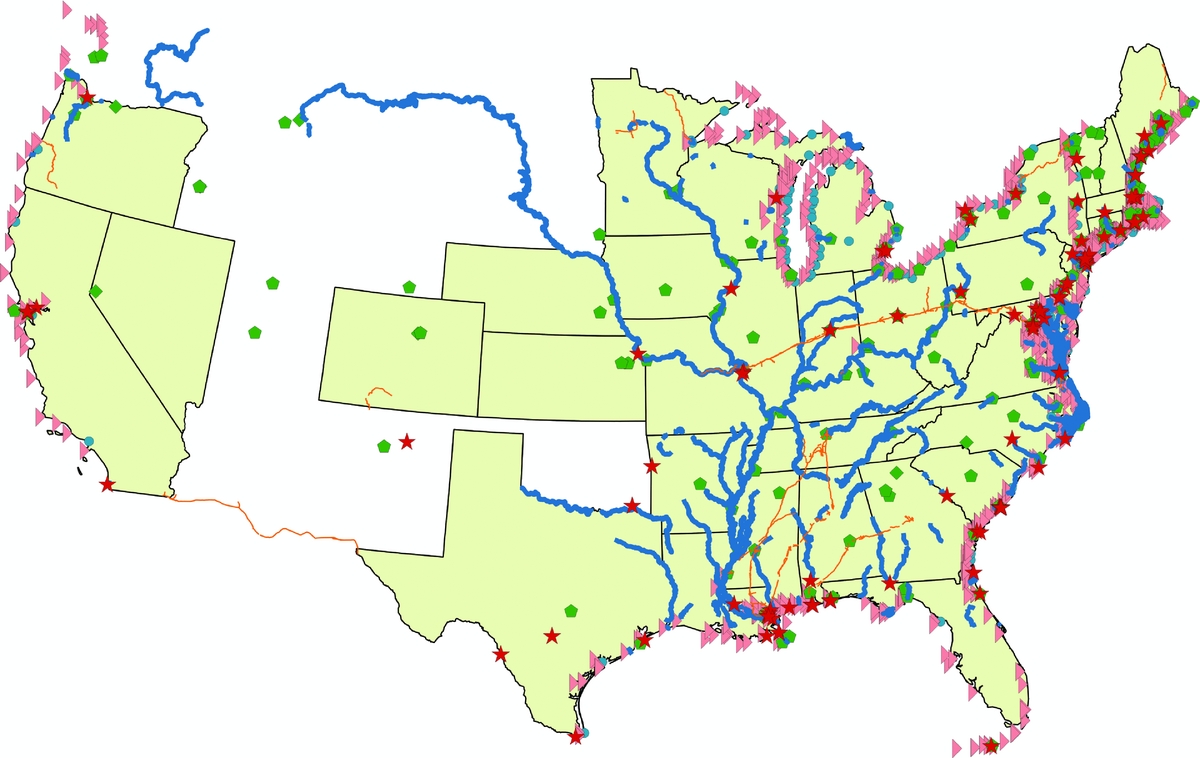
Using optical character recognition software to convert the document to an editable file, we constructed an original dataset of 8,621 local appropriations made by the 47 Congresses in session between 1789 and 1882, then geolocated each itemized appropriation using a combination of references (see Appendix for a full list). Figure 2 presents the loci of these appropriations superimposed on a map of the United States in 1881 (see caption for legend). We merged the geolocated data with cartographic boundary files on the congressional districts corresponding to each Congress during this period (Lewis et al. Reference Lewis, DeVine, Pitcher and Martis2013). Dropping military appropriations in Confederate states from secession to readmission, this yielded 11,104 unique district-appropriation pairs for the period.Footnote 13 We then collapsed the dataset to the district-session level, expanded it to include observations in which a district received no appropriations in a session, and adjusted for the presence of vacancies, multimember districts, and states with general tickets (see below), arriving at a main dataset of 28,436 district-session observations.
Geographic Loci of All Appropriations, 1792–1881

Our focus on this collection of appropriations requires some elaboration. First, while the spending objects enumerated in Table 1 constitute the lion’s share of local spending for the period, they are not the entire universe. Most importantly, we omit appropriations for individual post offices that were not the result of a specific appropriation by Congress. (Congress generally appropriated lump sums to the postal department to cover deficiencies for broad expense categories like furniture and payroll, with discretion over geographic allocation residing in the executive branch (Rogowski Reference Rogowski2016).) We also exclude land grants, an alternative source of federal investment in infrastructure. These investments involved the transfer of lands located in federal territories to private companies (for example, railroads) or states (for example, in the case of land grant colleges), preventing us from assessing their effects on specific congressional districts.
Second, we focus on congressional appropriations and their relationship to the electoral connection, to the apparent exclusion of both the actual expenditures that followed these appropriations and the project authorizations that preceded them. We do not examine ultimate expenditures because discretion over expenditure timing and levels (subject to upper limits imposed by the appropriation) lay not with Congress but with the implementing agency or department.Footnote 14 With regard to authorizations, while legislation authorizing programs and activities is typically separate from legislation appropriating the funds for those projects, this is not always the case (Heniff Reference Heniff2012) and in fact was overwhelmingly not the case for the projects we consider. Instead, funding for new projects was often authorized and appropriated in the same statute, or even the same provision—and the many recurrent appropriations in our data only needed the earlier initial authorization.
Other data sources
To test a number of hypotheses derived from the accounts of distributive politics and policymaking detailed above, we joined information from a host of other sources to these appropriations data. In addition to commonly available data on, for example, majority party status, we include information on Common Space DW-NOMINATE scores and party membership for individual legislators (Poole et al. Reference Poole, Carroll, Lewis, Lo, McCarty and Rosenthal2013), historical data on the circumstances of each legislator’s tenure and their departures from office (Swift et al. Reference Swift, Brookshire, Canon, Fink, Hibbing, Humes, Malbin and Martis2009), data on committee membership (Canon, Nelson, and Stewart Reference Canon, Nelson and Stewart1998), data on election dates (Dubin Reference Dubin1998),Footnote 15 which varied considerably during this period, and information on district-level competitiveness from 1840 onward (Querubin and Snyder Reference Querubin and Snyder2013). We also examine patterns of voting in the 22 recorded roll-call votes on local appropriation bills from this period (most of the relevant legislation passed by voice vote); roll-call data are from voteview.com.
Empirical Approach
Our newly collected data permit us to examine the politics surrounding nineteenth-century local appropriations with a specificity (given the discrete appropriations) and breadth (given the long time period) previously impossible. Our analysis proceeds in three steps. First, we examine the antecedents of district-level spending, testing a number of hypotheses drawn from the accounts of distributive politics described above. We do so in the context of a series of decade-specific fixed-effect regressions of the form
 $$\begin{equation*}
\ln (1+y_{it}) = \alpha _i^d + \tau _t+X_{it}\beta ^d + \varepsilon _{it},
\end{equation*}$$
where y it is the appropriation to district i in congressional session t, αdi is a district-specific fixed effect corresponding to a unique geographically defined Footnote 16 congressional district in decade d, τt is a congressional session-specific effect, X it is a vector of covariates described presently, βd a decade-specific vector of parameters, and εit a (possibly heteroscedastic) error term. The purpose of disaggregating the data by decade is to ascertain the extent to which the politics of local appropriations evolved over the period under scrutiny. That said, owing to the paucity of local appropriations in the 1790s, 1800s, and 1810s, we exclude those decades from this part of the analysis. District-specific effects account for all time-invariant physical, economic, and demographic features of districts likely to affect appropriations, while session-specific effects account for any cyclical variation within a Congress or longer-term secular trends.
The first hypothesis we test concerns the timing of expenditures. Any account of the electoral connection that posits credit-claiming would anticipate appropriations occurring when credit-claiming was possible—namely, before a legislator’s election. In the nineteenth century, however, the existence of a lame duck session in the first several months of odd years, as well as substantial variation in the timing of congressional elections (see, e.g., Carson et al. Reference Carson, Jenkins, Rohde and Souva2001; James Reference James2007), meant that districts could conceivably benefit from appropriations made after their representatives stood for election. Accordingly, we assess whether a member’s district was more likely to receive appropriations before his election than after.Footnote 17
We also consider the value of individual legislators as coalition partners in multidimensional or intertemporal logrolls and its effect on appropriations in those legislators’ districts. While we cannot observe specific deals struck or promises made, we would anticipate that the value of a legislator as a coalition partner would diminish if that legislator was known to be exiting the chamber (that is, a lame duck), particularly if his replacement belonged to a different political party (so that promises could not be honored by a copartisan replacement). We also consider the legislator’s status as a member of the majority party and, in line with Evans’s account, his ideological distance from the median member of the House.
The last two hypotheses we examine relate to the effect of a member of Congress’s committee membership and/or the electoral competitiveness of his district on his ability to obtain local appropriations. With respect to the former, we test the effect of a congressman’s membership in a committee with appropriation powers on coterminous appropriation spending in his district. With respect to the latter, using data available for the last four decades of our sample, we examine the effect of a district’s prior electoral competitiveness on subsequent spending in that district (before the next election takes place), the idea being that credit-claiming would be particularly important for members in unsafe seats. To be sure, the relationship between competitiveness and spending may be endogenous (Gordon and Huber Reference Gordon and Huber2007); with this in mind, it is important to interpret the coefficient on this covariate as descriptive rather than causal.
After discussing the results of these tests, we proceed to the second part of our analysis, in which we assess the degree to which the predictions generated by both stark minimum-winning and universalistic coalition theories manifest in our data. Both theories imply that the number of legislators benefiting from local appropriations should always exceed 50% of the chamber: if the number of legislators benefiting from these appropriations consistently falls short of that threshold, it suggests that legislators’ support for enacted distributive legislation was not driven primarily by standard within-district credit-claiming motives.Footnote 18
Finally, in the last part of the analysis, we shift focus from the appropriations themselves to assessing the antecedents of legislative support for appropriating/authorizing legislation. Specifically, we assess support for local appropriations as a function of whether the relevant legislation benefited a member’s own district, nearby districts, or districts in his home state; regional considerations (discussed in greater detail below); and the revealed ideological preferences of legislators. We then examine the spatial structure of support for appropriations and its evolution over time.
RESULTS
The Antecedents of District-Level Spending
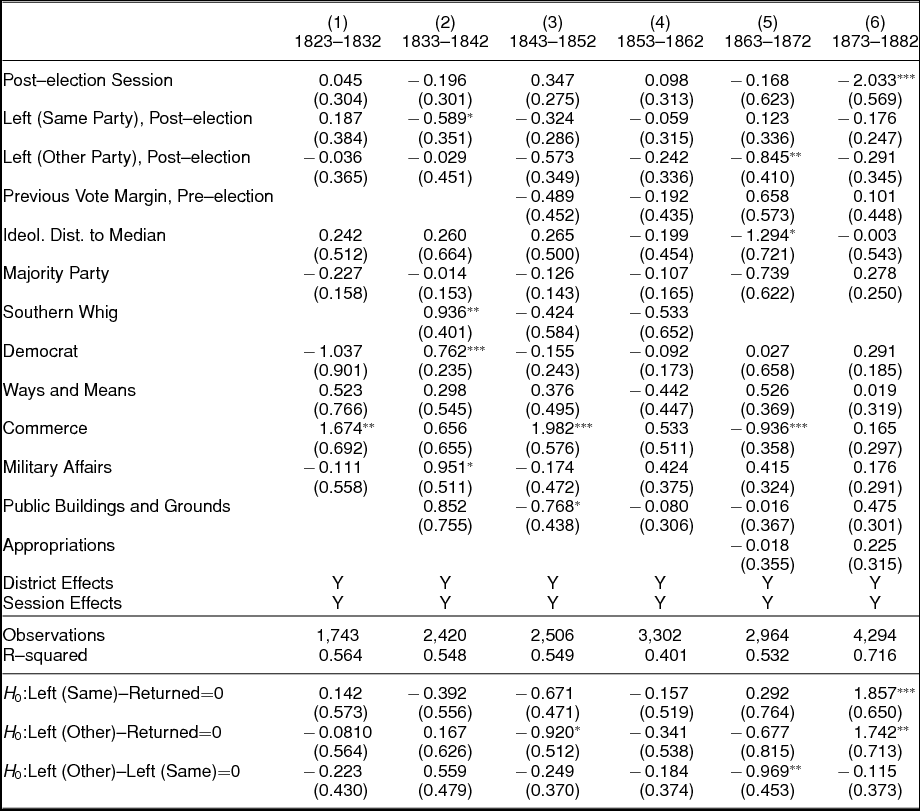
Coefficient estimates for the fixed-effect regressions described above appear in Table 2. The dependent variable is the natural logarithm of total appropriations (plus one) to district i in congressional session t, disaggregated by decade (and restricting attention to single-member districts). The set of covariates includes indicators for whether the session followed the congressional election in the district (excluded category is preelection),Footnote 19 and for whether the member left Congress and was replaced by a member of the same party, or left and was replaced by a member of a different party (excluded category is returned in the next session). We also include a measure of the vote margin by which each member won in the previous election (subject to data availability), his ideological distance to the median in the House, and an indicator for whether he was a member of the majority party. To examine a historical claim that Southern Whigs benefited disproportionately from local appropriations during the second party system (in effect being bought off for their support of the tariff), we include an indicator variable for these members in the 1830s, ’40s, and ’50s.Footnote 20 We also include a measure for Democratic party membership, and a vector of committee membership dummies.
Political Antecedents of Local Appropriations by District and Session.

Notes: Dependent variable is the natural logarithm of congressional appropriations (plus one). 1863–1872 regression excludes Confederacy. Robust standard errors in parentheses. *** p<0.01, ** p<0.05, * p<0.1.
A perusal of the coefficient estimates suggests that the political status of individual legislators plays little role in determining the magnitude of expenditures in their districts. First, note that, until the final decade of our analysis, a member was no more likely to receive appropriations in a session after his election than before. This appears to shift in the 1873–1882 analysis. There, we see estimates consistent with the dynamic account described above: during this decade, members tended to get approximately 85% lessFootnote 21 after their election than before. Note that neither the null findings in the first five decades nor the positive findings in the last decade are an artifact of appropriations stacking up in particular sessions. Because our specification includes session-specific effects, the estimate is identified off of the irregular timing of congressional elections during the period: within a given session, some legislators might be pre- or post-election.
Second, we examine whether a member known to be exiting the chamber (owing to replacement or rotation) received fewer funds for his district than those returning to the chamber. Because this analysis requires holding fixed the post-election status of the representative, the relevant hypotheses concern linear combinations of parameters. The associated statistical tests appear at the bottom of Table 2. We find that until the 1860s, whether a member was or was not departing Congress (and the nature of his departure) generally bore no relationship to post-election spending in his district. This changed by the 1860s, but in unexpected ways. In the 1860s, we find that members awaiting replacement by partisan opponents received (statistically) significantly less appropriations than those who were leaving via rotation; in the 1870s, departing members received more post-election appropriations than returning ones, irrespective of the partisanship of their replacements.
We find no significant relationship between a representative’s previous vote margin, ideological distance to median, or majority party status on appropriations, regardless of decade. Being a Southern Whig or Democrat appeared to have had salutary effects in the 1830s. Finally, we observe sporadically significant coefficients on committee membership variables, but these are as likely to be negative as they are to be positive.
We conclude this section by noting that, although we find that the relationships between politically relevant covariates and appropriations during this period tended to be weak, the overall fit of the models is surprisingly strong. This is owing to the strong combined predictive power of the district- and session-specific effects. Viewed in this light, we ought not dismiss those effects as nuisance parameters: rather, their predictive capacity suggests that time-invariant characteristics of districts, and secular trends in overall demand for local appropriations, played a far more important role in the allocation of local spending during this period than the political attributes of individual members of Congress.Footnote 22
The Scope of Distributions
Next, we assess the predictions of distributive accounts concerning the size of the set of legislators directly benefiting from local appropriations. To determine the size of these coalitions, we adopt a conservative strategy: Rather than examine the number of direct beneficiaries from specific pieces of legislation (for example, a Rivers and Harbors Bill), we aggregated the total number of legislators directly benefiting from all local appropriations in a given legislative session and dividing it by the total number of seats in the House. In this way, we establish an upper bound on coalition size that allows for informal logrolls across local appropriation bills in a session, of the sort, “You vote for my dredging project today, and I will support your courthouse construction tomorrow.”
During the nineteenth century, a number of states employed various representation schemes that departed from single-member districting. To address this, we adopt the following coding rules: in states with multimember districts, all members representing a district benefiting from an expenditure were coded as direct beneficiaries. In states with general tickets, all legislators in the state were counted as benefiting from projects within the state’s borders. In states with one or more at-large member and other legislators within the state representing districts, at-large members were coded as benefiting from any project within the state’s borders, irrespective of district.
The fraction of direct beneficiaries by session is illustrated in Figure 3. The data are striking: even with our conservative aggregation rules, in only three of the 116 sessions before the lame duck session of the 41st Congress in 1871 did the fraction of beneficiaries in the House exceed 50%—two of these, in the first and second sessions of the 24th Congress (during the final years of the Jackson administration) provided such a wide distribution as to forestall a veto. Until the 41st Congress, the average proportion of legislators obtaining funding in a given session was around 13%. When the results are aggregated by Congress, the results are similar: in only four of the first 40 Congresses did the number of legislators directly benefiting from local appropriations exceed 50%, and the average fraction of beneficiaries during this period was around 27%.
Fraction of Beneficiaries by Congressional Session.

Patterns of Support for Local Appropriations Bills
Preliminary Analysis
The results above imply that throughout the nineteenth century, congressional majorities routinely appropriated funds that directly benefited only a minority of districts. This suggests that a sizable number of legislators whose districts did not directly benefit nonetheless believed that they were benefiting in some other respect. One obvious potential source of support for infrastructure appropriations would have been anticipated positive spillovers in the form of improvements to commerce or economic growth generally. The pattern of such spillovers need not reduce to geographic proximity: for example, a member of Congress representing a rural district in Ohio might have supported a rivers and harbors project to remove a sandbar at the mouth of the Mississippi if it meant potentially reducing the cost of bringing his crops to market.
We scoured descriptions of individual roll-call votes from 1820 to 1881 to locate recorded final passage votes on local appropriation bills in the House. Unfortunately, the vast majority of votes on the appropriations described above were unrecorded. However, we were able to locate 22 separate roll-call votes for the period: eight on navigational aides (lighthouses, beacons, and buoys), eight on river and harbor improvements, one on public buildings, and five on forts, arsenals, and armories.
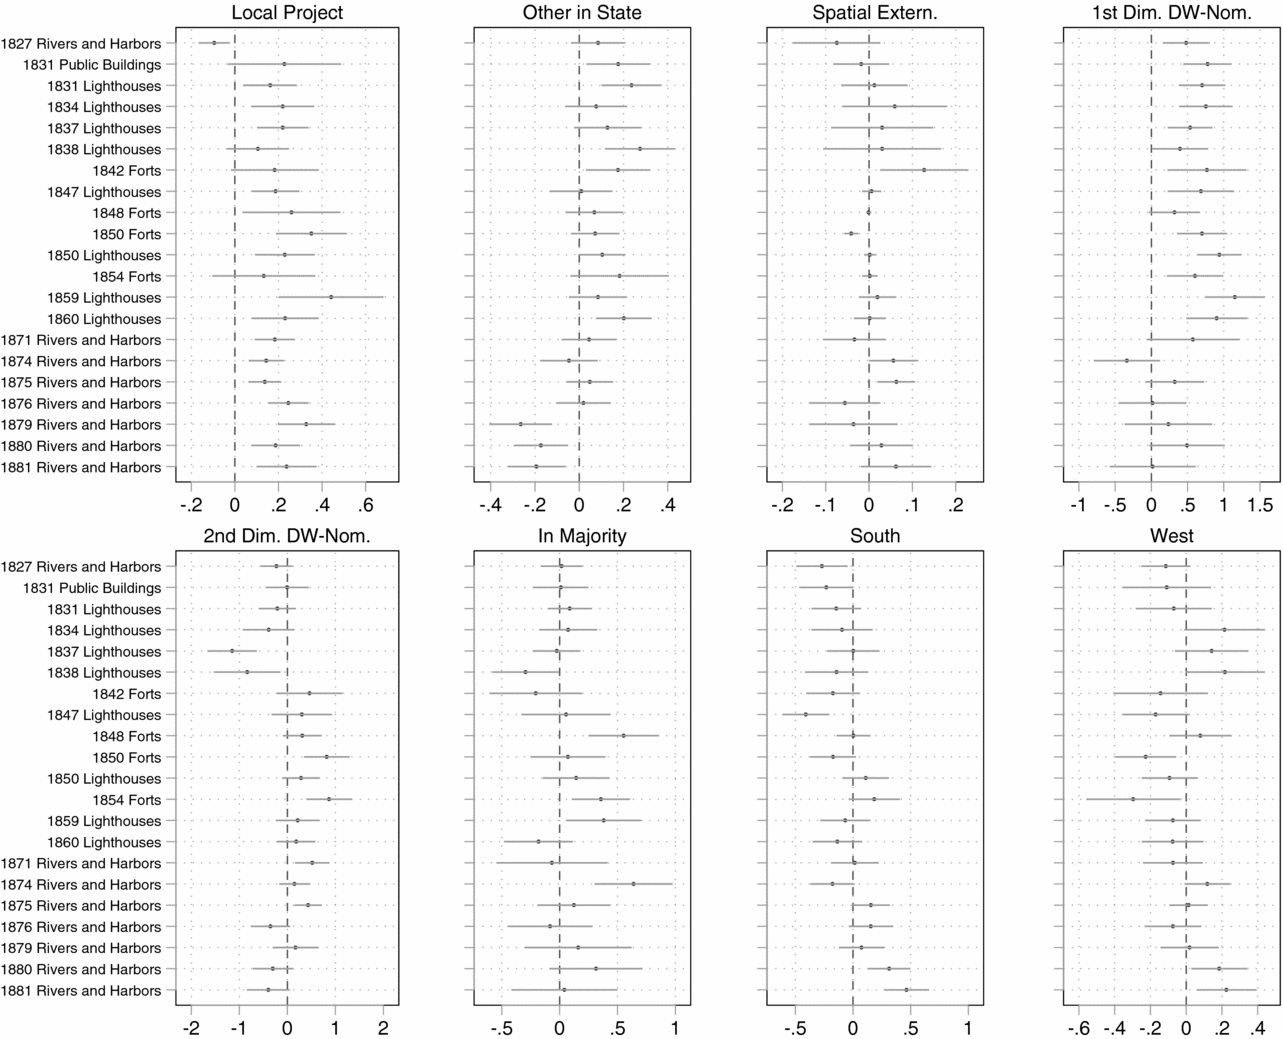
For 21 of these recorded roll calls (the 22nd was near unanimous), we regress a legislator’s vote on eight measures. The first, local project, is an indicator whether the bill appropriated funds to the legislator’s district. The second two are measures of geographic externalities: other in state measures whether any other district in the legislator’s state benefited from an appropriation; while spatial externality is a weighted sum of all projects in the bill, with the weights inversely proportional to the linear geographic distance from the centroid of the legislator’s district to the centroid of the districts in which other projects were located.Footnote 23 To capture the ideology of legislators, we include the first and second dimension DW-NOMINATE scores of the legislators. (During periods of partisan stability, the first dimension can be interpreted as an index of partisanship, with higher values corresponding to strong Whig/Republican.) Finally, we include indicator variables for whether the legislator was a member of the majority party; an indicator for South (coded one if the legislator came from one of the eventual or former eleven states of the confederacy); and an indicator for West (coded one if the legislator came from a nonsouthern state beyond the western frontier of the original thirteen). The importance of these regional indicators will become clear shortly. To economize on space, we report the 168 coefficients (21 votes × 8 covariates) in Figure 4, which displays coefficient estimates and associated 95% confidence intervals graphically. For ease of interpretation, we report estimates from linear probability models with robust standard errors.Footnote 24
Predicting Support for Local Appropriations Spending in the House, 1827–1881.

Four patterns are evident from the results displayed in the figure. First, after the Rivers and Harbors Bill of 1827, receiving funding for a local project consistently increased the probability of a yea vote, generally by around 20 percentage points. Second, evidence of geographic spillovers is mixed: in the prebellum period, we observe consistent evidence that the presence of a project in one’s home state (not in one’s own district) increased the likelihood of a favorable vote on an appropriations bill. This pattern disappears after the Civil War, however. By contrast, the spatial externality measure has a statistically significant effect on the probability of a yea vote for just one of the 21—about what we would expect by random chance. We also see only sporadic effects of being in the majority party—indeed, eight of the prebellum votes were instances in which the Democratic majority was rolled by strong Whig support and Democratic defections.
Third, ideology (as captured by DW-NOMINATE scores) appears to play a strong role in predicting support for these bills before the war.Footnote 25 With the exception of the 1848 appropriation for forts, arsenals, and armories, tests of the joint significance of the first and second dimension DW-NOMINATE scores consistently reject the null hypothesis of no spatial component to voting in the prebellum era. Things change during Reconstruction—in four of seven votes, we cannot reject the null. Because regression offers an incomplete picture of variation in the predictive power of the ideological measures, we explore the spatial structure of voting on these bills in greater detail below.
The final pattern of interest is the changing nature of regional support for federal infrastructure spending. Through 1874, and conditional on other factors, representing a district in the South had a negative effect on support for these appropriations (with the exception of the 1854 forts, arsenals, and armories appropriation). This appears to change abruptly in 1875, with southerners significantly more likely to support river and harbor appropriations. Relatedly, a statistically significant positive relationship between support for local appropriations and coming from the West emerges only in the last two votes in our sample.
The Spatial Mapping of Support for Local Appropriations and its Collapse
We now consider the spatial structure of voting on local appropriation bills in greater detail. Figure 5 shows ideological maps of all 22 roll calls, in chronological order. Each token represents an individual legislator’s two-dimensional DW-NOMINATE score. Black tokens correspond to yea votes on the bill, and white to nay votes. The solid dots denote legislators representing districts that did not receive any appropriation in their district (or state for statewide representatives), while the hollow circles represent legislators who did receive local funding, with the size of the circle proportional to the amount appropriated. Estimated cutting lines (corresponding to hypothetical ideal points of indifferent legislators) are also plotted when identified.
Ideological Divisions and Support for Local Appropriations on Selected Bills, 1827–1881

The preponderance of solid black dots indicates that many legislators voting in support of these bills did not receive immediate benefits in their districts. Still more interesting is the existence of white hollow circles: these represent legislators who opposed the bill despite the bill appropriating funds to their own districts. Although they are few in number, such “no thank you” legislators appear as late as 1854 in the prebellum era, and in a handful of river and harbor votes post war.
Turning our attention to the structure of support and opposition, the sequence of figures provides visual evidence that in the prebellum period, and with only one exception (the 1854 Forts, Arsenals, and Armories Bill), appropriations map fairly cleanly onto the ideological structure of the House, and, in particular, onto the first dimension. Although the position and angle of the line dividing yea and nay shifts over time, the figures display support for appropriations on the right (Anti-Jacksonians, later Whigs and still later Republicans) and opposition on the left (Democrats). This pattern persists into the 1870s, but sharply declines with the 1876 Rivers and Harbors Bill. Henceforth, we observe a clear shift to bipartisan support for this legislation.
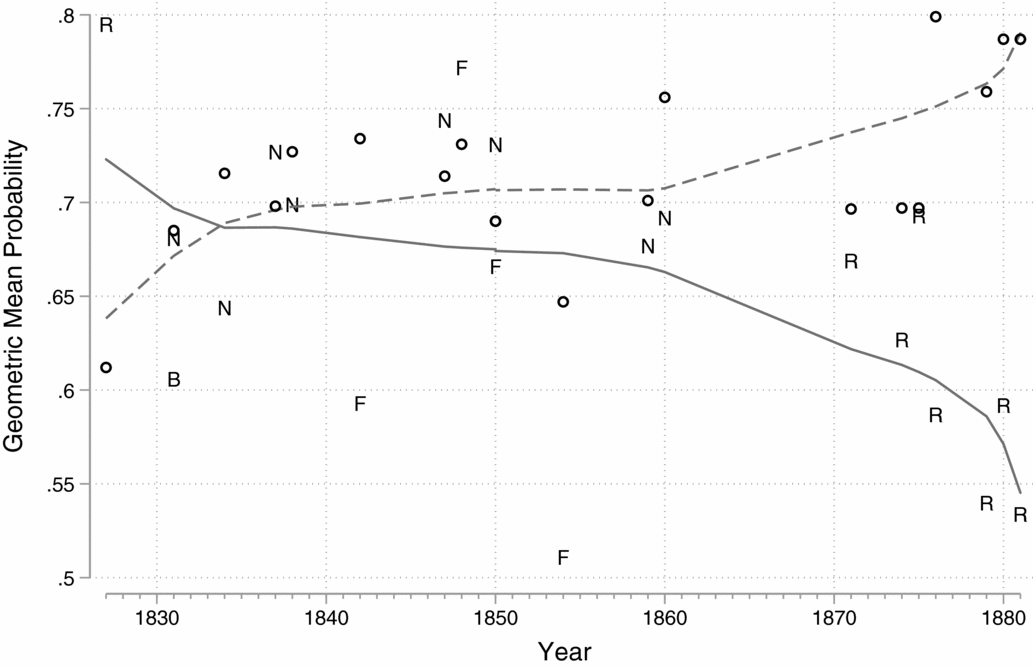
Visual inspection can only take us so far. To conduct a more rigorous analysis of the fit of the ideological model, we plot the geometric mean probability (GMP) for each recorded vote in Figure 6.Footnote 26 GMP is an intuitive measure of the fit of the spatial model for a particular vote, ranging from 0.5 (no fit) to 1 (perfect fit), and is recommended by Poole (Reference Poole2005) for its ease of use in comparing across different legislative settings.
Fit of the Spatial Model on Selected Roll Calls, 1827–1881

Letter tokens in the plot correspond to votes graphed in the preceding figure, with N denoting navigational aides; B, public buildings; F, forts, arsenals, and armories; and R, rivers and harbors. The plot confirms the visual evidence from Figure 5 and the regression analysis: With the exception of the 1854 vote, the spatial model performs well at predicting votes for most of the period, but its performance drops dramatically in the 1870s. Also note that, for most of this period, votes on public buildings and forts are less ideological than those on navigational aides, rivers, and harbors. A (solid black) lowess curve capturing the overall decline is also depicted.
Of course, it could be the case that this decline is coincident with trends in Congress more generally: perhaps Congress was experiencing a broader ideological depolarization trend during this period. The evidence suggests otherwise. The hollow circles (and dashed lowess curve) on the plot denote the arithmetic average GMP for all non-unanimous votes taken in the congresses in which those 22 recorded appropriations votes took place. The data suggest that the pattern for Congress overall is one of increasing ideological clarity—precisely the opposite of the pattern for appropriation votes.
A possible objection to the foregoing analysis of roll calls is that it is susceptible to selection bias: perhaps the patterns of support for bills on which no roll calls were recorded resembled the universalism associated with the 1870s and 1880s, rather than the more divisive patterns of earlier periods. While we cannot dismiss this possibility out of hand, two observations mitigate this concern. The first is our finding above concerning coalitions of beneficiaries: even if it were the case that these bills passed with widespread approval, it remains the case that they tended to benefit only small minorities of districts. Therefore, it is critical to interpret our results on patterns of roll-call voting not in isolation, but rather in conjunction with those other findings. Second, the infrequency of roll-call voting independently undermines the credit-claiming account, as it implies (per Article I, Section 5 of the Constitution) that fewer than one-fifth of those present desired to have their positions recorded (which would be one way to claim credit).
DISCUSSION
Interpreting Changes in the Structure of Support
The disintegration of the ideological structure of roll-call voting on local appropriation bills in the late nineteenth century is suggestive of a kind of issue devolution: By the 1870s, the issue of local appropriations became untethered from the basic ideological structure of national politics, in stark contrast with issue evolution as described in Carmines and Stimson (Reference Carmines and Stimson1989). What accounts for the timing of this shift? Our data point to the critical importance of the 1874 election, when, on the heels of the Panic of the preceding year, Democrats took control of Congress for the first time since before the Civil War. This election marked a major blow against the so-called carpetbagger Republicans dominating the congressional delegations of ex-Confederate Southern states recently readmitted to the union, and the beginnings of the emergence of the one-party South. In essence, Republicans continued to support these appropriations after the Democrats came to power, and Democrats—particularly those in the South—began to support them once they came to power.
A driving force in the change among Democrats—who, after all, consistently opposed internal improvement bills even when holding majorities in the prebellum Congress—was economic: as described by Woodward (Reference Woodward1951), the Civil War and its aftermath left numerous Southern ports and the mouths of the Mississippi obstructed and in disrepair; this, combined with large federal subsidies for Northern transcontinental railroads, led the South to demand a seat at the “great barbecue” (see also Seip Reference Seip1983; Harris Reference Harris1976).Footnote 27
A comparison between votes on river and harbor bills in the 43rd (1873–75) and 44th (1875–77) Congresses is instructive. First, the South had been voting for internal improvements before the Democrats took control: 59% of Southern legislators supported the 1874 bill, and 79% voted for the 1875 iteration. These aggregate figures, however, draw an incomplete picture, obscuring the partisan breakdown of the vote. In the early to mid-1870s, the congressional delegations of Southern states readmitted to the union were heavily Republican, and those legislators, like their copartisans from other regions of the country, overwhelmingly supported infrastructure bills. Democratic Southern legislators opposed the 1874 bill, voting 24–12 against. The Republican majority only required a handful of Democratic votes to get above 50%. The 1875 bill, passed in the lame duck session, contained significantly more appropriations for Southern projects (37% vs. 27%); Southern Democrats voted in its favor, with 25 in favor and 14 opposed. Democrats from other areas of the country maintained their opposition, however, voting 19–17 against. This accounts for the continued predictive power of the ideological model (as measured by GMP) for the 1874 bill. Moreover, the Republicans would have had the votes for that bill even if no Democrats had voted in support.
The 1876 Rivers and Harbors Bill was the first such legislation of the Democratic-controlled 44th Congress to become law. It was at this point that Democrats from all regions joined in support of a bill appropriating federal funds for local projects. Southern Democrats were the strongest supporters, with 49 in favor and 8 opposed; however, 51 of 79 Democrats from outside of the South supported the bill as well. At the same time, a majority of Republicans from the Northeast, West, and (those remaining from the) South also supported the bill. This was necessary: the number of Democrats from the North and West in opposition was large enough that the bill's passage required Republican support. With support coming from both sides of the aisle, and from all regions, the ideological structure of these local appropriations collapsed, and the universalistic pork-barrel coalition, conventionally understood, was born.
Interestingly, Woodward (Reference Woodward1951) argues that the 45th Congress saw Southern Democrats finally realizing distributive gains for their region as an implicit component of the Compromise of 1877. Indeed, so-called Redeemer Democrats introduced 267 internal improvement bills from October of 1877 to the Christmas recess (p. 233), and Louisiana received the most public works funding of any state that year. Our analysis is more consistent with Harris (Reference Harris1976), who argues that the shift in Southern Democrats' support for, and acquisition of, river and harbor spending was underway before the compromise took place.
Changes on the Supply Side: The Capacity Ratchet
With only a handful of exceptions, until the mid-1870s, congressional appropriations for local projects tended to directly materially benefit only a small number of legislative districts. Indeed, our findings are consistent with a gradual increase in the proportion of legislators obtaining local spending over the course of the century—an increase eventually “capped” at the universalistic levels observed in the late nineteenth and early twentieth centuries.
Our discussion above suggested that this evolution may be explained by changes in the demand for local appropriations. A more prosaic interpretation can be found on the supply side: projects, once begun, required recurrent funding for upkeep and operations. Over time, the number of districts where at least one project existed ratcheted upwards. As the federal government’s funding capacity grew (and as the total number of projects increased), both the number of projects needing maintenance in any given year and the government’s ability to fund such maintenance increased. By the 1870s, enough projects needed, and received, consistent maintenance to generate a significantly “oversized” distribution of benefits at the district level.
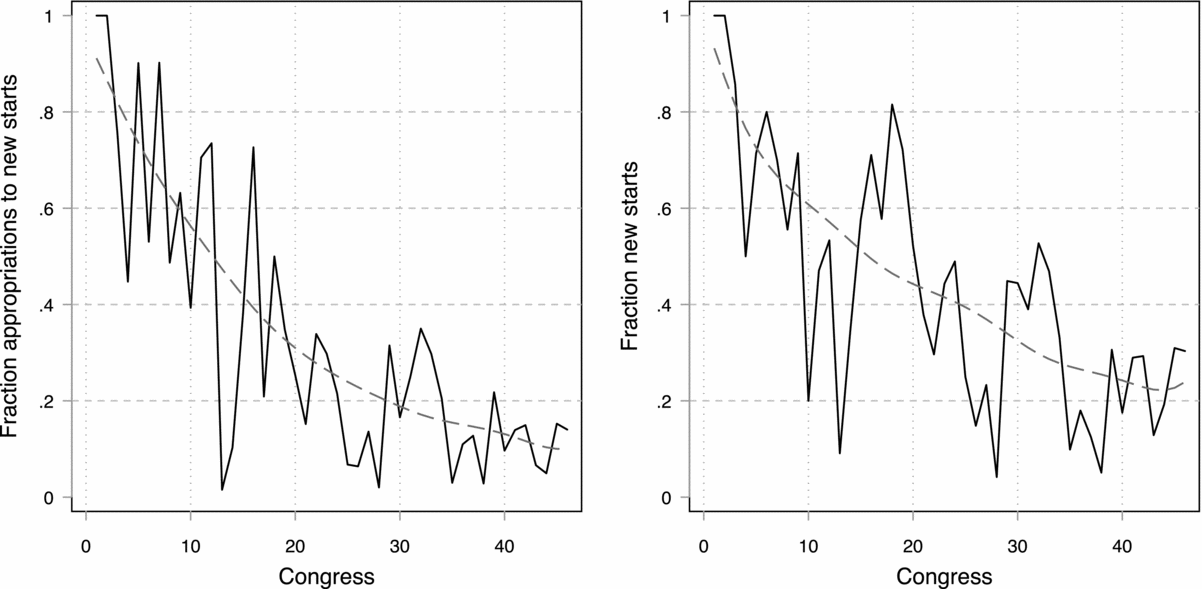
Figure 7 presents evidence in favor of this conjecture: as the nineteenth century progressed, the proportion of congressional appropriations going to new projects decreased from a high of nearly 90% in the early 1800s (interrupted by the War of 1812) and 1810s to an approximate low of 10–15% in the 1880s. As the two panels of the graph indicate, this decline is evident whether one examines the fraction of appropriations going to new starts or the fraction of discrete projects that were themselves new starts.
Fraction of Appropriations to New Projects, by Congress

CONCLUSION
Accounts of the politics of local appropriations in the nineteenth-century United States from Jackson onward have helped to motivate the development of a number of theories of distributive politics and coalition building. In this paper, we present a newly assembled dataset of local congressional appropriations in the nineteenth century that calls into question both these accounts and the theories that followed. In particular, we show that local appropriations during this period departed from quintessential “pork-barrel” politics in several respects: they benefited relatively few districts directly until the 1870s, and their allocation was largely independent of the electoral competitiveness of those districts, the dynamics of the election cycle, and the institutional positions of legislators. Instead, until the 1870s, support for local appropriations mapped cleanly onto the partisan structure of Congress: Receiving spending for a project in one’s district was a strong predictor for a yea vote on an appropriations bill, but even more so was a legislator’s membership in the Anti-Jacksonian/Whig/Republican coalition. By the mid-1870s, however, partisan splits on infrastructure investment collapsed, yielding universalistic patterns more in line with the theoretical expectations of canonical models of distributive politics. We trace this evolution to two features of the political economy at the time: a “demand-side” factor—the coincidence of a desire by southern legislators to use federal dollars to finance spending on infrastructure damaged during the Civil War, and the emergence of the solid Democratic South—and a “supply-side” factor, the growth of recurrent expenditures to finance extant projects.
Taken together, our findings imply that the line separating pork-barrel and programmatic politics is not always as sharp as might be believed. By documenting an extended period of U.S. political history in which archetypal pork-barrel spending was coincident with a structured, ideological pattern of legislative conflict, our research demonstrates the need for a more refined view of when quintessentially distributive policies give rise to analogous politics – and when they do not. This suggests the value of attention to the broader macropolitical conditions that lead to the demand for and supply of such policies.
SUPPLEMENTARY MATERIAL
To view supplementary material for this article, please visit https://doi.org/10.1017/S000305541800014X.
Replication material can be found on Dataverse at: https://doi.org/10.7910/DVN/SAPQYS.







Comments
No Comments have been published for this article.