1. Introduction
In April 2023, the European Commission published its legislative proposal on the reform of the Stability and Growth Pact (SGP; European Commission, 2023). The General Escape Clause had earlier been extended for 2023 and the rules of the SGP are to be re-applied from 2024 onwards. The reform debate was taken up by the German government with the publication of a non-paper outlining its general principles underlying the reform debate. While the German government in general wants to stick with the major elements of the existing SGP rules, it openly acknowledges the overly ambitious and hence unrealistic debt reduction requirements and wants to put a larger emphasis on the expenditure rule (Federal Government, 2022). Overall, there seems to be at least some room for more flexible European Union (EU) fiscal rules.
Against this background, this paper uses the macroeconometric multicountry model NiGEM to simulate the macroeconomic implications of the most relevant reform options from 2024 onwards. Next to a return to the existing and unreformed rules based on achieving the so-called medium-term objective (MTO) for the structural balance and ensuring an adequate adjustment path towards this objective, the most prominent options include an expenditure rule linked to a debt anchor. Here we consider the proposals made by the European Fiscal Board (EFB) and the Institut für Makroökonomie und Konjunkturforschung (IMK) (Dullien et al., Reference Dullien, Paetz, Watt and Watzka2020; European Fiscal Board, 2018, 2020).
Our results for the euro area and its four biggest economies, France, Italy, Germany, and Spain, indicate that returning to the existing rules of the SGP would lead to severe cuts in public spending. This holds particularly if the existing SGP rules were to be interpreted as they were in the past. A more flexible interpretation of the rules would only somewhat ease the fiscal adjustment burden. Introducing an expenditure rule along the lines of the EFB would, however, not necessarily and by itself alleviate the fiscal adjustment burden. Instead, our simulations show that great care must be taken to appropriately specify the expenditure rule, such that fiscal consolidation is achieved in a growth-friendly way. Raising the debt target to 90% and applying less demanding fiscal adjustments as proposed by the IMK would go a long way in achieving this goal. For the euro area, our results indicate that the additional yearly gross domestic product (GDP) of such a reform would correspond to almost 60 bn Euro in 2024, rising to 230 bn Euro in the 2030s, all in 2015 prices compared to when the SGP continues to be applied as in the past. This corresponds to approximately 0.5% and 1.8% of euro area GDP in the respective periods.
2. Reform options for the SGP: The role of expenditure rules
One key element in the EU Commission’s orientation on reforming the SGP concerns shifting the main operational target of annual fiscal policy from structural balance restrictions to an expenditure rule.Footnote 1 Before introducing key proposals for expenditure rules, it is necessary to evaluate the fiscal adjustment needs for the coming years resulting from the current SGP framework.
2.1. Back to the SGP status quo ante and fiscal adjustment needs
One objective of this paper is to compare the macroeconomic effects of the implementation of an expenditure rule with the effects of the adjustment needs from returning to an unreformed SGP. As pointed out in the introduction, the EU fiscal rules are still suspended in 2023, but will be back in place from 2024 onwards.
Determining the fiscal adjustment needs from the current SGP is far from straightforward. The fiscal rulebook in the EU has never been simple in the past, and it has become excessively complex over time.Footnote 2 Indicators such as the structural deficit are not directly observable and frequently revised. Additionally, the latest reforms of the rules have allowed for more flexibility. Not seldom, past adjustment requirements derived from a flexible interpretation of the rules. Therefore, it is rather difficult to disentangle which of the many EU fiscal constraints will be binding for the different member countries from 2024 onwards.
In our simulations, we assume that starting in 2024 government consumption expenditures of each country are reduced to reach the annual budget deficit targets as given by Darvas and Wolff (Reference Darvas and Wolff2021). When calculating the fiscal adjustment needs, the authors use two different interpretations of the current SGP deficit rules: a restrictive interpretation based on the practice of the past decade (historical scenario) and a more flexible interpretation (flexible scenario).Footnote 3
Both scenarios rely on official estimates by the European Commission for potential output and structural deficits and distinguish between the corrective arm (excessive deficit procedure) and the preventive arm of the SGP. For EU countries that fall under the excessive deficit procedure, the historical scenario requires them to correct their excessive deficits within 3 years and bring their structural deficits down to 2.5% of GDP. In the flexible scenario, those countries are given more time to adjust their excessive deficits and are assumed to reduce their structural deficits by 0.5% per year.Footnote 4 Under the preventive arm, the historical scenario assumes countries with public debt ratios below 60% to reduce their structural deficit by 0.5 percentage points annually, while countries with higher debt-to-GDP ratios do so by more than 0.5 percentage points to reach the so-called MTO structural deficit of 0.5% of GDP within 4 years.Footnote 5 In the flexible scenario, Darvas and Wolff consider the adoption of the structural reform clause, which allows for a temporary deviation from the adjustment path towards the MTO because all EU countries will implement major structural reforms according to their recovery and resilience plans. Thus, all our scenarios also include the increases in public investment arising from the Next Generation EU (NGEU) funds as described in the national recovery and resilience plans and presented in Darvas and Wolff (Reference Darvas and Wolff2021).Footnote 6
It should be emphasised that the two scenarios abstract from the 1/20th debt reduction rule which requires member countries to close the gap between current debt levels and the 60% SGP target on average by 5% annually. In the past, violations of the debt reduction rule never led to excessive deficit procedures (Darvas and Wolff, Reference Darvas and Wolff2021).Footnote 7 Considering the 1/20th rule would significantly increase the fiscal consolidation shocks and hence the negative growth effects simulated below.
2.2. Introducing an expenditure rule: Proposals by the EFB and the IMK
The idea of an expenditure rule is to limit the growth rate of non-cyclical public expenditure to follow a steady path. The important advantage over deficit rules is that public spending is in direct control of governments and less dependent on external circumstances like the business cycle. As a consequence, the overall fiscal stance is considered to be more countercyclical and the economy therefore better stabilised around its potential output (Ayuso i Casals, Reference Ayuso i Casals2012; Brück and Zwiener, Reference Brück and Zwiener2006; Darvas et al., Reference Darvas, Martin and Ragot2018a; Paetz, Reference Paetz2020).
Cyclical government revenues can freely float around the expenditure path over the business cycle, allowing automatic stabilisers to take full effect, and thus leading to (higher) public deficits in the recession and (lower) deficits or surpluses in the boom. In general, this also holds for structural deficit rules, where nominal budget balances are corrected for cyclical fluctuations. However, all applied methods for calculating the exact position in the business cycle and thus the non-observable output gap and its corresponding structural budget balance face severe problems (Dullien et al., Reference Dullien, Paetz, Repasi, Watt and Watzka2022). Estimates of structural budget balances have therefore been frequently revised ex-post, in some cases even turning structural deficits into surpluses (Darvas et al., Reference Darvas, Martin and Ragot2018b). The method which can avoid these issues to a sufficiently satisfactory degree has still to be found.
Expenditure rules cannot completely exempt themselves from the calculation of potential GDP either. Typically, expenditure rules ensure that the growth rate of (primary) expenditure, net of discretionary revenue measures, is capped at the trend rate of potential output growth. Thus, expenditure rules require only estimates of the growth rate of potential output, not its level. Although estimates of the growth rate of potential output also suffer from revisions, these revisions tend to be smaller than those for its level and the corresponding output gap (Claeys et al., Reference Claeys, Darvas and Leandro2016). However, like the current EU fiscal rules, expenditure rules can in principle cause significant macroeconomic costs by depressing aggregate demand during a recession or boosting it during a boom. Specific design issues, especially in combination with the debt anchor, can have significant effects on the functioning and performance of expenditure rules. Illustrating these effects is one central aim of this paper.
A prominent advocate for the replacement of the structural deficit targets in the EU fiscal framework by an expenditure rule is the EFB (European Fiscal Board, 2018, 2020). However, special attention must be given to several factors in the design. This particularly concerns the question of which public spending subcategories fall under the expenditure target. For instance, does the target include interest payments, which cyclical expenses are considered, and how is public investment safeguarded. The reform proposal of the EFB allows for deviations from the expenditure target due to discretionary tax changes. It also contains an escape clause that allows member states to deviate from the target in the case of severe adverse economic shocks.
Similar to the EFB, the IMK also advocates an expenditure rule as the main operational target for the EU fiscal framework (Dullien et al., Reference Dullien, Paetz, Watt and Watzka2020). While the proposals share many similarities, they differ mainly in their choice of the debt reference value and the adjustment speeds towards that value.Footnote 8 The EFB takes the debt reference value to be the current 60% Maastricht ratio. The IMK instead recommends an increase of the reference value for the public debt-to-GDP ratio from 60% to 90% of GDP.Footnote 9 If the debt-to-GDP ratio exceeds the debt reference value in a country, an adjustment parameter ensures that public expenditure growth is curbed below the trend rate of potential output to reach the debt anchor within a given time horizon.
There is disagreement in the literature regarding the exact value of the adjustment parameter. The EFB discusses the possible differentiation of the adjustment speed depending on macroeconomic conditions, specifically on the interest rate-growth differential, and the actual debt level of the previous year (European Fiscal Board, 2020). The idea is that countries with high initial debt levels are allowed a relatively slower adjustment pace which should prevent them from having to undertake overly severe fiscal adjustments in the early years after the implementation of the expenditure rule. Accordingly, the EFB proposes varying adjustment parameters depending on initial debt ratios.
Table 1 shows the adjustment speeds to the debt anchor as proposed by the EFB and the IMK. Given that the interest rate-growth differential is forecasted to be negative over our simulation horizon, we apply the EFB scenario with the adjustment parameter values of 0.06 (so that the debt anchor would be reached within 15 years) for countries with an initial debt level between 60% and 100%, 0.05 for countries with an initial debt level between 100% and 150%, and 0.04 for countries with an initial debt level over 150% (European Fiscal Board, 2020, Table 5.3). The proposed increase in the debt reference ratio by the IMK needs to be accompanied by newly defined ranges of the initial debt-to-GDP ratio that determine the state-dependent adjustment parameter. Following the EFB, we propose an increasing parameter from higher to lower debt ratios. In particular, we recommend somewhat lower adjustment parameters compared to the EFB.Footnote 10 Specifically, we suggest an adjustment value of 0.04% for countries with debt levels between 90% and 120%, 0.0325% for countries with debt levels between 120% and 150%, and 0.025% for countries with debt levels above 150% (Table 1).

3. Simulation results
This paper focuses on the consolidation requirements and the speed of adjustment deriving from different parameter settings of an expenditure rule and compares them to the fiscal consolidation needs of a return to an unreformed SGP. We use the multicountry model NiGEM developed by the National Institute of Economic and Social Research (NIESR) to simulate the macroeconomic effects on the euro area and its four biggest economies, France, Italy, Germany, and Spain. NiGEM is a comprehensive simulation and forecasting model for the world economy that incorporates typical New Keynesian elements such as the formation of expectations by economic agents and price and wage rigidities. NiGEM models all OECD countries as well as numerous emerging economies and is designed to simulate their response to exogenous developments. The simulations also consider spill over effects arising from international trade as well as economic policy responses of monetary and fiscal policy to economic variables (Hantzsche et al., Reference Hantzsche, Lopresto and Young2018).
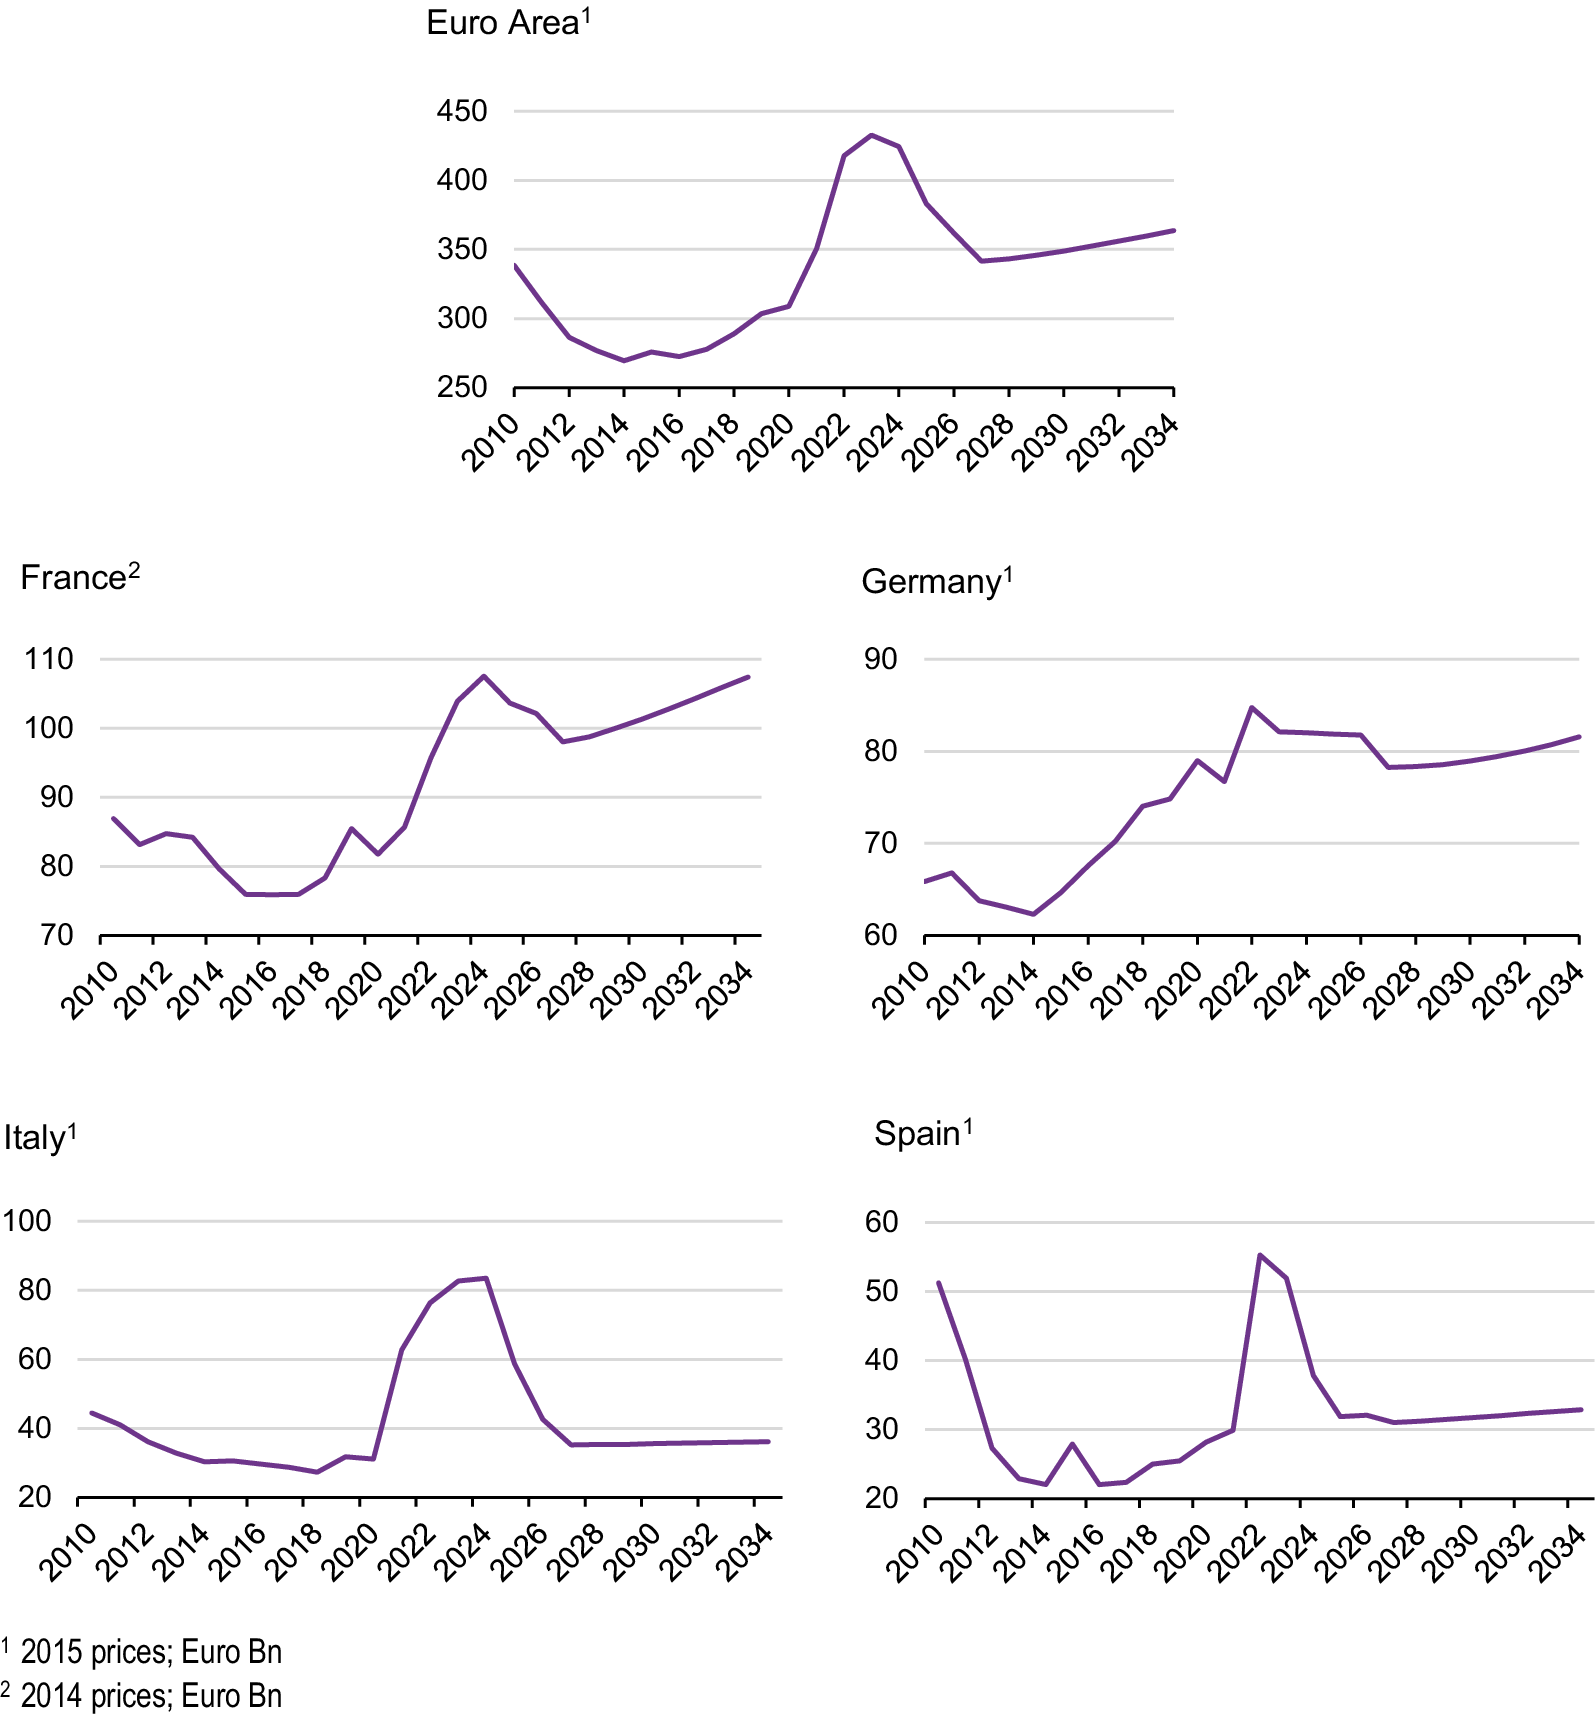
For the purpose of our simulations, we exogenously construct a path for government consumption expenditures (net of interest payments) corresponding to the various reform options. Our simulations start in 2024 with the re-application of the SGP and run until 2034. To better isolate the effects of the various reform proposals, we keep tax rates and government transfers exogenous. We also insulate the effects of monetary policy reaction by keeping ECB interest rates at their exogenous path. Finally, to account for the expansionary effects of NGEU we assume public investments during the years 2021–2026 are increased according to the national recovery and resilience plans (Figure A1 in the Appendix).Footnote 11
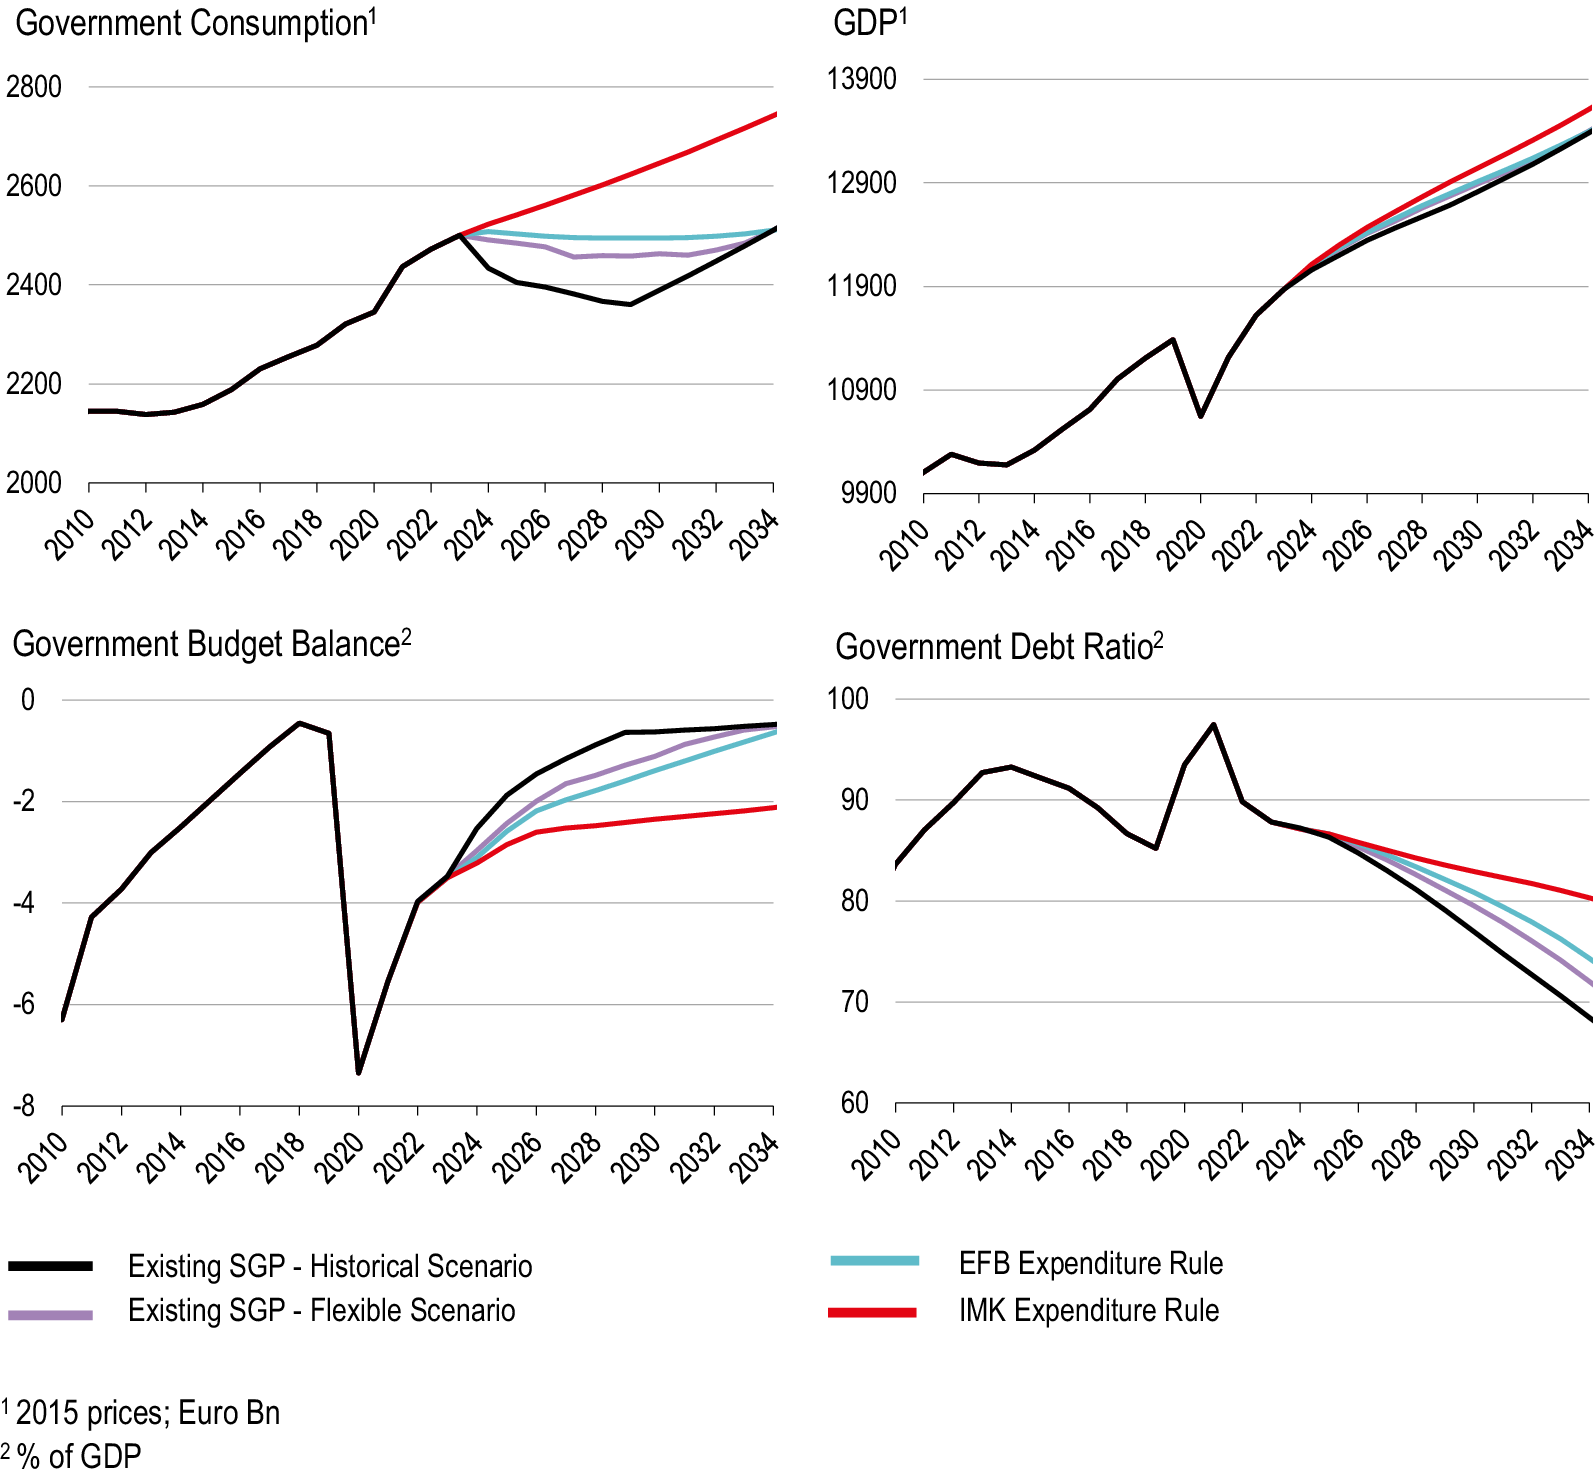
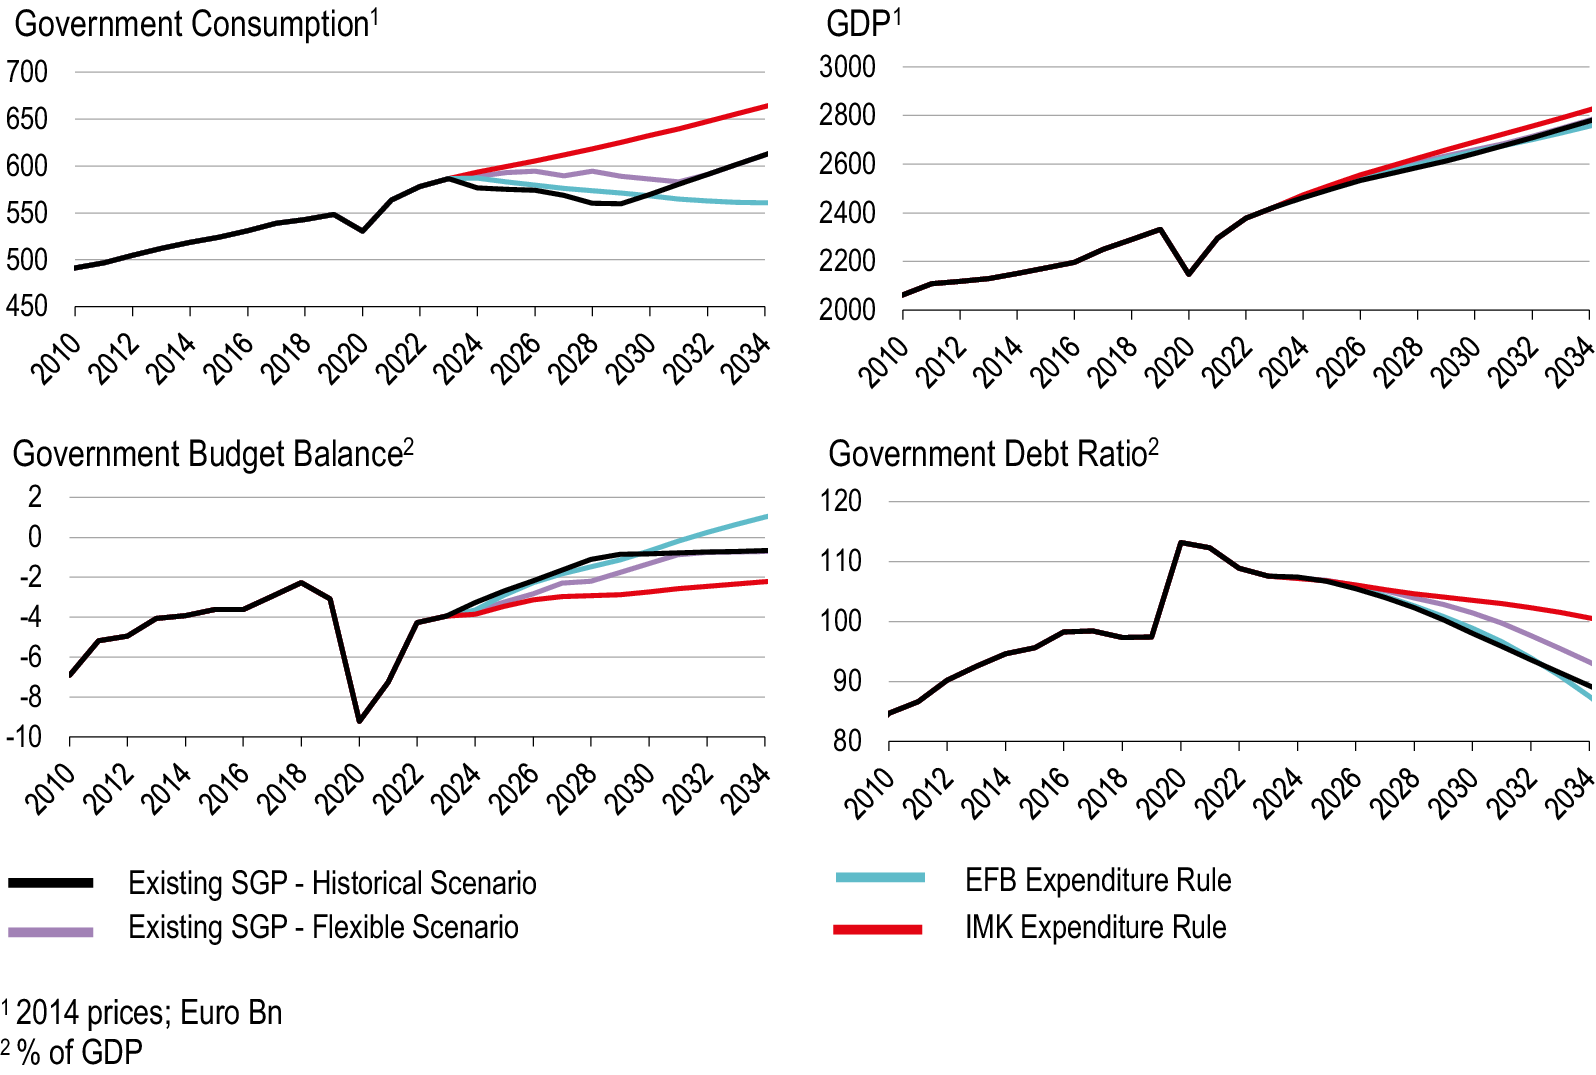
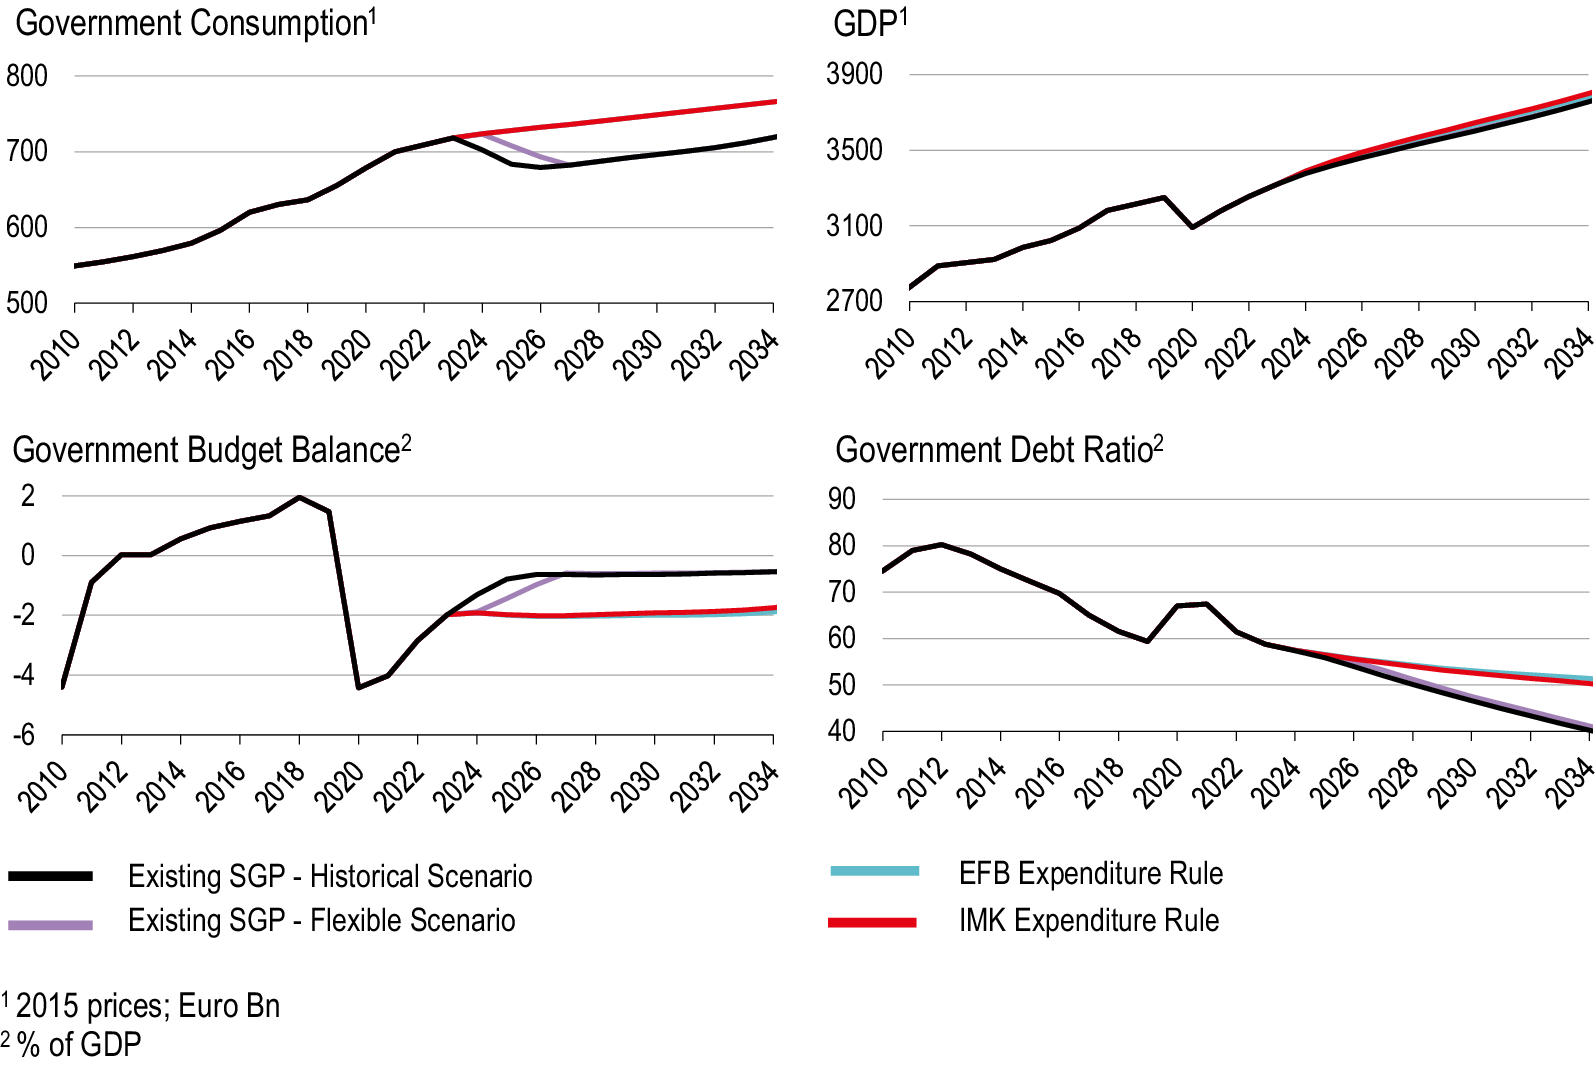
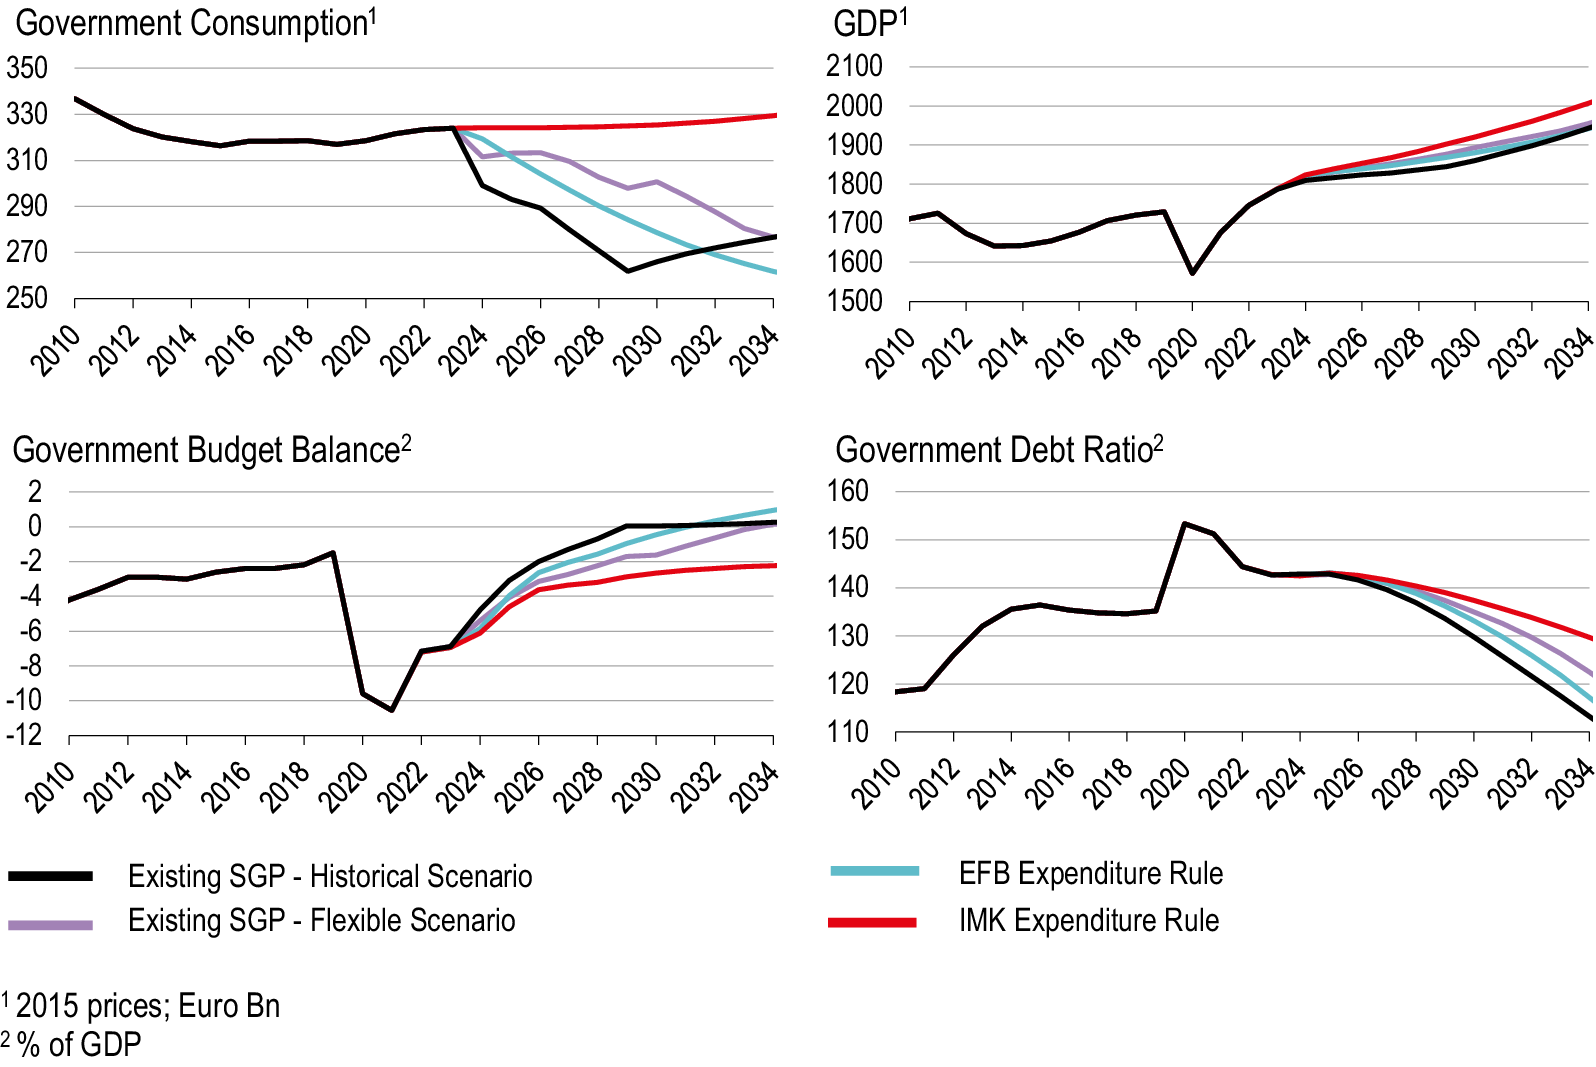
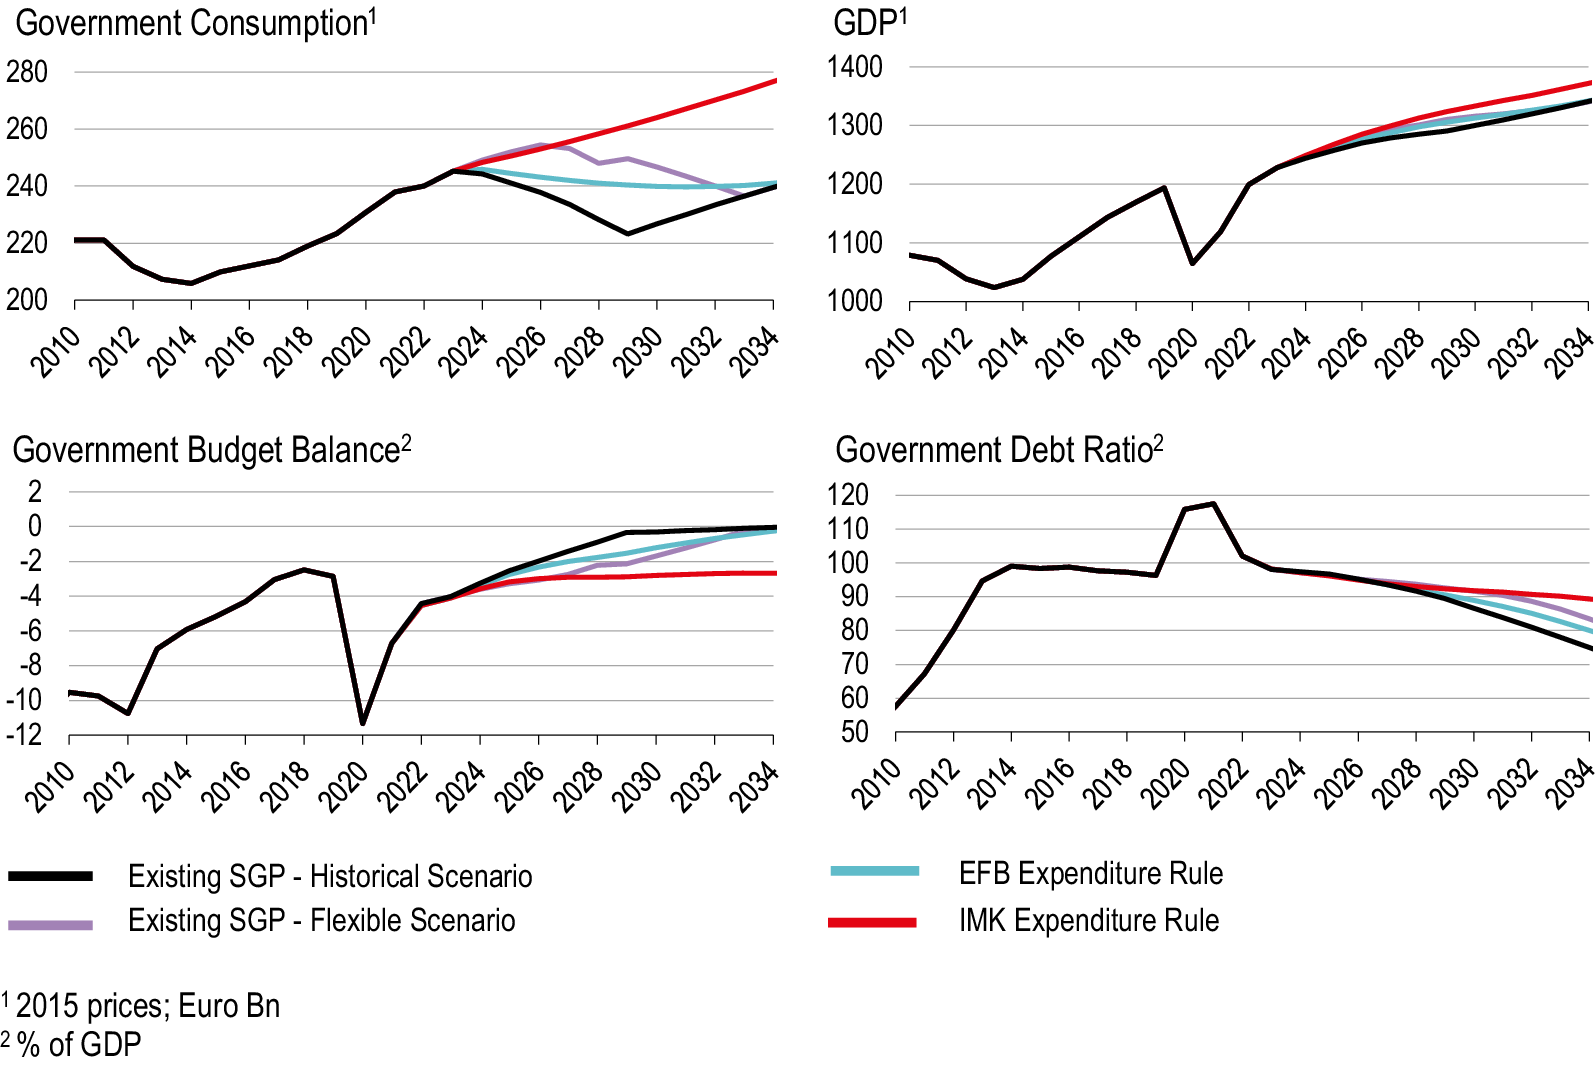
Figures 1–5 show detailed simulation results for government consumption, GDP, the government budget, and its debt-to-GDP ratios. Figures 6 and 7 zoom in on the GDP performance of the various scenarios and vis-à-vis the scenario where the SGP is applied as in the past. Finally, Figure 8 provides an overview of the effects on government debt.
Euro Area. Sources: Authors’ calculation based on NiGEM.

3.1. Economic implications of returning to the unreformed SGP
The return to the unreformed SGP together with the corresponding fiscal consolidation is assumed to start in 2024. Government consumption expenditures of each country are then exogenously reduced to reach the annual budget deficit targets given by the two scenarios – the historical and the flexible interpretation of the SGP – as presented in Darvas and Wolff (Reference Darvas and Wolff2021) and outlined above.Footnote 12
3.1.1. Fiscal policy stance
The necessary consolidation when implementing either the historical or the flexible interpretation of the current SGP rules would lead to historically unprecedented declines in size and duration of real government consumption in the euro area (Figure 1). The scenario in which the SGP is interpreted more flexibly, although being noticeably less strict than the historical scenario, would lead to a longer period of austerity than the one following the euro crisis, usually taken to refer to the period 2010–13. This is particularly visible in Italy, where a return to the SGP in its historically applied version would require the country to reduce its real government consumption by almost 20% until 2029. While the flexible scenario would somewhat mitigate the cuts to government consumption, it would nevertheless require a reduction of almost 15% almost continuously until 2034. These severe cuts to government consumption almost dwarf the austerity measures implemented in Italy during the euro crisis (Figure 4). Figures 2 and 5, respectively, show the simulated real government consumption paths for France and Spain. These countries would similarly face a period of prolonged and severe austerity when returning to the old SGP rules. Even in Germany, where the required fiscal consolidation is amongst the lowest in Europe, an application of the existing SGP rules would still lead to 4 years of continuous cuts to government consumption (Figure 3). Against these severe cuts to government consumption, however, it is important to keep in mind the quite substantial increases in government investment due to the NGEU reform plans.
France. Sources: Authors’ calculation based on NiGEM.

Germany. Sources: Authors’ calculation based on NiGEM.

3.1.2. Macroeconomic effects
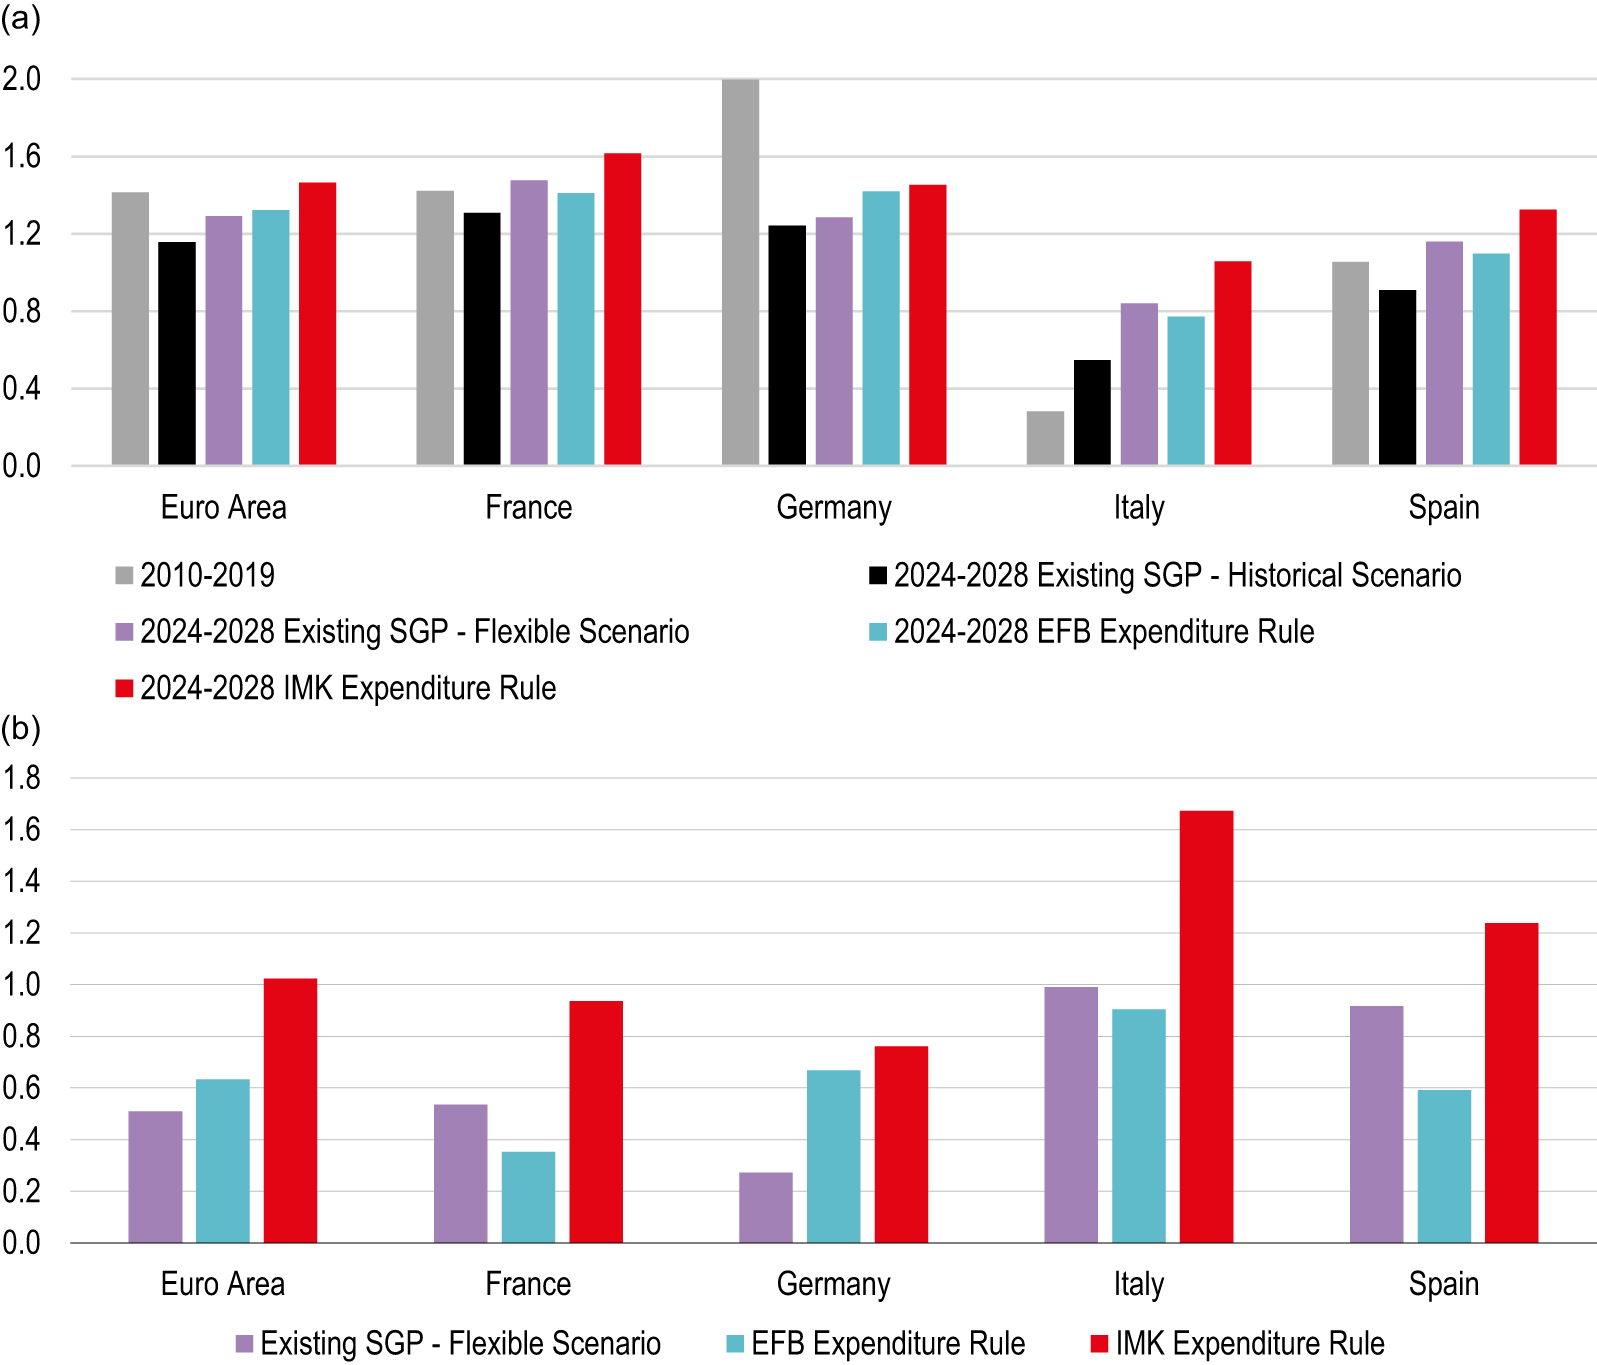
The macroeconomic effects of such severe cuts to government consumption are hard to overemphasise, not to mention the resulting political and social conflicts that would likely be triggered by such austerity measures. Figure 6a shows how a return to the existing SGP rules, when implemented and interpreted as they were in the past, would affect average GDP growth in the euro area and its four major economies in the first 5 years after the re-application of the rules. Euro area GDP growth would be as low as 1.2% per annum, lower even than the average growth rate for the period 2010–19, a period containing the euro crisis and hardly known for macroeconomic stability in the euro area (Figure 6a).
In France, Germany, and Spain the growth rates would be below their corresponding historical averages. The difference in Germany is particularly striking but can be explained by the German economy’s strong performance throughout the last decade. The opposite is the case in Italy: While the average GDP growth rate in the first 5 years after the re-application of the existing rules as in the past is only 0.6% per year, even this low number compares reasonably well with Italy’s weak growth performance of the last decade.
The less severe cuts to government consumption in the flexible scenario translate into somewhat more growth in the euro area and all the countries for which we present evidence. The effect is only marginal for the euro area, France, and Germany, but considerably more noticeable for Italy and Spain where GDP growth during the period 2024 to 2028 is on average around 0.3 percentage points higher per year than in the scenario where the SGP is applied as in the past (Figure 6a).
An alternative presentation of the results is provided in Figures 6b and 7, which show the GDP development of the flexible scenario (and the two expenditure rule scenarios to be discussed below) vis-à-vis the historical scenario. In the euro area, we find the average annual GDP in the first 5 years when the SGP is applied flexibly to be around 0.5% above the GDP of the historic scenario. This deviation is smallest in Germany where we calculate it to be 0.3% and highest in Italy where it is close to 1% (Figure 6b).
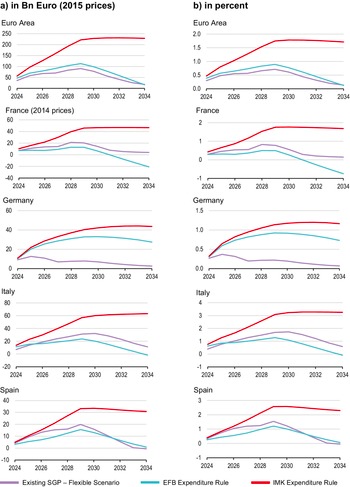
Figure 7 shows detailed GDP developments as deviations from the historical scenario. For the euro area, the additional yearly GDP rises from almost 40 bn Euro in 2024 to 90 bn Euro in 2029, both in 2015 prices, and then declines subsequently if the SGP is more flexibly applied (Figure 7a). The cumulative sum of additional GDP over the first 5 years in the euro area due to a more flexible interpretation of the SGP accrues to somewhat more than 300 bn Euro in 2015 prices. This corresponds to around 0.5% on average for each of the years 2024 to 2028. The effect is visibly higher in Italy, with 1% on average during the first 5 years and reaching almost 2% in 2030 (Figures 6b and 7b).
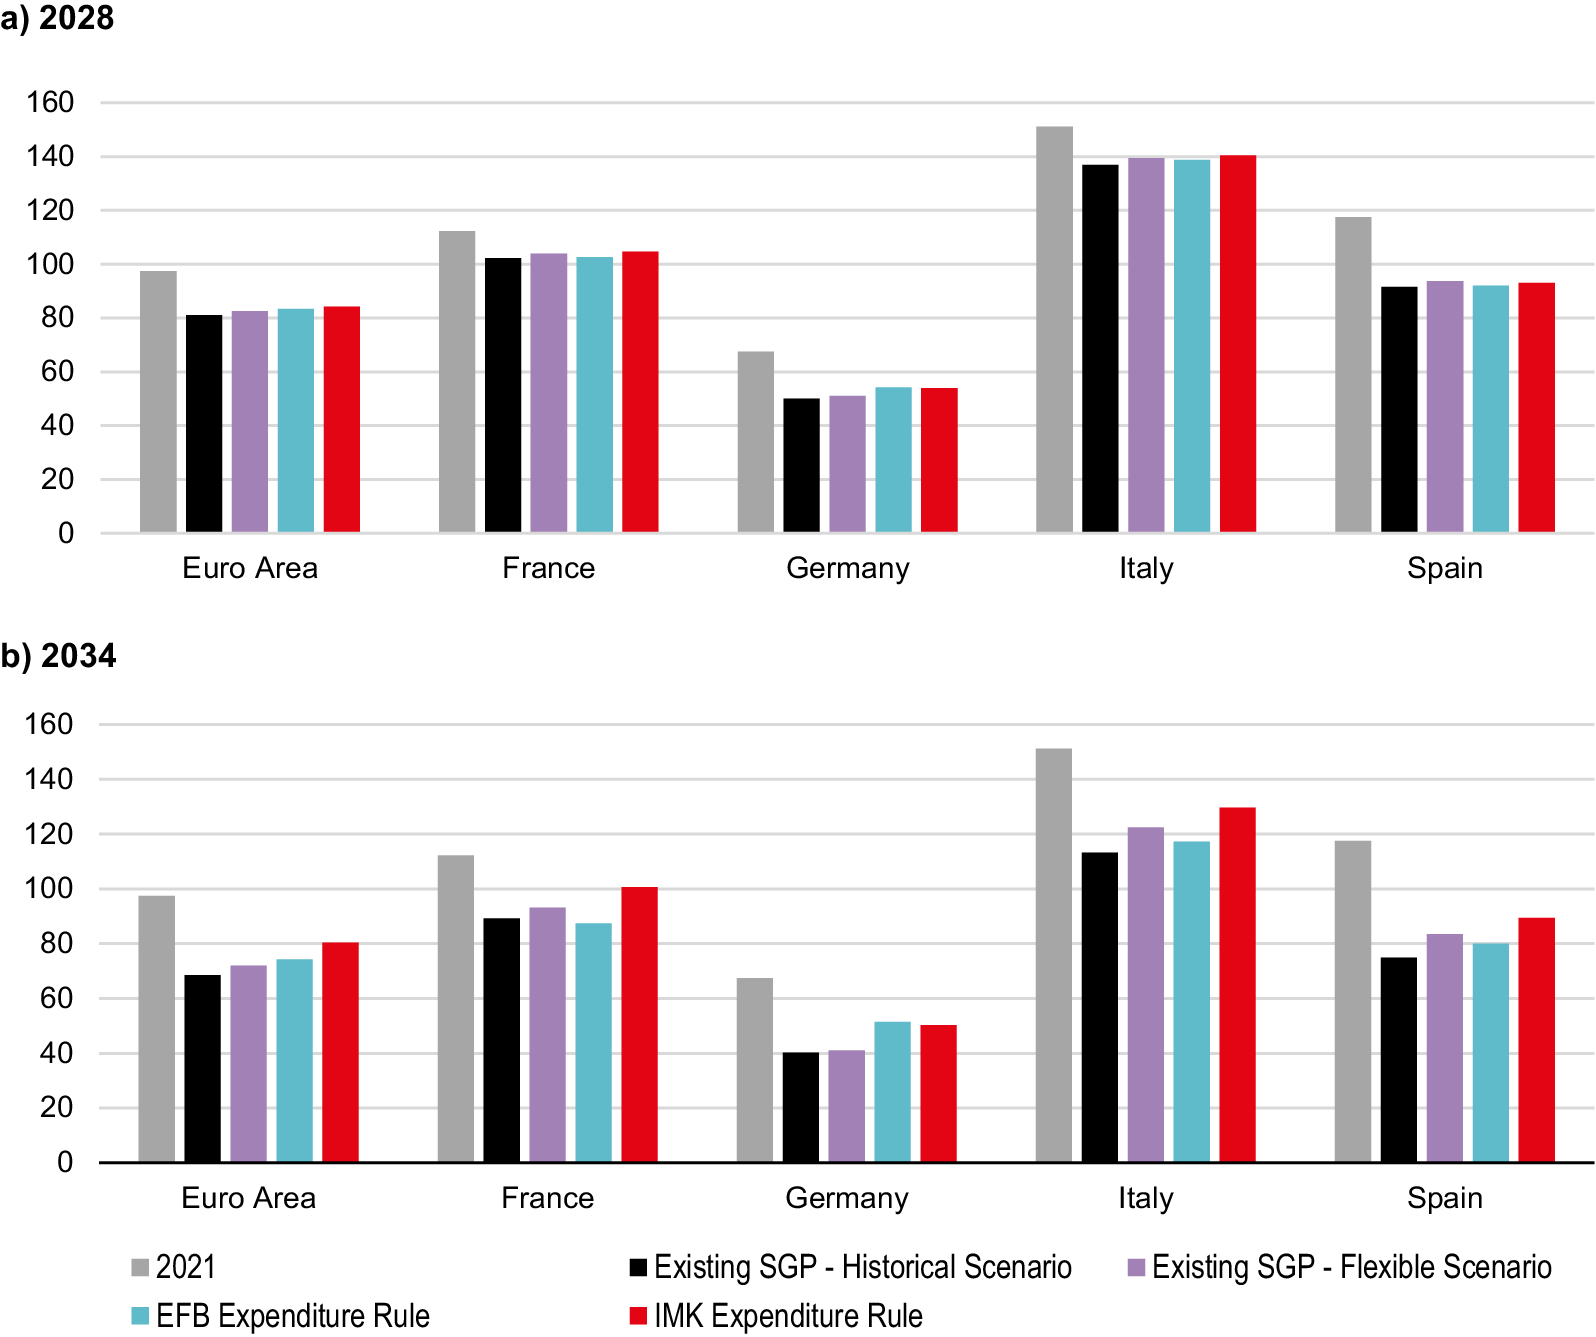
Finally, it is important to observe the effects on public finances and debt levels if the existing rules of the SGP were to be reapplied. The overall euro area government budget deficit would be reduced in a fairly short period of time. This holds particularly for the historical scenario. While the overall government debt-to-GDP ratio in the euro area is predicted to be the lowest in the historical scenario, the differences in the predicted debt ratios from the more flexible scenario are quite small (Figure 8).
3.2. Economic implications of an expenditure rule as proposed by the EFB
The expenditure rule proposed by the EFB caps the growth rate of (nominal) primary expenditure at the trend rate of potential output growth adjusted for long-term inflation expectations (see Section 2.2). The debt ratio objective is taken to be the 60% Maastricht reference value. If the debt-to-GDP ratio exceeds the 60%-target in a specific country, an adjustment parameter ensures that expenditure growth is curbed below the trend rate of potential output to reach the debt anchor within a given time horizon.
Formally, we simulate the following equation:
 $$ {\mathrm{g}}_{\mathrm{t}}={\mathrm{y}}^{\ast }+{\unicode{x03C0}}^{\ast}\hbox{--} \unicode{x03B4} \left({\mathrm{d}}_{\mathrm{t}}\hbox{--} {\mathrm{d}}^{\ast}\right), $$
where gt is the growth rate of nominal government consumption expenditure (net of interest payments), y* is the long-term growth in potential output as the 5-year average of potential GDP growth rate estimates from the latest AMECO vintages, π* is the expected long-term inflation rate taken to be the 2% inflation target of the ECB and (dt – d*) is the difference between actual and target debt-to-GDP ratios.Footnote 13 The parameter δ is called the adjustment parameter because it determines the rate at which the actual debt-to-GDP ratio is adjusted to the target ratio. We followed the EFB proposal and made the size of the adjustment parameter dependent on the debt ratio dt. An overview of the parameter settings for d* and δ used in our simulations is given in Table 1.
3.2.1. Fiscal policy stance
Adopting the EFB expenditure rule proposal would substantially curb government consumption in the euro area below its long-term trend but it would be less restrictive than the historical or the flexible SGP scenarios (Figure 1). Towards the end of the simulation horizon, the level of government consumption would converge with those of the existing SGP scenarios.
The EFB expenditure rule would affect the fiscal stances of the member states quite differently. For Germany, due to its low government debt level, implementing the EFB expenditure rule would lead to an expansion of government consumption.Footnote 14 On the contrary, adopting the EFB expenditure rule for France, Italy, and Spain – all countries with government debt ratios above Germany – would lead to substantial declines in government consumption compared to their long-term trends. In general, our simulations indicate that adopting the EFB proposal for an expenditure rule would lead to paths for government consumption expenditures that are somewhere in between those of the existing SGP rules when implemented in the past and those when the SGP is implemented more flexibly (Figures 2 to 5).
3.2.2. Macroeconomic effects
The less restrictive government consumption expenditure in the euro area under the EFB expenditure rule translates into a higher GDP trajectory than in the historical and flexible SGP scenario. While the difference the GDP development of the historical SGP scenario is substantial, it is only small when compared to the flexible SGP scenario (Figures 1, 6, and 7). Figure 6b shows that the average annual GDP effect in the first 5 years after the implementation would be 0.6% higher than in the historical SGP scenario.
Germany’s average annual GDP would be 0.7% higher under the EFB expenditure rule compared to the historical scenario, thus doubling its effect from the flexible SGP scenario. For France, Italy, and Spain, however, although the EFB proposal would still have a positive GDP effect in the first 5 years compared to the historical SGP scenario, it is lower than in the flexible SGP scenario due to the dampening effect on government consumption arising from the debt adjustment term (Figures 2 to 7).
Adopting the EFB expenditure rule would also lead to changes in the government budget balance. The bottom left chart in Figure 1 shows that the consolidation pressure on the overall government budget of the euro area would be less severe than in the historical and the flexible SGP scenario. This translates into the euro area’s government debt-to-GDP ratio, which would be higher than in the two scenarios of the existing SGP. However, the effect is of rather small magnitude, with the predicted debt ratio in 2034 being only 6% and 2% of GDP higher compared to the historical and the flexible SGP scenario, respectively.
Figures 2 to 5 (bottom charts) show the corresponding effects on the countries’ government budget and debt-to-GDP ratios. For the case of France, Figure 2 shows that the austere cuts in government consumption would lead to consolidation pressure on France’s government budget, which is in the long run even more pronounced than in the historical SGP scenario. The government budget balance in 2034 would be 2% of GDP higher than in the historical SGP scenario. Although France’s government debt-to-GDP ratio in 2034 would be lower than in the historical SGP scenario, the difference would be only 2% of GDP. Figure 3 shows the effects on Germany’s government budget. Due to the expansionary effects, the EFB expenditure rule would have on government consumption, Germany’s government deficit would stagnate at around 2% of GDP over the simulated time horizon. This would translate into a slower reduction of the debt-to-GDP ratio. Germany’s debt-to-GDP ratio in 2034 would be about 10 percentage points higher than in the historical SGP scenario. Nevertheless, it should be noted that Germany’s debt-to-GDP ratio would already fall below the 60%-threshold in 2024. Adopting the EFB expenditure rule would also considerably affect Italy’s and Spain’s government budgets. Figures 4 and 5 show that the EFB proposal is less strict than the historical SGP scenario but would lead to more consolidation pressure than in the flexible SGP scenario. Consequently, the two countries’ debt ratios would settle between those of the historical and the flexible scenario, with the differences being rather small.
Italy. Sources: Authors’ calculation based on NiGEM.

Spain. Sources: Authors’ calculation based on NiGEM.

In summary, adopting the EFB expenditure rule would require member states which currently exceed the 60% debt-to-GDP ratio to curtail their government consumption quite severely. Especially for France, Italy, and Spain such measures’ political feasibility seems questionable given their enormous economic and social costs. Furthermore, even though the countries had to face significant cuts to government consumption, our analysis shows they would not come anywhere close to reaching the Maastricht debt-to-GDP ratio of 60% even by 2034 (Figure 8). The 60% debt-to-GDP target seems unrealistic given the high public debt levels after the Covid-19 pandemic.Footnote 15 Rather than sticking to an unrealistic debt target, it should be considered to increase the target to a more credible ratio. The following section therefore analyses the effects of implementing an expenditure rule with a target debt-to-GDP ratio of 90% as suggested by (Dullien et al., Reference Dullien, Paetz, Watt and Watzka2020).
3.3. Economic implications of the IMK 90% debt rule
Like in the expenditure rule of the EFB, the IMK proposal would allow countries to increase their nominal government consumption expenditures at a rate determined by current real potential GDP growth plus long-term inflation expectations taken to be the ECB’s 2% inflation target. However, as the macroeconomic environment has changed significantly since the adoption of the Maastricht Treaty, the debt target should be increased to reflect those changes. Dullien et al. (Reference Dullien, Paetz, Watt and Watzka2020) recommend an increase in the reference value for the public debt-to-GDP ratio from 60% to 90% of GDP. At the same time, somewhat lower adjustment parameters than in the EFB proposal should be used (Table 1).
3.3.1. Fiscal policy stance
Under the IMK expenditure rule government consumption in the euro area would not have to face the same reduction that it would under the EFB or both SGP scenarios. While those reform options would lead to either stagnating, or in the case of the historical SGP scenario an unprecedented reduction of government consumption, the IMK expenditure rule would allow it to grow steadily at its historical growth rate (top left chart in Figure 1).
The steady growth of real government consumption in the euro area comes from far less restrictive cuts needed in the various national government consumption expenditures. Italy, a country that would face massive cuts to government consumption under all other reform options considered here, would at least be allowed to keep its real government consumption at a constant level for the years to come. France and Spain, for which a return to the existing SGP rules or the EFB expenditure rule would require significant consolidation efforts, would be allowed to steadily increase their government consumption at historical rates. For Germany, the results would be almost identical to those from the EFB expenditure rule. Because Germany’s public debt ratio is well below the 90%-threshold, its government consumption expenditures are not constrained by the debt adjustment term (Figures 2 to 5).
3.3.2. Macroeconomic effects
Figures 6 and 7 show how the proposed IMK expenditure rule would affect GDP developments compared to the historical SGP scenario. For the euro area, the additional yearly GDP rises from almost 60 bn Euro in 2024 to 230 bn Euro in the 2030s, all in 2015 prices, when the IMK expenditure rule is applied instead of the historical SGP implementation (Figure 7a). This corresponds to 0.5% and 1.8% of euro area GDP in the historical SGP scenario (Figure 7b).
(a) Average annual GDP growth in different scenarios compared to the historical average during 2010–2019. (b) Average annual GDP effect in percentage deviation from historical scenario for the first 5 years (2024–2028). Sources: Authors’ calculation based on NiGEM.

GDP deviation from the historical scenario. Sources: Authors’ calculation based on NiGEM.

In the first 5 years euro area GDP would be on average 1% higher each year than under the historical SGP scenario with the rules implemented as in the past. The effect is largest in Italy, where GDP would be on average more than 1.6% higher than in the historical SGP scenario. In Germany, where the effect is the smallest, our rule still increases the average GDP by almost 0.8% vis-à-vis the historical SGP scenario. An interesting observation is the slight difference between the relative growth performance of Germany in the IMK proposal compared to the EFB proposal. Due to Germany’s low debt ratio the two rules are identical for government consumption paths. However, the spillover effects from the higher GDP growth rates in the neighbouring countries lead to higher economic growth in Germany too. Finally, for France and Spain the effects are similar to the effects in the euro area overall; Spain’s GDP averaging around 1.2%, while France’s approximately 0.9% above their respective levels in the historical SGP scenario (Figure 6b).
The increased government consumption spending in our proposal does lead to higher budget deficits and debt ratios in the euro area and all countries considered (bottom charts in Figures 1 to 5). However, the deficits do remain below the 3%-Maastricht deficit criterion. Although the government debt ratios are somewhat higher, the higher deficits do not translate into rising debt ratios – where our predictions show a continuous decline. Figure 8a and 8b show government debt ratios in the years 2028 and 2034, respectively. The debt ratios under the various scenarios differ only slightly by 2028, and while the differences do grow over time, they do not amount to much by 2034. The differences are strongest in Italy, where the predicted debt ratio in the IMK proposal is around 16% of GDP higher in 2034 than in the historical SGP scenario. While this is considerable, it needs to be weighed against the better – and arguably more stable – Italian GDP performance. For the euro area overall, the average government debt ratio is around 80% by 2034, around 10 percentage points higher than in the historical scenario.
Debt-to-GDP ratios compared to 2021. Sources: Authors’ calculation based on NiGEM.

4. Conclusion
The European Commission decided to suspend the EU fiscal rules due to ongoing exceptional circumstances until the end of 2023. Reformed or not, member states must again fully adhere to the rules from 2024 onwards. This paper explored the macroeconomic consequences for the euro area as well as for France, Italy, Germany, and Spain, of a return to the status quo ante of EU fiscal rules and compared them to the effects of reforming them towards an expenditure rule. For the latter, we extended NiGEM with an expenditure rule for the respective countries.
The simulation results show that returning to the unreformed set of rules of the SGP would entail substantial consolidation efforts leading to detrimental GDP effects. This holds especially if the current SGP is to be implemented in the way it was in the past. But even a more flexible interpretation of the current rules will lead to a prolonged period of fiscal austerity in Europe.
Shifting the fiscal rules towards expenditure rules would, however, neither necessarily nor by itself lead to bigger increases in GDP over the coming years. Instead, successfully introducing and applying expenditure rules in a reformed SGP will critically depend on the precise parameter settings of the framework. One important part of the puzzle is raising the debt-to-GDP reference value. Additionally, the speed of adjustment towards that reference value should be low enough and made more state-dependent with lower (higher) adjustment parameters if the current debt ratio is high (low) to avoid re-running the same self-defeating austerity measures as seen during the euro crisis.
It should be emphasised that even in the case with relatively low adjustment speed and correspondingly higher public expenditure trajectories, debt as a percentage of GDP is falling noticeably in all countries for which simulations were carried out, only at a slower pace compared with the other scenarios.
There is currently great hope among academics and institutions that expenditure rules will replace the structural deficit targets, or at least become of greater importance in a reformed SGP. This is particularly the case because such a reform would be possible without Treaty change, but could be done by changing secondary legislation only (Dullien et al., Reference Dullien, Paetz, Repasi, Watt and Watzka2022).
Acknowledgements
We would like to thank Janis Jurgeleit and Lukas Oberhoff for excellent research assistance and two anonymous referees, the editor as well as numerous colleagues at and numerous colleagues at IMK for fruitful discussions. All remaining errors are ours.
Appendix
Government investment in the euro area and its four largest economies. Sources: Authors’ calculation based on NiGEM.