1. INTRODUCTION
Given that the marriage market is not homogenous, a superior individual is more likely to accept a match with an inferior individual in the presence of marriage payments or if the marriage surplus is divisible and the latter is willing to commit to a smaller share. Two strands of literature dominate marriage market and bargaining power studies. In looking at the role of marriage payments in clearing the marriage market, the first strand assumes that the intrahousehold allocation of resources is exogenous; the second assumes that matching in the marriage market is predetermined.
This study explores the relationship between these two strands of literature to determine whether individuals commit to postmarriage household shares when being matched as potential partners. Using data on rural Bangladesh for 1998/99, collected by the World Bank and the Bangladesh Institute of Development Studies (BIDS), I ask whether women in a stronger bargaining position when being matched retain this relative bargaining power after marriage.
I argue that the relative size of marriage payments exchanged is indicative of the quality of the match and women's bargaining position when being matched—where the higher the bride price as a share of total marriage payments, the stronger the woman's bargaining position. Bride price and dowry are relevant in this case for two reasons: not only are both common in rural Bangladesh, but they can also be exorbitant (as much as six times the household's annual income).
Women's bargaining power postmarriage is measured by their ability to make fertility-related choices, whether by increasing their consumption of contraceptives in general and the Pill in particular or choosing to have fewer children spaced further apart. This is pertinent because women bear the increasing cost of having more children and their fertility preferences or desirable family size may differ from that of their spouse [Bankole and Singh (Reference Bankole and Singh1998), Arunachalam and Naidu (Reference Arunachalam and Naidu2010), Francis (Reference Francis2011), Diebolt and Perrin (Reference Diebolt and Perrin2013)].
The main findings of this study show that, as the bride price (taken as a fraction of total household marriage payments) increases from 10% to 30%, the predicted probability of a mother using the contraceptive pill increases by four percentage points. This result is in keeping with the study's hypothesis that women in a relatively strong bargaining position at the time of marriage are likely to remain in a strong position after marriage—as reflected in their decision to use the contraceptive pill.
Section 2 presents the theoretical model and the hypotheses. Section 3 describes the data and sample profile. Section 4 reports the estimation results along with a discussion. Section 5 concludes the study.
2. THEORY AND HYPOTHESES
The study makes two key assumptions. The first is that dowry serves the groom-price motive and is a means of correcting imbalances in the marriage market when matching different individuals. The second assumption is that women prefer to have fewer children and therefore want to use contraception, the Pill in particular.
Assumption 1. Dowry serves as a groom-price motive.
In rural Bangladesh, dowry payments arise due to imbalances in the marriage market, serving primarily the groom-price motive rather than protecting women's interests after marriage. In this context, it is also reasonable to assume that predetermined outcomes are more important with regard to women's bargaining power, given the symmetry between men and women in the value of being single at the time of marriage. At this point in the marriage market, women's desirability depends on their looks and complexion, age, education, and chastity, while that of men depends on their level of education and prospects of earning a good living.
Postmarriage the value of being single falls dramatically for women. This is largely a cultural outcome: although divorce is permitted in Islam and by law, there is a social stigma attached to being single. Single women are not given the same social status as married women whether they have been divorced, are single parents, or have remained unmarried. This is more acute if the bride's parents are poor or have passed away [Esteve-Volart (Reference Esteve-Volart2004)]. In the context of rural Bangladesh, wanting a divorce therefore represents “unreasonable” behavior on a woman's part.
Given this, if the threat point does not correspond to divorce and is, instead, the noncooperative outcome of “harsh words and burnt toast” [Lundberg and Pollak (Reference Lundberg and Pollak1993)], then it should depend on the resources controlled by the woman during the marriage as opposed to outside marriage. However, I argue that a woman's control over resources is not affected by marriage payments because it is her parents who receive the bride price, while her husband controls her dowry (the groom-price motive). The only component of marriage payments that the woman receives, if she is Muslim, is “mahar” also known as dower that is paid in two parts to the woman: (i) at the time of marriage and (ii) and at the time of divorce if it is initiated by the husband [Arunachalam and Naidu (Reference Arunachalam and Naidu2010)]. What I argue instead is that given the extent to which rural Bangladesh is bound by tradition, commitments made to resolving imbalances in the marriage market are considered binding—people are expected to keep their word. Thus, cultural and informal institutions and norms compel the dominant partner, the husband, to assign a certain share of household resources to his wife based on their contractual understanding at the time of marriage.
Assumption 2. Postmarriage women prefer to have fewer children spaced further apart.
As women's relative bargaining power increases, they will bargain to have fewer children spaced further apart and increase their use of contraceptives, the Pill in particular. The intrahousehold literature on collective models looks at the contraceptive pill as an assignable good, the individual consumption of which can be measured [Browning et al. (Reference Browning, Bourguignon, Chiappori and Lechene1994)]. The study measures women's bargaining power by their use of the Pill—and not any other modern, temporary, nonclinical contraceptive, such as the condom—for several reasons: (i) use of the contraceptive pill falls within the ambit of women; (ii) the Pill has few side effects and is easy to use; and (iii) it is cheap and readily accessible in Bangladesh, where fieldworkers will deliver contraceptive pills to women free of cost.
In rural Bangladesh, where infertility among women is a socially acceptable reason for a husband to desert his wife and remarry, a woman is more likely to take her husband into confidence when using the contraceptive pill, as the lack of fertility might suggest she is infertile. It is important to acknowledge that husbands and wives have different preferences concerning family size. Using data from 18 developing countries, Bankole and Singh (Reference Bankole and Singh1998) found that ideal family size varies substantially between men and women, with the latter wanting larger families and the next child sooner.
Arguably, if women are in excess demand over men and the market features a bride price, women will have greater bargaining power and so can bargain for fewer children, where having children incurs an increasing cost to women [Arunachalam and Naidu (Reference Arunachalam and Naidu2010), Francis (Reference Francis2011), Diebolt and Perrin (Reference Diebolt and Perrin2013)]. This cost includes the “time devoted to pregnancy, childbirth, and breastfeeding” [Rasul (Reference Rasul2008)]. Eswaran (Reference Eswaran2002) added that, apart from the income lost during pregnancy, childbirth, and child rearing, women bear a large personal cost to their health, where having more children implies greater damage to maternal health. Thus, women's welfare and their household decision-making power over important matters, such as family size and birth spacing, increase with the availability of efficient birth control innovations, such as the Pill [Chiappori and Oreffice (Reference Chiappori and Oreffice2008)]. Upadhyay et al. (Reference Upadhyay, Gipson, Withers, Lewis, Ciaraldi, Fraser, Huchko and Prata2014), who reviewed numerous studies conducted primarily in South Asia, also found a positive association between women's decision-making power and lower household fertility, as well as longer periods of birth spacing.
2.1. Theory
Based on my analysis of earlier studies in this field, my hypothesis is that women in a stronger position at the time of marriage (measured by the bride price as a fraction of total marriage payments) remain empowered postmarriage (measured by women choosing to have fewer children, through the use of the contraceptive pill and spacing births further apart).
To provide a theoretical explanation for the hypothesis above, I draw from the work of Arunachalam and Naidu (Reference Arunachalam and Naidu2010) to model the fertility decision within households given that husband and wife have conflicting preferences over the number of children they want to have.Footnote 1
In the simple model adopted in this paper, the threat point of the wife
 $\bar{V}$
f is determined by the proportion of total marriage payments composed of bride price
 $( {\frac{b}{{b + g}}} )$
. I treat the level of bride price (b) as an “extra-household environmental factor” that raises the outside option of the bride and thus increases her bargaining power. I argue that one form of bride price known as “mahar” and “dower” is paid in part under the Muslim Family Laws Ordinance to the bride at the time of marriage. Given that a large proportion of my sample consists of Muslim women this may be one explanation of why women are able to bargain for fewer children when bride price as a fraction of total marriage payments (b + g) is higher. The threat point of the husband
 ${\bar{V}^{m}}$
on the contrary depends on groom price (g) also known as demand that is paid to the husband by the wife's family at the time of marriage. Given that the husband has control over groom price, a higher composition of groom price as a fraction of total marriage payments has the impact of increasing his bargaining power.
The utility of the household depends on “c,” which is the private goods for consumption and the quantity of children born by a married couple “n.” In keeping with Michael and Willis (Reference Michael and Willis1976) and Arunachalam and Naidu (Reference Arunachalam and Naidu2010), I define “n” as the reduction in the quantity of children born by a married couple n ≡
 $\bar{n} - x$
, where “natural fertility" is denoted as
 $\bar{n}$
and “level of contraception” by x.
The relative bargaining power of the wife is denoted by the parameter θ (0 ⩽ θ ⩽ 1) and that of the husband as (1 − θ). I argue that if women are at a stronger position at the time of marriage, then they continue to enjoy higher bargaining power post marriage as captured by the parameter θ.
The fertility in the household is then determined by the solution to the Nash Bargaining problem given below.
 $$\begin{eqnarray*}
{\rm{Max}}\;{U^{h}}(x,\;c) &=& {\left[ {{U^{f}}\left( {\bar{n} - x,\ c} \right)\ - \ {{\bar{V}}^{_f}}\left( {\frac{b}{{b + g}}} \right)} \right]^\theta }\\
&&+\, {\left[ {{U^{m}}\left( {\bar{n} - x,\ c} \right)\ - \ {{\bar{V}}^{_m}}\left( {\frac{g}{{b + g}}} \right)} \right]^{\left( {1 - \theta } \right)}}{\rm{s}}{\rm{.t}}{\rm{.c}} + x = I,
\end{eqnarray*}$$
where Uf
(.), Um
(.),
 $\overline {{V^{f}}} $
(.), and
 $\overline {{V^{m}}} $
(.) are increasing functions; I is the income of the household; and the price of the consumption good, c, and price of contraception, x, is normalized to 1.
Taking logarithm of the objective function above gives the following:
 $$\begin{eqnarray}
\log {U^{h}}(x,c) &=& \left( \theta \right)\log [{U^{f}}\left( {\bar{n} - x,\ c} \right)\ - \ {{\bar{V}}^{f}}] \nonumber\\
&&+\, \left( {1 - \theta } \right)\log \left[ {{U^{m}}\ \left( {\bar{n} - x,\ c} \right) - {{\bar{V}}^{m}}} \right] \nonumber\\
&&+\, \lambda \left[ {I - \ c - x} \right].
\end{eqnarray}$$
Assumption A is a key assumption under which Propositions 1, 2, and 3 hold true. According to this assumption, the husband's marginal rate of substitution of total number of children for consumption is larger than that of his wife's. Assumption A is essential to this paper's main assertion—men and women differ in their preference over fertility, where men want larger families as compared to women.
Assumption AFootnote 2
 $$\begin{eqnarray*}
\frac{{U_n^{f}}}{{U_c^{f}}} < \frac{{U_n^{m}}}{{U_c^{m}}}.
\end{eqnarray*}$$
PROPOSITION 1. Household's Marginal Rate of Substitution of total number of children for consumption is smaller than that of the husband's.Footnote 3
To prove this, I take the derivative of equation (1) with respect to quantity of children (n) and the household consumption good (c) as given below:
 $$\begin{eqnarray}
U_n^{h} &=& \frac{{d{\rm{log}}{{\rm{U}}^{h}}}}{{dn}} = \frac{{\theta U_n^{f}}}{{{U^{f}} - {{\bar{V}}^{f}}}} + \frac{{(1 - \theta )U_n^{m}}}{{{U^{f}} - {{\bar{V}}^{m}}}}, \nonumber\\
U_c^{h} &=& \frac{{d{\rm{log}}{{\rm{U}}^{h}}}}{{dc}} = \frac{{\theta _c^{f}}}{{{U^{f}} - {{\bar{V}}^{f}}}} + \frac{{(1 - \theta )U_c^{m}}}{{{U^{f}} - {{\bar{V}}^{m}}}}.
\end{eqnarray}$$
If the household's marginal rate of substitution of total number of children for consumption is smaller than that of the husband's, then
 $$\begin{eqnarray*}
\frac{{U_n^{h}}}{{U_c^{h}}} < \frac{{U_n^{m}}}{{U_c^{m}}}.
\end{eqnarray*}$$
Cross-multiplying and substituting the derivatives from equation (2)
 $$\begin{eqnarray*}
&& U_{n}^{h}U_{c}^{m} < U_{c}^{h}U_{n}^{m}, \\
&& \left( {\frac{{\theta U_n^{f}}}{{{U^{f}} - {{\bar{V}}^{f}}}} + \frac{{(1 - \theta )U_n^{m}}}{{{U^{f}} - {{\bar{V}}^{m}}}}} \right)U_c^{m} < \left( {\frac{{\theta U_c^{f}}}{{{U^{f}} - {{\bar{V}}^{f}}}} + \frac{{(1 - \theta )U_c^{m}}}{{{U^{f}} - {{\bar{V}}^{m}}}}} \right)U_n^{m},\\
&&\frac{{\theta U_n^{f}U_c^{m}}}{{{U^{f}} - {{\bar{V}}^{f}}}} + \frac{{(1 - \theta )U_c^{m}U_n^{m}}}{{{U^{f}} - {{\bar{V}}^{m}}}} < \frac{{\theta U_c^{f}U_n^{m}}}{{{U^{f}} - {{\bar{V}}^{f}}}} + \frac{{(1 - \theta )U_c^{m}U_n^{m}}}{{{U^{f}} - {{\bar{V}}^{m}}}},\\
&&\frac{{\theta U_n^{f}U_c^{m}}}{{{U^{f}} - {{\bar{V}}^{f}}}} < \frac{{\theta U_c^{f}U_n^{m}}}{{{U^{f}} - {{\bar{V}}^{f}}}},\\
&& U_n^{f}U_c^{m} < U_c^{f}U_n^{m}, \\
&& \frac{{U_n^{f}}}{{U_c^{f}}} < \frac{{U_n^{m}}}{{U_c^{m}}}.
\end{eqnarray*}$$
This inequality is true given Assumption A.
PROPOSITION 2. The Marginal Rate of Substitution of the household of total number of children for consumption is decreasing in the bargaining power of the wife.Footnote 4
 $$\begin{eqnarray*}
\frac{{d{\rm{MRS}}_{nc}^{h}}}{{d\theta }} < 0.
\end{eqnarray*}$$
The household's marginal rate of substitution of quantity of children for consumption is given by the following:
 $$\begin{eqnarray*}
{\rm{MRS}}_{nc}^{h} = \frac{{U_n^{h}}}{{U_c^{h}}} = \frac{{\frac{{d{\rm{log}}{{\rm{U}}^{h}}}}{{dn}}}}{{\frac{{d{\rm{log}}{{\rm{U}}^{h}}}}{{dc}}}}.
\end{eqnarray*}$$
Differentiating with respect to ϴ
 $$\begin{eqnarray*}
\frac{{\frac{{U_n^{h}}}{{U_c^{h}}}}}{{d\theta }} = \frac{{U_{n\theta }^{h}U_c^{h} - U_{c\theta }^{h}U_n^{h}}}{{{{(U_c^{h})}^2}}}.
\end{eqnarray*}$$
 $$\begin{equation}
{\rm{Since}}\;\frac{{d{\rm{MRS}}_{nc}^{h}}}{{d\theta }} < 0,\;{\rm{then}}\;U_{n\theta }^{h}U_c^{h} < U_{c\theta }^{h}U_n^{h}.
\end{equation}$$
From (2), I know that
 $$\begin{eqnarray*}
U_c^{h} &=& \frac{{\theta U_c^{f}}}{{{U^{f}} - {{\bar{V}}^{f}}}} + \frac{{(1 - \theta )U_c^{m}}}{{{U^{f}} - {{\bar{V}}^{m}}}},\\
U_n^{h} &=& \frac{{\theta U_n^{f}}}{{{U^{f}} - {{\bar{V}}^{f}}}} + \frac{{(1 - \theta )U_n^{m}}}{{{U^{f}} - {{\bar{V}}^{m}}}}.
\end{eqnarray*}$$
Keeping the work of Arunachalam and Naidu (Reference Arunachalam and Naidu2010) in mind, I define
 $\alpha = \frac{1}{{{U^{f}} - {{\bar{V}}^{f}}}}$
and β =
 $\frac{1}{{{U^{f}} - {{\bar{V}}^{m}}}}.$
Then,
 $$\begin{eqnarray*}
U_c^{h} &=& \alpha \theta U_c^{f} + (1 - \theta )\beta U_c^{m},\\
U_n^{h} &=& \alpha \theta U_n^{f} + (1 - \theta )\beta U_n^{m}.
\end{eqnarray*}$$
Differentiating with respect to ϴ yields the following results:
 $$\begin{eqnarray*}
U_{c\theta }^{h} &=& \alpha U_c^{f} - \beta U_c^{m},\\
U_{n\theta }^{h} &=& \alpha U_n^{f} - \beta U_n^{m}.
\end{eqnarray*}$$
Substituting in Uh nθ Uc h < Uh cθ Un h
 $$\begin{eqnarray*}
&& \left( {\alpha U_n^{f} - \beta U_n^{m}} \right)\alpha \theta U_c^{f} + (1 - \theta )\beta U_c^{m} < (\alpha U_c^{f} - \beta U_c^{m})\alpha \theta U_n^{f} + (1 - \theta )\beta U_n^{m},\\
&&\quad \alpha U_n^{f}(\alpha \theta U_c^{f} + \left( {1 - \theta )\beta U_c^{m}} \right) - \beta U_n^{m}(\alpha \theta U_c^{f} +\, \left( {1 - \theta )\beta U_c^{m}} \right) < \alpha U_c^{f}(\alpha \theta U_n^{f} \\
&&\quad +\, \left( {1 - \theta )\beta U_n^{m}} \right) -\, \beta U_c^{m}(\alpha \theta U_n^{f} + \left( {1 - \theta )\beta U_n^{m}} \right), (1 - \theta )\alpha U_n^{f}\beta U_c^{m} \\
&&\quad -\, \beta U_n^{m}\alpha \theta U_c^{f} < + \alpha U_c^{f}\left( {1 - \theta )\beta U_n^{m}} \right) - \beta U_c^{m}\alpha \theta U_n^{f}.
\end{eqnarray*}$$
Dividing through by α and β
 $$\begin{eqnarray*}
(1 - \theta )U_n^{f}U_c^{m} - U_n^{m}\theta U_c^{f} < (1 - \theta )U_c^{f}U_n^{m} - U_c^{m}\theta U_n^{f}.
\end{eqnarray*}$$
Multiplying out
 $$\begin{eqnarray*}
&& U_n^{f}U_c^{m} - \theta U_n^{f}U_c^{m} - U_n^{m}\theta U_c^{f} < U_c^{f}U_n^{m} - \theta U_c^{f}U_n^{m} - U_c^{m}\theta U_n^{f},\\
&& U_n^{f}U_c^{m} < U_c^{f}U_n^{m},\\
&& \frac{{U_n^{f}}}{{U_c^{f}}} < \frac{{U_n^{m}}}{{U_c^{m}}}.
\end{eqnarray*}$$
This inequality is true given Assumption A
PROPOSITION 3. The Marginal Rate of Substitution of the household of total number of children for consumption is decreasing in the outside option (threat point) of the wife.
 $$\begin{eqnarray*}
\frac{{d{\rm{MRS}}_{nc}^{h}}}{{d{{\bar{V}}^{f}}}} < 0.
\end{eqnarray*}$$
The household's marginal rate of substitution of quantity of children for consumption is given by the following:
 $$\begin{eqnarray*}
{\rm{MRS}}_{nc}^{h} = \frac{{U_n^{h}}}{{U_c^{h}}} = \frac{{\frac{{d{\rm{log}}{{\rm{U}}^{h}}}}{{dn}}}}{{\frac{{d{\rm{log}}{{\rm{U}}^{h}}}}{{dc}}}},
\end{eqnarray*}$$
 $$\begin{eqnarray*}
\frac{{\frac{{U_n^{h}}}{{U_c^{h}}}}}{{d{{\bar{V}}^{f}}}} = \frac{{U_{n{{\bar{V}}^{f}}}^{h}U_c^{h} - U_{c{{\bar{V}}^{f}}}^{h}U_n^{h}}}{{{{(U_c^{h})}^2}}}.
\end{eqnarray*}$$
 $$\begin{equation}
{\rm{Since}}\;\frac{{d{\rm{MRS}}_{nc}^{h}}}{{d{{\bar{V}}^{f}}}} < 0,\;{\rm{then}}\;U_{n{{\bar{V}}^{f}}}^{h} U_c^{h} < U_{c{{\bar{V}}^{f}}}^{h} U_n^{h}.
\end{equation}$$
Differentiating (2) with respect to
 ${\bar{V}^{f}},$
we get
 $$\begin{eqnarray*}
U_{n{{\bar{V}}^{f}}}^{h} = \frac{{\theta U_n^{f}{{\bar{V}}^{f^\prime}}}}{{{{({U^{f}} - {{\bar{V}}^{f}})}^2}}},
\end{eqnarray*}$$
 $$\begin{eqnarray*}
U_{c{{\bar{V}}^{f}}}^{h} = \frac{{\theta U_c^{f}{{\bar{V}}^{f^\prime}}}}{{{{({U^{f}} - {{\bar{V}}^{f}})}^2}}},
\end{eqnarray*}$$
 $$\begin{eqnarray*}
&& \frac{{\theta U_n^{f}{{\bar{V}}^{f ^\prime}} }}{{{{({U^{f}} - {{\bar{V}}^{f}})}^2}}}\ \left( {\frac{{\theta U_c^{f}}}{{{U^{f}} - {{\bar{V}}^{f}}}} + \frac{{(1 - \theta )U_c^{m}}}{{{U^{m}} - {{\bar{V}}^{m}}}}} \right) \\
&&\quad < \frac{{\theta U_c^{f}{{\bar{V}}^{f^\prime}}}}{{{{({U^{f}} - {{\bar{V}}^{f}})}^2}}}\ \left( {\frac{{\theta U_n^{f}}}{{{U^{f}} - {{\bar{V}}^{f}}}} + \frac{{(1 - \theta )U_n^{m}}}{{{U^{m}} - {{\bar{V}}^{f}}}}} \right).
\end{eqnarray*}$$
Multiplying by
 ${({U^{f}} - {\bar{V}^{f}})^2}$
 $$\begin{eqnarray*}
\theta U_n^{f}{\bar{V}^{f^\prime}}\ \left( {\frac{{\theta U_c^{f}}}{{{U^{f}} - {{\bar{V}}^{f}}}} + \frac{{(1 - \theta )U_c^{m}}}{{{U^{m}} - {{\bar{V}}^{m}}}}} \right) < \theta U_c^{f}{\bar{V}^{f^\prime}}\ \left( {\frac{{\theta U_n^{f}}}{{{U^{f}} - {{\bar{V}}^{f}}}} + \frac{{(1 - \theta )U_n^{m}}}{{{U^{m}} - {{\bar{V}}^{m}}}}} \right).
\end{eqnarray*}$$
Dividing by ϴ and
 ${\bar{V}^{f}}$
 $$\begin{eqnarray*}
U_n^{f}\ \left( {\frac{{\theta U_c^{f}}}{{{U^{f}} - {{\bar{V}}^{f}}}} + \frac{{(1 - \theta )U_c^{m}}}{{{U^{m}} - {{\bar{V}}^{m}}}}} \right) < U_c^{f}\ \left( {\frac{{\theta U_n^{f}}}{{{U^{f}} - {{\bar{V}}^{f}}}} + \frac{{(1 - \theta )U_n^{m}}}{{{U^{m}} - {{\bar{V}}^{m}}}}} \right),
\end{eqnarray*}$$
 $$\begin{eqnarray*}
\frac{{\theta U_c^{f}U_n^{f}}}{{{U^{f}} - {{\bar{V}}^{f}}}} + \frac{{(1 - \theta )U_c^{m}U_n^{f}}}{{{U^{m}} - {{\bar{V}}^{m}}}} < \ \frac{{\theta U_c^{f}U_n^{f}}}{{{U^{f}} - {{\bar{V}}^{f}}}} + \frac{{(1 - \theta )U_c^{f}U_n^{m}}}{{{U^{m}} - {{\bar{V}}^{m}}}},
\end{eqnarray*}$$
 $$\begin{eqnarray*}
\frac{{(1 - \theta )U_c^{m}U_n^{f}}}{{{U^{m}} - {{\bar{V}}^{m}}}} < \ \frac{{(1 - \theta )U_c^{f}U_n^{m}}}{{{U^{m}} - {{\bar{V}}^{m}}}}.
\end{eqnarray*}$$
Dividing by (1−ϴ) and multiplying
 $({U^{m}} - {\bar{V}^{m}})$
 $$\begin{eqnarray*}
\frac{{U_n^{f}}}{{U_c^{f}}} < \frac{{U_n^{m}}}{{U_c^{m}}}.
\end{eqnarray*}$$
This inequality is true given Assumption A.
3. DATA
To test the hypotheses above, the study uses survey data collected by the World Bank and BIDS to evaluate credit programs under the Grameen Bank, the Bangladesh Rural Advancement Committee, and the Bangladesh Rural Development Board (the RD12 project). The survey comprises two series, the first carried out in 1991/92 and the second—which I have used here—in 1998/99.Footnote 5
The 1991/92 dataset includes 1,798 rural households drawn randomly from 87 villages across 29 thanas (sub-districts), chosen randomly in turn from the country's 391 thanas. Of these 29 thanas, 24 had at least one of the above-mentioned credit programs in operation in 1991, while the remaining five thanas had none. Three villages were chosen randomly in each thana with an operational credit program, based on a list of villages provided by that program's local office (in each case, the credit program was at least three years old). Based on village census data provided by the Government of Bangladesh, an additional three villages with no credit program were chosen at random. The 1998/99 dataset not only comprises the same households as chosen in the first series of the survey, but also includes households in the new villages from the initial thanas and three new thanas, yielding 2,599 households in all.
The survey data were collected in three rounds reflecting the country's main rice-based seasons (aus, aman, and boro). Each round was conducted postharvest—in December/January, April/May, and July/August—to capture the income flows, impact on agricultural employment, and price changes associated with each season.
3.1. Sample Profile
The sample selected for this study comprises 2,061 married couples, all of whom had children at the time of the survey (identified by mother and father identity numbers in the dataset). Selecting a sample of parents as opposed to childless couples assumes that all women want at least one child. The conflict in the household is, therefore, about birth spacing and the total number of children to have—not whether to have any children at all.
The survey asked all men and women aged 12–50 about their marital history, including whether they were married, how old they were when first married, and how much dowry their parents gave or received. I consider the amount a woman's parents receive from her spouse/in-laws as the bride price and the amount a woman's parents give her spouse/in-laws as the groom price. To construct a measure of relative marriage payments, the bride price is taken as a fraction of total marriage payments (the sum of the bride price and groom price). Questions on contraceptive use were addressed to all women aged 12–50; women who said “yes” when asked if they were currently using any birth control methods and were married, of which 94% were mothers (had one child or more) at the time of the survey.
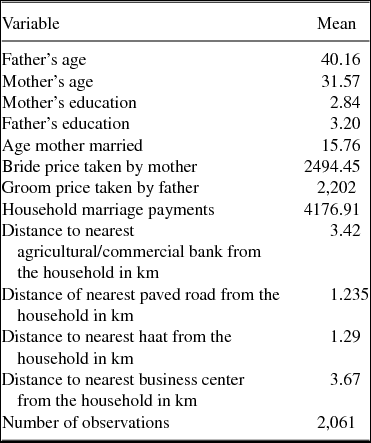
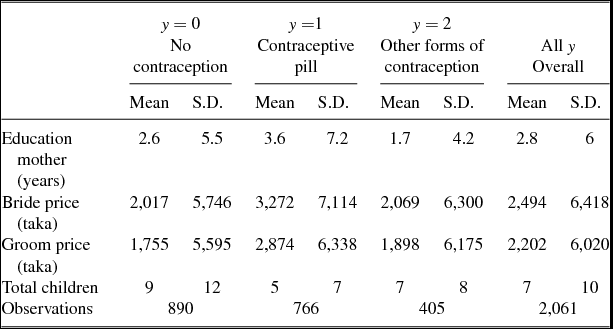
Table 1 provides some insightful summary statistics for the sample. On average, fathers are older (by 8.5 years) and better educated than mothers, women marry by the age of 15 and household marriage payments comprise 60% of the bride price and 53% of the groom price. The subsample averages in Table 2 show that women who use the contraceptive pill are better educated than the average woman in the sample and compared to women who use no form of contraception. Women who use contraception also tend to receive a higher bride price at the time of marriage. The average bride price received by women who reported using the contraceptive pill is 1,255 takas (62%) higher than those who use no contraception and 1,203 takas (58%) more than women who use other forms of contraception. The sample's definition of “children” is restricted to those under the age of 18 and who were living with their parents in 1998/99. On average, women who took the contraceptive pill had five children—two fewer than those who used other forms of contraception and four fewer than those who used no form of contraception.
Descriptive statistics

Subsample averages

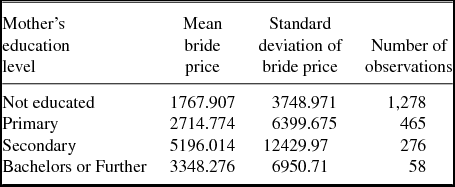
Table 3 gives the summary statistics for the bride price by the mother's level of education. About 62% of the mothers in this sample have not completed primary school; those who have, command an average bride price that is 947 takas more than that of uneducated women. About 13% percent of women who have completed secondary school have the highest average bride price at 5,196 takas—almost three times the average bride price received by uneducated women. Women with a Bachelor's degree or higher make up only 3% of the sample: while they receive a higher bride price than women with only primary schooling, their bride price is lower than that of women who have completed secondary school. The low levels of education among men and woman in rural Bangladesh might imply that men feel threatened by better-educated women, who thus represent an anomaly.
Summary statistics of bride price by mother's education level

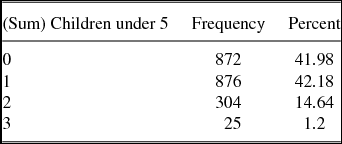
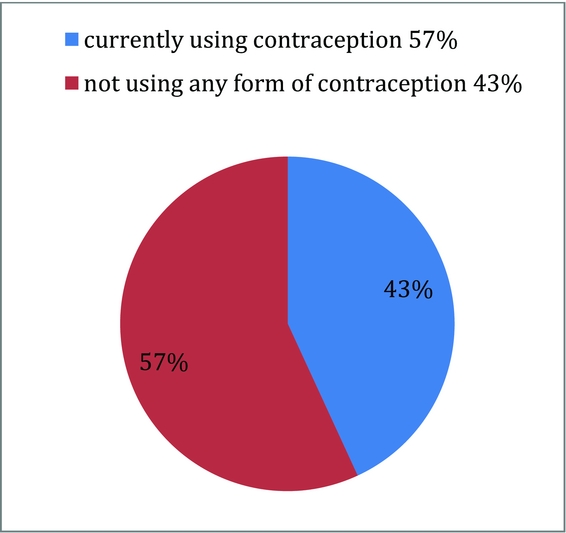
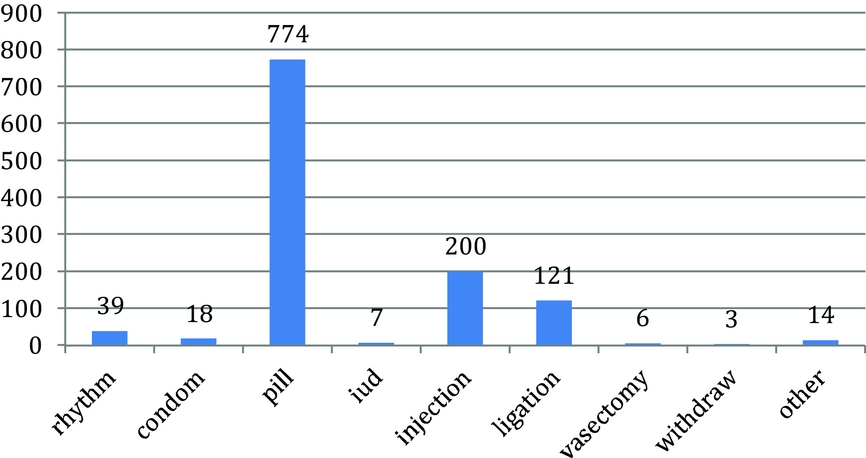
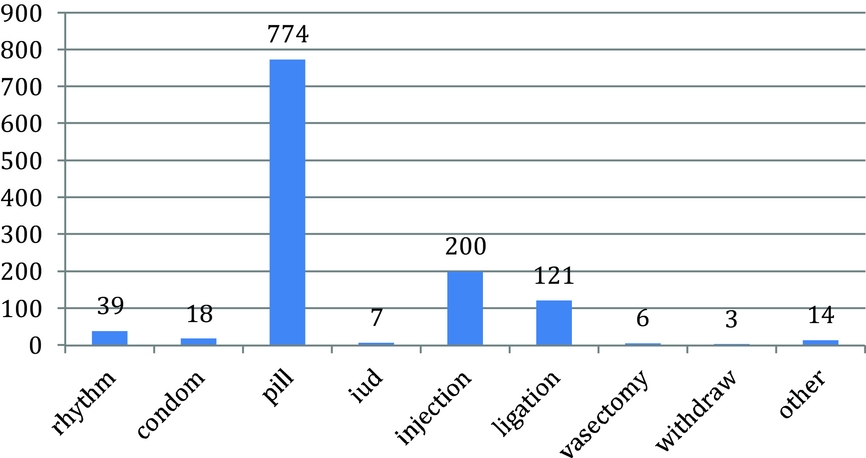
Of the sample of 2,061 mothers and fathers, 58% had one or more children under the age of five (see Table 4). Of 2,061 women, 1,182 were using contraception at the time of the survey in 1998/99 (see Figure 1). The most popular method of contraception was the Pill (65.48%), followed by contraceptive injections (16.92%), ligation (10.24%), the rhythm method (3.3%), condoms (1.52%), other forms of contraception (1.18%), IUDs (0.59%), vasectomies (0.51%), and withdrawal (0.25%) (see Figure 2).
Number of children under the age of 5

Use of contraception.

Type of contraception used.
4. RESULTS AND DISCUSSION
This section presents the results of a probit model that explores the association between relative marriage payments and women's decision to use contraceptives. This is followed by the results of a multinomial logit model estimating the correlation between relative marriage payments and women's decision to use the contraceptive pill. Finally, the section provides results for alternative measures of fertility, such as the total number of children born and birth spacing.
Important factors affecting the use of contraceptives include the following: a woman's age, how many living children she has, how many sons she has, her education and religion, her membership of an NGO, her place of residence, and access to services, such as the doorstep delivery of contraceptives. The determinants of contraceptive use were chosen keeping these factors in mind and subject to the data available.
4.1. Contraceptive Use and the Pill
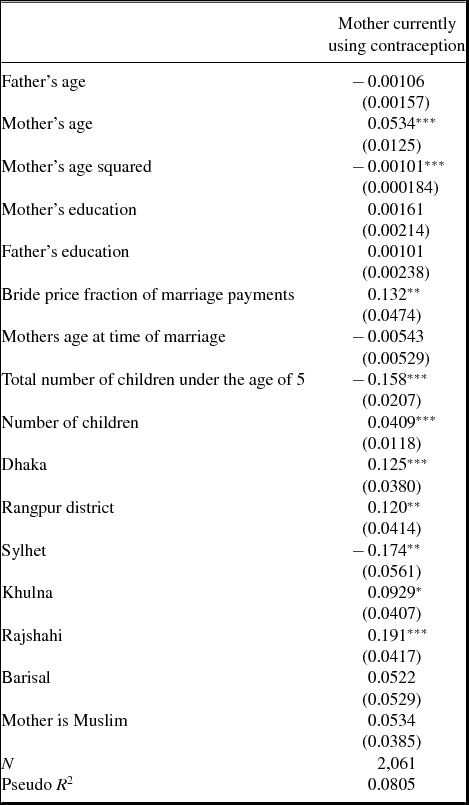
The probit estimation results for use of contraception are presented in Table 5, where the dependent variable equals 1 if the mother was using contraception and 0 if she was not. The results show that a one-unit increase in the bride price as a fraction of total marriage payments has a positive and significant effect of 13 percentage points on the likelihood of using contraception. As the total number of living children increases, mothers are more likely to practice contraception. As the number of children under five increases, mothers are less likely to be using contraception. As maternal age increases, mothers are more likely to use contraception, but at a decreasing rate.
Probit-bride price as a fraction of household marriage payments⊥

Marginal effects; Standard errors in parentheses. *p< 0.05, **p < 0.01, ***p < 0.001.
⊥Model: Probit; Dependent variable: takes on the value of 1 (if the mother was currently using contraception) and 0 (if she was not).
A probit on the use of the contraceptive pill as opposed to no contraception yields similar results, where the likelihood of using the Pill increases with the bride price as a share of total marriage payments, the mother's level of education, the total number of living children in the household, and the mother's age (but at a decreasing rate). The likelihood of using the Pill falls with the father's age and if the number of children under five increases by one unit.
With reference to the study's variable of interest, relative marriage payments, these findings are in keeping with the hypothesis that women in a strong bargaining position premarriage are more likely to control their fertility choices postmarriage, as evident from their use of contraception and the Pill.
4.2. Contraceptive Pill Use: A Multinomial Logit Analysis
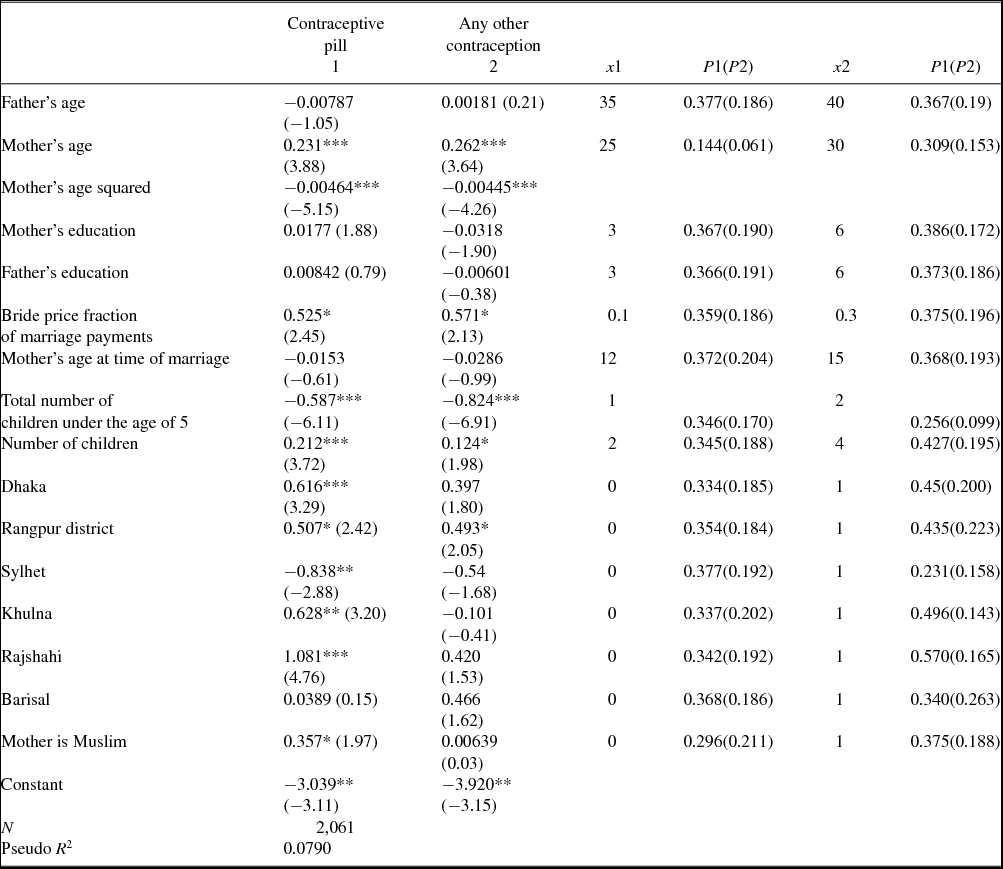
Compared to the probit model, the multinomial logit modelFootnote 6 (Table 6) is less restrictive in terms of the effect of explanatory variables on women's choice of contraceptive use, allowing the coefficients of exogenous variables—such as women's level of education—to vary across their use of the Pill or other forms of contraception. The probit, on the other hand, assumes that all coefficients are the same across women's decision to use (or not use) contraception.
Probit-bride price as a fraction of household marriage payments⊥

Standard errors in parentheses. *p < 0.05, **p < 0.01, ***p < 0.001.
⊥Model: Unordered Multinomial Logit; Dependent variable: the use of contraception—takes values of 0 (no contraception), 1 (contraceptive pill), and 2 (other forms of contraception).
Relative marriage payments and contraceptive pill use
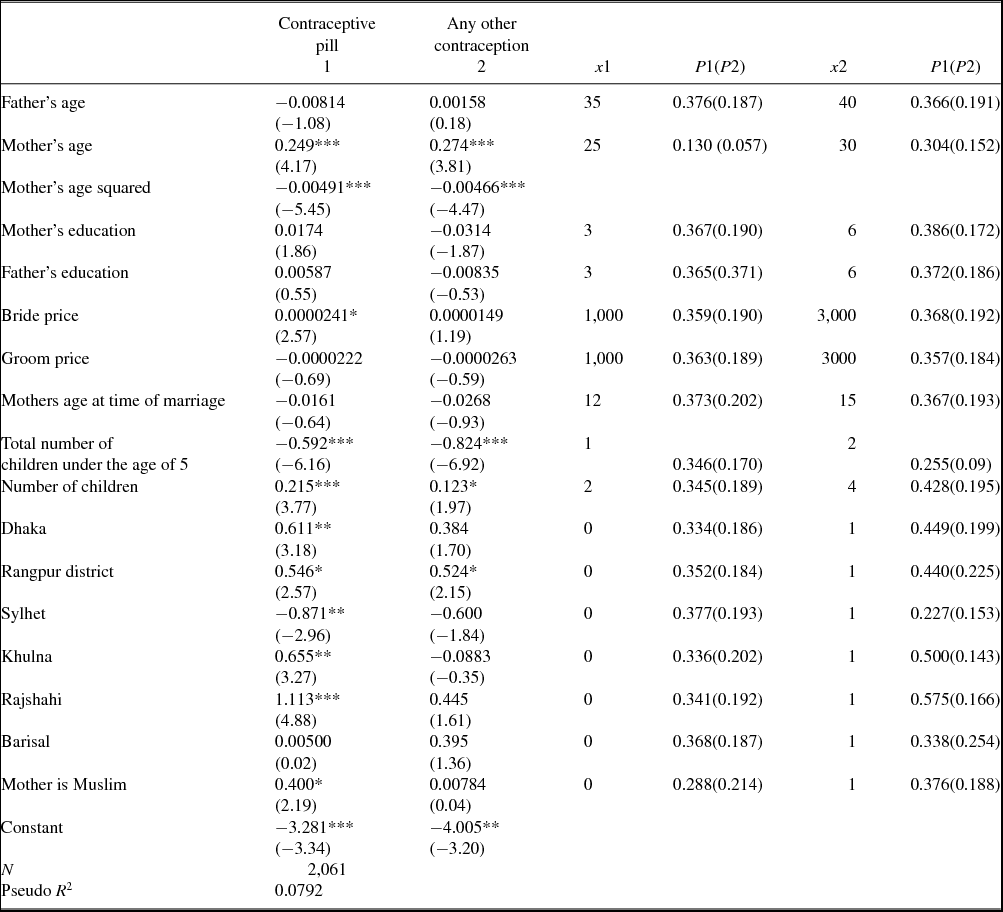
The study uses an unordered multinomial model, the multinomial logit, since there is no clear ordering of the outcome variable as older women may prefer different forms of contraception to younger women. The polychotomous dependent variable is the use of contraception and takes values of 0, 1, and 2 depending on the three mutually exclusive, alternative forms of contraception—respectively, no contraception, the contraceptive pill, and other forms of contraception. The use of no contraception is adopted as the natural base category. The regressors include the father's age, mother's age, mother's age squared, parental education (in years), the mother's age when (first) married, the number of children under five in the household, the total number of children in the household, the mother's religion, district, and the fraction of the bride price over total marriage payments exchanged by husband and wife.
Table 6 shows the impact of the bride price as a fraction of total household marriage payments on women's decision to use the contraceptive pill (where the total marriage payment received by the household is the sum of the bride price received by the woman and the groom price received by the man). The results of the multinomial logit show that, as the bride price as a fraction of total marriage payments increases from 10% to 30%, the predicted probability of using the contraceptive pill increases by four percentage points.Footnote 7 This result supports the study's hypothesis, showing that the greater a woman's bargaining power when she is matched with a potential partner (represented by the bride price as a share of total marriage payments), the greater her ability to choose a form of contraception that she controls, such as the contraceptive pill.
In line with previous studies, the individual characteristics of the mother and father also play an important role in determining women's use of the contraceptive pill [Kamal and Islam (Reference Kamal and Islam2010)]. The results of the variables age and age squared suggest that as the mother's age increases, she is more likely to use the contraceptive pill as opposed to no contraception, but at a decreasing rate.Footnote 8 The mother's religion also plays a significant role in her use of the Pill: if she is Muslim, her predicted probability of using the Pill increases by 23 percentage points. It is, however, important to note that 89.33% of this sample comprises Muslim women and only 10.53% comprises Hindu women. It is a possibility that for Muslim women a component of bride price may be their “mahar” or “dower.” However, given that women who are at a stronger bargaining position at the time of marriage receive a higher “mahar” from their husbands, our interpretation of the results does not change.
The results show that, as the number of children born in the household increases from two to four, the predicted probability of using contraceptive pills rises by 21 percentage points.Footnote 9 Previous studies exploring the correlation between an increase in the total number of living children and the use of contraceptives confirm this finding [Khan (Reference Khan1996), Mannan (Reference Mannan2002), Kamal and Islam (Reference Kamal and Islam2010)]. However, as the number of children under five increases from one to two, the predicted probability of using contraceptive pills falls by 30 percentage points. This suggests that, in households with young children, women are less likely to use contraception as they may still be completing their families or breastfeeding a child, where lactation acts as a natural form of contraception.
The total number of living children is a key determinant of contraceptive use among women [Khan (Reference Khan1996), Kamal and Islam (Reference Kamal and Islam2010)]. Based on data from the Bangladesh Demographic and Health Survey for 1996/97, Mannan (Reference Mannan2002) found that women are less likely to use inefficient and permanent methods of contraception as the number of living children increases. Khan (Reference Khan1996) used a sample of about 8,500 married women, drawn from the 1990 Knowledge Attitude and Practice Survey, to examine the relationship between fertility control, contraceptive availability, and socio-demographic factors in rural Bangladesh. He found that contraceptive use is determined by the number of living children, followed by the number of living sons, as well as by married couples’ attitude toward fertility control.
Absolute marriage payments and contraceptive pill use
This section looks at absolute constructs of marriage payment, such as the bride price and groom price, to gauge their correlation with women's decision to use the contraceptive pill. Table 7 shows that, as the value of the bride price increases from 1,000 takas to 3,000 takas, the predicted probability of using the Pill increases by 2.4 percentage points. However, when the groom-price increases from 1,000 takas to 3,000 takas, the predicted probability of using the Pill falls by 1.7 percentage points.
Absolute marriage payments⊥

Standard errors in parentheses. *p < 0.05, **p < 0.01, ***p < 0.001.
⊥Model: Unordered Multinomial Logit; Dependent variable: the use of contraception—takes values of 0 (no contraception), 1 (contraceptive pill), and 2 (other forms of contraception).
This supports the study's initial finding concerning the relationship between marriage payments exchanged and women's decision-making power post-marriage, as evident from their use of the contraceptive pill. The relative construct of marriage payments is, however, preferable because such payments may be exchanged in both directions and it is only the relative value of one payment (over the total) that provides any indication of the relative quality of the match and women's bargaining power.
4.3. Alternative Measures of Fertility
To check the robustness of these results, the study uses two alternative constructs that measure women's bargaining power during the marriage: the total number of children and birth spacing. Given that women bear the increasing cost of having more children, their preference for fewer children should be reflected in (i) the total number of children born and (ii) birth spacing—other than in increased use of contraception and of the Pill in particular.
Total number of children born
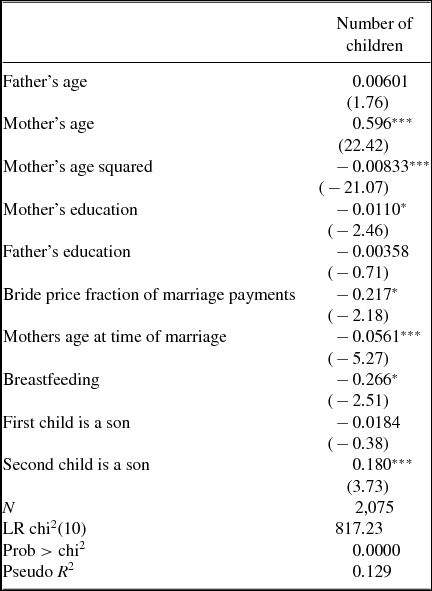
This involves an ordered probit where the dependent variable is the number of children. To prevent the results from being influenced by outliers, the dependent variable takes the value of 1, 2, 3, 4, 5, and > 5, where the > 5 category absorbs all outliers. I add several controls to the original specification, including whether a woman is breastfeeding, if her first child was male and if her second child was male. Table 8 shows that relative marriage payments have a negative effect, significant at the 5% level, on the total number of children born. As one might expect, women who are breastfeeding have fewer children, as breastfeeding acts as a natural contraceptive.
Number of children born (ordered probit)⊥

t statistics in parentheses.
* p < 0.05, **p < 0.01, ***p < 0.001.
⊥Model: Ordered Probit; Dependent variable: number of children and takes on the value of 1, 2, 3, 4, 5, and more than 5.
The literature shows that lactation inhibits 6.5 births on average per woman [Weis (Reference Weis1993)]. With regard to policy, postpartum family planning services decide between providing women with contraception immediately after birth or once lactation-induced amenorrhea has ended, so as to minimize the “double protection interval” (Weis, Reference Weis1993). At the Bellagio conference in 1988, the World Health Organization and United Nations Children's Fund suggested that contraception should start once menstruation has resumed or t months after childbirth, where the recommended t is six months. Weis (Reference Weis1993) used data from the Bangladesh Fertility Survey for 1989 and found that the breastfeeding period here is one of the longest in the world, where t can be as long as 12 months.
The mother's age at marriage has a highly significant, negative effect on the total number of children born. I argue that women who are older when they get married have more say in their marriage. The availability of the Pill also delays marriage as well as reducing the cost of marriage to women: access to a reliable method of contraception implies they no longer have to give up their careers when they get married (Goldin and Katz, Reference Goldin and Katz2002).
The study finds that the effect of the first child being male on total fertility is not significant at the 5% level. However, if the second child is male, women are more likely to have more children. This result is puzzling as one would expect the demand for children to fall once a family has had a son, particularly in the case of South Asia. The mother's education has the expected negative effect while the mother's age has an increasing impact, but at a decreasing rate as before.
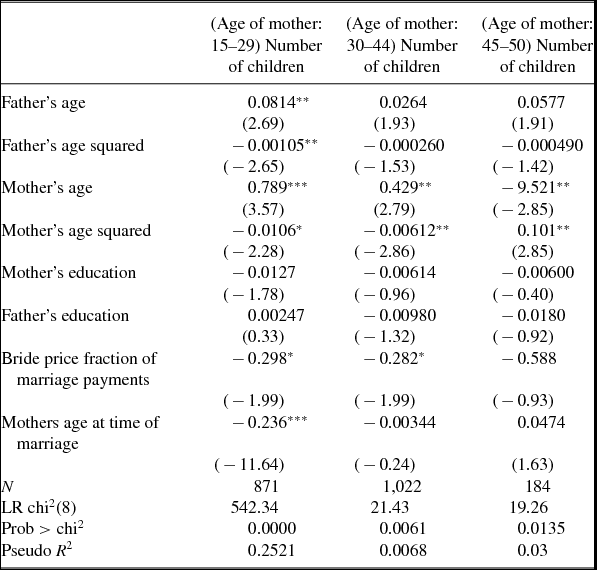
As a robustness check, I estimate the correlation between relative marriage payments and family size across different age cohorts for women. The sample is divided into three cohorts: women aged 15–29, 30–44, and 45–50. The results show that the variable of interest, relative marriage payments, is significant for the 15–29 and 30–44 subsamples, but not for the 45–50 subsample (see Table 9). This may be because most women have completed their families by the time they are 45 and, as a result, I cannot rule out the age effect on contraception.
Number of children born (ordered probit): Age cohort⊥

⊥Model: Ordered Probit; Dependent variable: number of children and takes on the value of 1, 2, 3, 4, 5, and more than 5.
Birth spacing
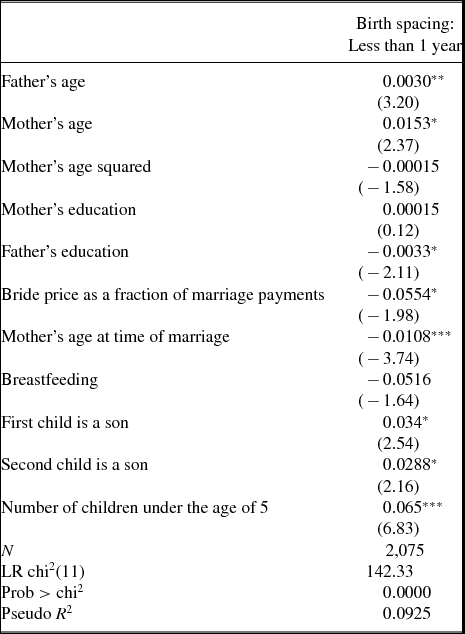
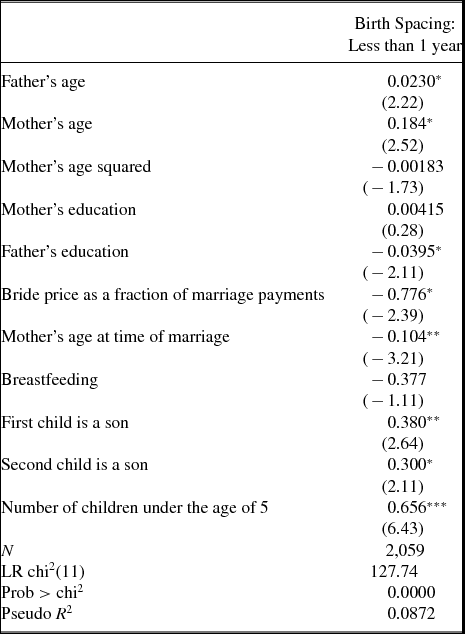
Next, I explore the correlation between relative marriage payments and another indicator of fertility—birth spacing. The dependent variable in the probit estimation is a dummy variable that takes a value of 1 if the space between any two successive births is a year or less. This interval is chosen because a birth spacing period of less than 14 months increases the chances of infant mortality by 60–80% (Yeakey et al., Reference Yeakey, Muntifering, Ramachandran, Myint, Creanga and Tsui2009). Short birth intervals can also have serious consequences for maternal health. In keeping with the study's hypothesis, Table 10 shows that, as the bride price as a fraction of marriage payments rises, the probability of the interval between two live births being 12 months or less falls.
Birth spacing: Less than 1 year difference between children⊥

Marginal effects; t statistics in parentheses.
* p < 0.05, **p < 0.01, ***p < 0.001.
⊥Model: Probit; Dependent variable: takes on the value of 1 (if the space between two successive births is one year or less) and 0 (if not).
Parental characteristics play a significant role in birth spacing: older men and women are more likely to space their children apart by 12 months or less, while men who are better educated are less likely to do so. These results show that older men and women may be more inclined to complete their fertility. However, better-educated fathers are more likely to understand the consequences of such short birth intervals for the mother and child, implying that any two births are less likely to occur so close together.
As before, the mother's age at the time of marriage has a highly significant negative effect on birth intervals of a year or less, while the presence of children under five increases the probability of closer birth spacing. The dummy variables denoted by 1 if the first child born is a son and the second child is also a son are both positive and significant. These results are contrary to expectation: one would assume that parents who already have a son are less keen to have their next child quickly.
I include a conditional logit to control for district fixed effects in an effort to capture the correlation between marriage payments and birth spacing at the district level, thus alleviating any potential endogeneity in outcomes. The study controls for fixed effects at the district level as opposed to the village level because the literature shows that “patrilocal residence and village exogamy” are key features of marriage in Bangladesh, where women who marry men from another village move into their husband's home in the new village after marriage (Pitt et al., Reference Pitt, Khandker and Cartwright2006).
The results given in Table 11 confirm the study's initial findings: better-educated fathers are less likely to encourage shorter birth intervals, as are mothers who were older at the time of marriage. However, the older the parents, the higher is the probability of closely spaced births. As women's relative bargaining power at the time of marriage (as given by relative marriage payments) increases, the likelihood of successive births that are a year apart or less falls.
Conditional logit: Birth spacing (district fixed effects)⊥

t statistics in parentheses.
* p < 0.05, **p < 0.01, ***p < 0.001.
⊥Model: Conditional Logit; Dependent variable: takes on the value of 1 (if the space between two successive births is one year or less) and 0 (if not).
5. CONCLUSION AND RECOMMENDATIONS
Using data on rural Bangladesh for 1998/99, collected by the World Bank and BIDS, this study investigates the relationship between women's bargaining position at the time of marriage and their decision-making power postmarriage. The relative bargaining power of rural Bangladeshi women when being matched with a potential partner is measured by the bride price as a share of total marriage payments; women's decision-making power postmarriage is measured by their use of the contraceptive pill. Marriage payments, as Becker conjectures, arise to align the demand and supply of brides and grooms in the marriage market (Becker, Reference Becker1991). I have argued that women of higher quality in relation to their husbands—in terms of education, looks or socioeconomic background—receive a higher bride price; their postmarital intrahousehold decision-making power stems from this difference in quality, which is signaled by a higher bride price.
The study's key findings are that, as the bride price as a fraction of total marriage payments increases from 10% to 30%, the predicted probability of using the contraceptive pill rises by four percentage points. Other factors, such as the number of living children in the household, the number of children under five, and the mother's religion, play a significant role in women's use of contraceptive pills.
Women's household bargaining power is tied closely to desirable economic outcomes, such as lower levels of population growth and better maternal and child health (Diebolt and Perrin, Reference Diebolt and Perrin2013). Rapid population growth is a crucial problem in many developing countries where 75% of the world's population lives. It lowers per capita income, hampers economic growth by lowering the saving rate and reducing “the stock of human capital,” and puts additional pressure on government revenue to provide basic services. High levels of fertility and closely spaced births also have an adverse effect on maternal health and increase child mortality (Todaro and Smith, Reference Todaro and Smith2009; Guinnane, Reference Guinnane2011).
Women's empowerment plays a crucial role in achieving lower levels of population growth, as emphasized at the United Nations International Conference on Population and Development in 1994. The recommendations of the conference underscored the relationship between high levels of fertility and the low status of women at home and in their communities. My findings support this hypothesis by showing that an increase in the bargaining power of women at the time of marriage increases their predicted probability of using the contraceptive pill postmarriage. In this sense, the study's findings have important policy implications for developing countries struggling to counter rapid population growth because taking steps to empower young, unmarried women would strengthen their bargaining position at the time of marriage.
Further studies are required to investigate how the distance from women's natal home affects the binding commitments made at the time of marriage.