In a recent review article, Ahlquist and Levi (Reference Ahlquist and Levi2011) characterized models of leadership as posing the “Life of Brian problem” following the 1979 Monty Python movie that depicted a crowd of skeptical followers listening to various speakers, trying to decide which messiah to follow. In this problem, and in related models of leadership emergence,Footnote 1 the focus is on the rhetorical strategies of candidates for leadership positions and on followers’ assessment of leader rhetoric. This approach emphasizes the leader's crucial role in providing information in the co-ordination game.Footnote 2 However in a real-world context, leaders do not rely solely on informational tools in order to rally and co-ordinate followers. They often resort to non-informational tools and offer rewards or punishments to their followers. A recent surge of theoretical studies exploring co-ordination and information exchange between leaders and followers has been accompanied by several experimental studies.Footnote 3 However there is still a lack of empirical research on the effectiveness of informational tools in real political settings. Even less is known about the interplay between the informational and non-informational tools that leaders use in such settings. This article provides such an empirical analysis of the informational theory of leadership and gauges the effects of the informational and non-informational tools that leaders employ to co-ordinate their followers.
To illustrate, we use the case of contemporary Russia, where it is possible to trace and estimate both the policy signals of leaders and the determinants of followers’ reactions to these signals. From May 2008 to September 2011, the Russian regime was characterized by the duality of executive power shared by Prime Minister Putin and President Medvedev. The exact power balance in the governing coalition was not publicly known, as highlighted by the prolonged uncertainty about which of the two leaders would seek re-election in 2012 and Medvedev's behind the scenes campaigning among business and political elites as late as the summer of 2011 (Parfenov Reference Parfenov2012). We argue that from 2008 to 2011 both leaders employed informational and non-informational tools to co-ordinate their followers. The empirical focus of this article is on a relatively large group of followers—leaders of federal sub-units—that did not belong to the inner circle of the political elites and that relied primarily on public information about future policy direction, as we explain in detail below.
Previous studies examining the strategic use of political rhetoric have largely relied on analytic narratives.Footnote 4 As suggested by Spirling (Reference Spirling2012), the scarcity of quantitative analyses is unsurprising, given that technical limitations related to analyzing large quantities of text have only recently been overcome.Footnote 5 We collected data on strategically important political speeches made by Putin and Medvedev from 2008–11, and corresponding speeches made by leaders of sub-national units. Using the Wordscore text scaling method proposed by Laver, Benoit and Garry (Reference Laver, Benoit and Garry2003), we use speeches made by these two federal leaders in a given year as reference texts and scale all available sub-national leader speeches. This allows us to spatially place all followers in relation to the two leaders. Repeating the exercise for all years under analysis lets us examine the dynamics of follower responses to the informational signals of leaders in the co-ordination game. We demonstrate that leaders employ various informational tools and that governors co-ordinate on these signals. However, our analysis also shows that the strategic calculations of follower co-ordination is determined by a combination of informational and non-informational leadership tools. We show that non-informational tools (particularly, rent redistribution) play a particularly important role, and that ignoring these effects can threaten the internal validity of causal inference in the analysis of leadership effects on co-ordination.
The next section outlines the theoretical context behind this study. In subsequent sections, the data and methods used in the analysis of political rhetoric are presented. We then report on the effectiveness of informational tools in followers’ co-ordination. In the final section we examine the interplay between informational and non-informational tools.
Informational and Non-Informational Tools in The Co-Ordination of Followers
Informational theories of leadership are commonly set up as co-ordination mechanisms in which members of the group (often referred to as followers) have symmetric preferences, but co-ordination on common strategy requires the external help of leaders.Footnote 6 In fact, leadership can be understood as a process of communication in which leaders’ signals facilitate the co-ordination of their followers. Several models have recently been developed from this basic setting, many of which focus on the informational aspects of leadership—on how leaders communicate their vision through rhetoric and how followers respond.Footnote 7
While the theoretical literature has made significant inroads into understanding how elites co-ordinate, empirical work is only starting to catch up. Several studies examine the strategic use of rhetoric by leaders in democraciesFootnote 8 and non-democracies alike,Footnote 9 with mixed results.Footnote 10 There is also significant historical evidence of leaders’ informational co-ordination efforts (Easter Reference Easter2000; Majumdar and Mukand Reference Majumdar and Mukand2010). A separate body of literature explores leadership effects in experimental settings,Footnote 11 again with mixed results. In general, findings from experimental research are usually derived in settings that are far removed from real political contexts. At the same time, historical analysis is largely qualitative, and lacks sufficiently robust analysis of political rhetoric. Therefore it remains to be seen whether an empirical study can demonstrate that followers react to their leaders’ policy signals—and whether such signals facilitate elite co-ordination in a real-world setting.
The aim of this article is twofold. First, as explained above, we intend to demonstrate whether (and how) followers react to their leaders’ policy signals, drawing from an empirical analysis of political rhetoric. Specifically, we intend to examine in a real political setting whether leaders’ informational signals help co-ordinate their followers. Thus we posit the following hypothesis:
Hypothesis 1: Leaders’ rhetoric has a direct effect on the co-ordination of followers.
Secondly, we extend the argument and propose that for co-ordination, leaders rely not only on informational but also on non-informational tools. Indeed, the existing research has not yet found whether informational signals can fully explain the co-ordination of followers in real political settings. Informational theories of leadership and related models do not include the possibility that any non-informational tools (for example, coercion, demotion, effect of outside interests) are available to leaders in addition to their use of rhetoric (Ahlquist and Levi Reference Ahlquist and Levi2011, 14).Footnote 12 In the process of leadership emergence and consolidation—“authority building” (Breslauer Reference Breslauer1982)—potential leaders have been shown to rely on non-informational tools: coercion (Levi Reference Levi2006), rent redistribution (Bueno de Mesquita et al. Reference Bueno de Mesquita, Smith, Siverson and Morrow2003) and patronage (Arriola Reference Arriola2009). Elite support, however, often breaks down during economic crisis, disagreement over succession or uncertainty over future leadership (Golosov Reference Golosov2011, 626).
In a commonsensical extension of standard models, we expect leaders to employ both informational and non-informational tools to facilitate the co-ordination of their followers. Thus these tools—as well as additional idiosyncratic individual preferences—determine followers’ strategic calculations in the co-ordination process. However, extending the standard model, we believe that informational signals are conditional on the non-informational ones.
Our argument about the conditional effects of leadership tools derives from basic research in communication and information processing. The followers are expected to better process and internalize information from leaders when it is accompanied by certain stimuli (non-informational tools) (Garner and Felfoldy Reference Garner and Felfoldy1970; Lord, Foti and De Vader Reference Lord, Foti and De Vader1984; Fraser and Lord Reference Fraser and Lord1988; Celsi and Olson Reference Celsi and Olson1988). The effect of non-informational tools is closely related to the motivational model of information processing intensity.Footnote 13 In this approach, the motive—for example, promotion or rent redistribution—is the mediator in information processing and subsequent belief change.Footnote 14 Since we expect the effect of informational tools to be conditional on the non-informational tools, our second hypothesis is:
Hypothesis 2: Followers’ strategic calculations are determined by the interaction of leaders’ informational and non-informational tools.
In summary, we intend (1) to establish that followers do react to their leaders’ rhetorical signals and (2) to examine the interactive dependency of informational and non-informational tools and how it determines the strategic calculus of follower co-ordination. In our case, as explained in the introduction, the two leaders are Putin and Medvedev and the followers are regional governors in the Russian Federation. We expect the strategic calculations of these followers to reflect the relative influence of the signals broadcast by the two leaders. Governors process these informational signals, which are conditional on non-informational tools (coercion, demotion, rent redistribution and patronage). Below, we describe the empirical context of our study, the data and identification strategy.
Background and Comparative Context
During the tenure of President Dmitry Medvedev (2008–12), Vladimir Putin was the most influential prime minister in modern Russian history. The sharing of executive power between two leaders has become known as a political duopoly and is also often referred to as a tandem (Sakwa Reference Sakwa2010). While analyzing the institutional and political characteristics of this arrangement is beyond the scope of this article, we highlight that it was not entirely clear who the de facto head of the executive was during this period. Indeed Prime Minister Vladimir Putin—who had previously served as president—also headed the ruling party, United Russia, which controlled the constitutional majority in the lower chamber of parliament (Remington and Reuter Reference Remington and Reuter2009). Importantly, many of the most influential officials, including President Medvedev himself, owed their elevation to high office directly to Putin.
It should be noted that such a political setup is not a uniquely Russian phenomenon, and that the exact distribution of power within executive duopoliesFootnote 15 is often unclear. The comparative evidence highlights the fact that it is not always known in advance whether the duopoly is in fact a disguised continuity, with the formal leader being a mere figurehead (Baturo forthcoming). Alternatively, the predecessor may share power with a junior colleague until the successor establishes control. Finally, there may also be a genuine uncertainty among political elites about who is in charge. Many presidents, after formally departing and ensuring the election of their designated successor, retain control over the executive, only to depart later. Nyerere (1964–85) of Tanzania stepped down in 1985 but continued in his role as national guardian; he remained chairman of the ruling party until 1990, when in his second term his successor assumed the party chairmanship. Examples equally abound of former presidents who hoped to retain their influence, but were brought down by their emboldened successors. Thus President Ahidjo (1960–82) of Cameroon stepped down but remained as head of the ruling party until he clashed with his successor, Biya, and lost his post. In a similar case to Russia, Mexican president Porfirio Diaz (1876–80, 1884–1911) stepped aside for the whole term of his chosen successor in 1880, only to return in 1884. Later, between 1917 and 1936, political power in Mexico was often shared between the incumbent president and the national political leader—the head of the ruling party (jefe maximo). During that period, jefe maximo also ruled via proxies that occupied the presidential palace.
While President Medvedev did not challenge his prime minister publicly, Medvedev occupied the most constitutionally powerful position: among other things, the president has the power to dismiss the prime minister and the cabinet, and dissolve parliament. In the leadership literature, this division of power is known as assigned leadership or the role occupancy approach to leadership. This operationalization of leadership emergence focuses on whether the individual holds an office with leadership functions. This approach captures an important feature of leadership, since many people “lead as a consequence of their status – the power of the position they occupy” (Bass and Stogdill Reference Bass and Stogdill1990, 19). Furthermore, Medvedev consistently distinguished himself by signaling a distinct policy program (Baturo and Mikhaylov 2012).
In retrospect, the validity of Medvedev's presidency and the prospects for his second term are easy to dismiss.Footnote 16 However, contemporary sources show that the president seriously campaigned among political and business elites to garner support for his re-election bid. The ultimate decision about the nomination was also not revealed even to the closest supporters of either Putin or Medvedev, let alone to other politicians such as the regional leaders, until the very end (Kostenko, Taratuta and Glinkin Reference Kostenko, Taratuta and Glinkin2011). A well-publicized example is the situation with Alexei Kudrin, who was finance minster at the time, and reportedly a close personal friend of Putin. According to Kudrin, he learned of Putin's decision to return to the presidency, with Medvedev taking over as prime minister, at the same time as the rest of the country (on 24 September 2011). Immediately following the news, Kudrin declared that he would not work in the new cabinet under Medvedev and was promptly fired from his post by the president. Medvedev's closest advisor, Andrei Dvorkovich, reacted negatively to the same news and was officially reprimanded. Kudrin later recalled: “I saw that he wanted to be nominated again. He [Medvedev] underlined it, as a matter of fact, at every meeting. I did not think he pretended” (Parfenov Reference Parfenov2012). The case of Medvedev's presidency is, therefore, characterized by the observed duality of power, in which any arrangement between Putin and Medvedev remained private at least for the majority of Russian elites. Therefore it can be argued that regional leaders in Russia had to co-ordinate under significant uncertainty in the course of Medvedev's presidency.
In a real-world political setting, follower co-ordination happens in an extremely noisy and highly uncertain environment. In such an environment it is often difficult to empirically evaluate the effect of the signal from a leader on co-ordination. As we explain below, however, in the context of Medvedev's presidency we are able to identify the effect of the leaders’ communication strategies. We also have some data on the non-informational tools at leaders’ disposal, and we are able to empirically assess the relative effectiveness of these tools in follower (governors) co-ordination.
Using Speeches As Data
Under general political uncertainty during Medvedev's presidency, the policy rhetoric of leaders and followers can be quantitatively analyzed. In Russia, both the president and prime minister address the parliament annually. Their addresses are similar in form to the annual State of the Union addresses of US presidents to Congress. Normally, Russian presidential addresses review the achievements of the past year, discuss current problems, review policy implementation and outline plans for the immediate future. While all Russian presidents address the federal parliament annually, Putin delivered the first such address by a prime minister in 2009. We collected Putin's annual addresses from 2009, 2010 and 2011, as well as his major speech in 2008Footnote 17 and Medvedev's addresses in 2008–11. Annual addresses are comprehensive texts in terms of their policy scope and their heavy reference in the media, and can reasonably be expected to reflect leaders’ policy preferences. Both leaders delivered speeches that were comparable in scope and length.
For the data required on followers, we collected speeches by leaders of sub-national units. Regional leaders are legally required to deliver annual addresses to regional parliaments.Footnote 18 These largely follow the same structure as the annual addresses of federal leaders, while also covering corresponding regional issues. We collected 233 speeches by regional leaders delivered to their parliaments from November 2008 (the first annual parliamentary address by President Medvedev) to July 2012, of which 168 were delivered before Putin's re-election announcement on 24 September 2011.Footnote 19 Since regional leaders rarely discuss international affairs, the data was pre-processed by removing sections dealing with foreign affairs from the speeches.
As discussed above, speeches by regional leaders are expected to reflect signals received from the president or prime minister. As a first step, we simply read through all the speeches. During his tenure as president, Putin focused on the importance of a strong state, state-led development, energy security and political stability. He continued emphasizing these issues after becoming prime minister. He also repeatedly spoke on the issue of modernization, primarily emphasizing state-driven technological modernization of the economy. In turn, President Medvedev started off emphasizing policy continuity with his predecessor. Over time, however, he positioned himself as an advocate of more liberal views, both in terms of economic policy and political liberalization. This liberal agenda allowed the president to broadcast the distinctiveness of his policies to the domestic audience—particularly to the elites. Although this was done cautiously (even timidly), many external observers picked up the signal. For example, Urnov (Reference Urnov2011) delineates Putin and Medvedev's modernization programs as conservative and liberal, respectively. He suggests that their public statements are not only personal positions, but also “reflect the positions of different groups of the Russian elites and the different and competing groups of interests oriented on these two leaders” (Urnov Reference Urnov2011, 2). Putin and Medvedev's differing positions thus “mirror a deep divergence in their approaches to the development strategies of the country” and their public statements represent “different political ideologies” (Urnov Reference Urnov2011, 2).
Focusing more specifically on the addresses to federal parliament, both leaders touch on common topics. Although the politicians rarely declared opposing policies, they tended to emphasize or de-emphasize certain topics, thus signaling their personal policy preferences.Footnote 20 Our reading of the speeches by regional leaders is that to a large extent they either emphasize the themes from the presidential address or that of the prime minister, or try to balance the key themes from both. We therefore expect that incorporating the key themes from one or other of the national leaders indicates the relative effect of the leaders’ signals. In spatial terms, we take the relative closeness to the position of either national leader as an indication of the effect of that leader's signal on the follower.
Quantitatively Analyzing Leaders’ Signals
In our quantitative analysis of political rhetoric, we are interested in tracking the responses of regional leaders relative to the rhetorical signals of two national leaders. This naturally leads us to use the Wordscore text scaling method (Laver, Benoit and Garry Reference Laver, Benoit and Garry2003), which places texts on a single dimension that is set a priori. The dimension is structured by two anchors on both sides. In general terms, Wordscore uses two documents with well-known positions as reference texts. The positions of all other documents are then estimated by comparing the reference documents. The underlying logic is that a document that is similar (in terms of word frequencies) to a reference document has been produced by an author with similar preferences.Footnote 21 This is an important feature of Wordscore, since it implies that the scaling of speeches made by regional leaders in relation to those of the national leaders allows us to focus on commonalities across political rhetoric, discounting any idiosyncratic issues that may feature at the regional (but not the federal) level. The selection of reference documents determines the (assumed) underlying dimension for which document positions are estimated. In our case the dimension is naturally defined by the leader (Putin) and the occupier of the top leadership position (Medvedev). The scores of our reference texts were set at −1 and 1 for Medvedev and Putin, respectively.
One of the challenges of dynamic estimation using text scaling methods is that genuine positional change can be mistaken for a topical evolution in the country's political rhetoric (Herzog and Mikhaylov Reference Herzog and Mikhaylov2010; Proksch and Slapin Reference Proksch and Slapin2009).Footnote 22 The former is the goal of text scaling models,Footnote 23 while the latter is a function of a new vocabulary entering the political lexicon over time. In the context of Wordscores estimation, we deal with the possibility of a topical evolution by carrying out separate estimations for each year in our sample. For each year, the annual speeches of Putin and Medvedev are taken as reference texts, and all available speeches from regional leaders made after federal leader addresses are scaled. Additionally, years were set as spanning between consecutive presidential addresses (delivered in November or December), so that all speeches by regional leaders are made after those of the president. Following Benoit and Laver (Reference Benoit and Laver2008), the study focuses on the raw score estimates, making the results robust to variations in the number of regional speeches collected for each year.
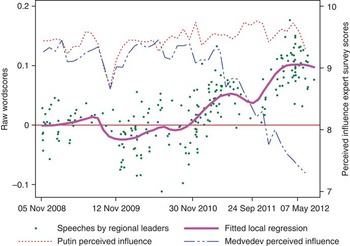
A standard issue with text scaling techniques (Wordscores, Wordfish, etc.) is validating the results.Footnote 24 For validation, we compare an external expert survey that measures the relative influence of both national leaders with our Wordscore estimation results. We use a monthly expert survey that asks respondents to rank 100 political actors, including Putin and Medvedev, by their perceived political influence.Footnote 25 For this exercise we scaled all available speeches by regional leaders from early November 2008 (President Medvedev's first address to parliament) to the latest available speech at the end of July 2012: 233 speeches overall. As described above, we perform a separate estimation for each time period (four panels overall). Figure 1 presents the text scaling results with the fitted local regression line and the monthly scores of Medvedev and Putin's perceived influence in corresponding time periods.
(Colour Online) Perceived influence of Medvedev and Putin overlaid with the raw Wordscores Note: perceived political influence is taken from monthly expert surveys, Nezavisimaya Gazeta-APEK. The top dashed line is the expert survey score for Putin, and the lower dashed line is the survey result for Medvedev. The scatter plot corresponds to individual speeches made by regional leaders (higher scores indicate positions closer to Putin), with the local regression line fitted through (thick solid line). A thin solid line (red online) is added at the point of equidistance (0) between the positions of president and prime minister. The horizontal axis indicates the beginning of the sample period and Medvedev's years in office.

Regional leaders’ increased proximity to Putin over time—and a corresponding increased distance from Medvedev—are also picked up in expert survey results after several months. From the autumn of 2010, when Medvedev was unable to install his own candidate as the mayor of Moscow, his influence gradually declined. As we explain below, following his May 2011 press conference (Kostenko, Taratuta and Glinkin Reference Kostenko, Taratuta and Glinkin2011), the president was able to arrest this downward trend temporarily, however his support plummeted following Putin's nomination in September. Vagaries of the president's influence are equally reflected in governors’ positions and experts’ assessments, which suggests a high degree of face validity in our text scaling estimates, as both regional leaders and experts clearly react to the same signals. Below, we turn to our first hypothesis and examine the effects of specific signals to which followers react over time.
Do Leaders’ Signals Affect Follower Rhetoric?
The key question for informational theories of leadership is whether leaders’ information signals affect their followers’ co-ordination. In order to identify the effect of signals on co-ordination, it has to be assigned “as good as random”. This presents a major challenge for most studies of leadership that deal with observational data. Our identification strategy focuses on two unexpected events during the pre-election year.
As discussed earlier, the second half of Medvedev's term in office was spent under continuous speculation and resulted in uncertainty over which of the two leaders would run in the 2012 election. Less than a year before the 2012 presidential election, there was wide expectation that Putin would use his most important public statement—the prime ministerial address to parliament—to signal his decision to the public. However he said absolutely nothing on the matter. His speech contained no clues or hints about his plans to participate in the election himself or support Medvedev's bid for a second term in office. This silence on the most salient political matter of the day increased uncertainty among the elites. Five months later, Putin announced that he would seek re-election to the presidency, thus abruptly ending Medvedev's re-election expectations. This announcement was sudden and caught the country by surprise. The decision was unknown even to either leader's closest supporters until the very last moment (Kostenko, Taratuta and Glinkin Reference Kostenko, Taratuta and Glinkin2011). Furthermore, the timing of the announcement was not anticipated and it sent a clear signal to followers. We therefore treat both speeches by Putin as signaling interventions.
We assess whether these two signaling interventions had a statistically significant effect in the extended 2011 sample of speeches.Footnote 26 If a leader's signals have a causal effect on followers’ rhetoric, we would expect to see a change in the latter's rhetorical positions either side of the two interventions. We estimated the model using a quasi-experimental interrupted time-series design on both daily and monthly data, identifying the interruption dates as 20 April 2011 (Putin's annual address to parliament) and 24 September 2011 (Putin's re-election announcement).Footnote 27
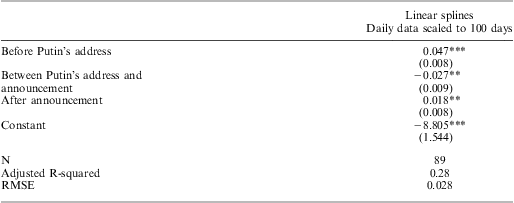
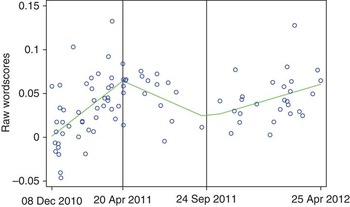
With all the included knots being statistically significant (Table 1), the results show that before Putin's parliamentary address regional leaders were moving rhetorically closer to him. According to our theory, this shows that they applied heavier weight on Putin's position due to the informational and non-informational tools available to him. We analyze this supposition in the next section. Indeed, with the incumbent president failing to step forward and announce his candidacy, coupled with more feeble rhetoric in his December 2010 address than in his 2008 and 2009 addresses, it is conceivable that followers had decided to commit to the prime minister. When Putin in turn stood back and remained silent on the matter of re-election in his parliamentary address, followers became more uncertain again. However they clearly responded to the prime minister's re-election announcement and rallied towards their future president. As an illustration, Figure 2 contains the scatterplot of raw Wordscores with the fitted line of predicted values from the linear spline regression above. Two signaling intervention points are highlighted with vertical reference lines.
Effect of Signaling Intervention on Regional Leaders’ Rhetorical Positions
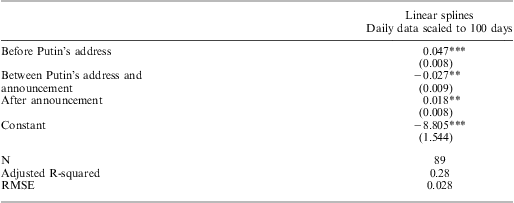
Note: the dependent variable is the raw Wordscores. The two signaling interventions are Putin's parliamentary address on 20 April and the announcement of his re-election bid on 24 September. Estimations use daily data rescaled to 100-day increments for ease of presentation.
***p<0.01, **p< 0.05.
(Colour Online) Reaction of regional governors to leader's signals in 2011 Note: all speeches made after 30 November 2010. Higher scores indicate positions closer to Putin. Fitted line represents predicted values from linear spline estimation.

In general, the results support the first hypothesis: that leaders use informational tools for elite co-ordination and that these tools have a direct impact. Indeed, governors became more certain in their future policy direction following 24 September 2011: in the period after the announcement, the standard deviation of raw scores is reduced to 0.028, in contrast to the preceding period when it is 0.041. In the next section we assess the second hypothesis and gauge the effectiveness of informational and non-informational tools.
Testing The Interrelationship Of Different Leadership Tools
As argued in the theoretical section, it is likely that not only informational but also non-informational tools at leaders’ disposal will influence follower co-ordination. Moreover, the effect of informational tools will be conditional on non-informational tools. In this section we turn to our second hypothesis and analyze specific determinants of follower co-ordination. In practical terms this means that we attempt to explain the raw Wordscores using a set of variables that characterizes different leadership tools and their interactions. Lowe (Reference Lowe2008) shows that Wordscores is an approximation to correspondence analysis that naturally extends to inferential analysis, known as the structured data analysis of multiple correspondence analysis (Le Roux and Rouanet Reference Le Roux and Rouanet2004, Ch. 6).
In signaling to their supporters, leaders use a variety of informational tools in addition to their annual parliamentary addresses. While these addresses are public and cover the most important topics of political life, leaders may use other arenas to send public signals to their supporters.Footnote 28 Given the multitude of possible arenas used to deliver such signals (for example, interviews, press conferences and televised public appearances), it is impossible to quantify them directly. However, we expect that in order not to miss any important signals the political antennae of regional leaders are tuned in to the public sphere. As a general, and admittedly noisy, indicator of this process we evaluate the overall media coverage of the speeches and public appearances of both the prime minster and president. We expect that any increase in the media coverage of one leader over another will be interpreted as a public signal that the former is likely to emerge for nomination. We use a Media Publicity variable to capture this general public media signaling effect; it compares the share of all media references to Putin and Medvedev. The variable is calculated quarterly.Footnote 29 Here, we expect that if the leaders employ informational tools, they anticipate these will work. As such, these signals should affect followers’ strategic calculations and be reflected in their rhetorical positions. In order for this effect to work through the causal mechanism, this would require that signals transmitted via the public sphere in the current time period should be reflected in the speeches of regional leaders in the next time period. Hence the Media Publicity variable is calculated for the quarter preceding the period when followers make their speeches.
In addition to informational tools, we also expect leaders to employ non-informational tools. Bueno de Mesquita et al. (Reference Bueno de Mesquita, Smith, Siverson and Morrow2003) suggest that one such tool is the redistribution of private rents among followers. Much rent seeking in Russian circumstances derives from the exploitation and redistribution of rents from natural resources. According to the 2011 International Energy Agency World Energy Outlook (IEA 2011, Ch. 9) report, oil and gas revenues contribute about half of the federal budget income. Furthermore, Russia has an extremely centralized tax system for a federal state. Oil-related taxes and tariffs (for example, taxes on mineral resource extraction, mandatory renewable energy target and oil export tariffs) are federal sources of income that bypass regional authorities completely.Footnote 30 In turn, the Finance Ministry drafts the Russian budget with a forecast for the annualized oil price for the Urals within a specific deficit target. If the price of oil increases above the budgeted price, the Russian government receives unanticipated extra revenue. This additional revenue, with certain limitations like transfers to a sovereign wealth fund, can be spent over and beyond the outlays in the budget. Thus we created a variable, Redistribution Premium, to capture the difference between the Urals oil price (lagged one month to the date of the speech) and the price used to draft the budget for that year.Footnote 31 When the premium is positive this provides the government with cash that can be used for discretionary redistribution to the regions; if it is negative the government will move to tighten expenditures and possibly increase fiscal pressure. In our case, while the president controls the strategic parameters of the budget, the operation of the budget (and oil premium) is under the purview of the government. Thus we expect a higher oil premium to indicate that the prime minister is more likely to redistribute private rents as part of his arsenal of non-informational tools.
As an alternative causal mechanism for the effect of the Redistribution Premium, we can focus on regional leaders’ expectations. Given the Russian state's heavy dependence on oil revenue, the price of oil can also affect the long-term expectations of government policy. Thus higher oil prices may indicate sufficient resources to maintain the status quo and postpone economic and political reforms in the country. In turn, endemic corruption in Russia means that maintaining the status quo results in further private rents for national and regional leaders. Overall, we expect regional leaders to internalize the growing price of oil as potential future private rents.
Another non-informational tool, as suggested by Levi (Reference Levi2006), is coercion. More specifically, we can test whether appointing and dismissing regional leaders affects their rhetorical strategies. Medvedev has actively used his constitutional prerogative to fire and appoint regional politicians. Although we expect a certain degree of consultation with the prime minister over these matters, there are some indications that the president was proactive in this role.Footnote 32 Likewise, since regional leaders whose term in office expires during the term of the incumbent president will be more vulnerable to potential coercion from the latter, we created an indicator for whether regional governors were Due for Reappointment before the end of Medvedev's term in office. Similarly, we collected data on whether regional leaders were Appointed and Reappointed by Putin. We would expect that regional leaders appointed by Putin would be closer to him than Medvedev, potentially capturing some of the loyalty effect and the powers of patronage. As an additional control, we added Time after Medvedev's Speech to account for the possibility that regional leaders are more responsive shortly after the president makes his speech. For example, it is not inconceivable that followers are more likely to incorporate “modernization” rhetoric if their speeches follow that of the president.
Additionally, some federal subjects may have sufficient revenue streams to make regional leaders less dependent on the redistribution of rents from the center. This, in turn, can make regional leaders less sensitive to the fiscal tools available to the prime minister. We test for this possibility by controlling for more fiscally independent regions using the Share of Regional Taxes in Expenditure variable, which is estimated as the percentage of total taxes collected in the region in relation to total expenditure. We expect that governors with more fiscal independence have a greater regional power base, will be more resilient to pressure from the federal center and may occupy a more neutral rhetorical position.
Arguably, followers, even though they care about party unity and respond to leadership tools, may also have individual policy preferences that will mediate their responses to signals. We treat this possibility as minor, since authoritarian elites are primarily driven by the perceptions of power rather than ideology (Bueno de Mesquita et al. Reference Bueno de Mesquita, Smith, Siverson and Morrow2003, 65–9); symmetric preferences of followers are also common in informational theories of leadership. There are also no data to estimate governors’ latent policy preferences distinctly from the preferences they reveal through rhetoric. As an indirect proxy, however, we can account for their previous party affiliations. While virtually all regional leaders are members of the governing party, several governors were previously affiliated with pro-democratic parties, such as the governors of the Kirov or Astrakhan regions, Belykh and Zhilkin, respectively. We also include an indicator to show whether a governor has been previously directly elected rather than appointed. It is expected that having Electoral Experience before the introduction of the appointment system may result in a higher resistance to coercion due to previously acquired popular mandates.
Using raw Wordscores, we focus on the period from late 2008 until the date Putin announced his bid for re-election. Overall, this results in 168 speeches delivered by regional leaders from 74 sub-national units. We regressed Wordscores for each regional leader on the set of variables described above and on interactions of variables that capture informational and non-informational tools.Footnote 33 We also included yearly and regional fixed effects: two-way fixed effects account for any idiosyncrasies relating to regions or time periods. Regional leaders are not isolated individuals. They represent the interests of regional elites and solve a co-ordination game on the regional level that is similar to that which national leaders solve on the federal level. Regional leaders use their speeches to send signals to their followers (the regional elites). Thus we introduce regional fixed effects to control for the peculiarities of regional co-ordination games and any other idiosyncrasies of the regions they represent.Footnote 34
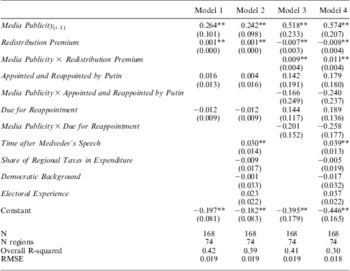
The results of the estimation are presented in Table 2. Model 1 focuses on the independent effects of informational and non-informational tools. Model 2 introduces additional control variables that may explain followers’ strategic calculations as discussed above. Models 3 and 4 introduce the interrelationship between informational and non-informational tools through the interaction terms.
Informational and Non-informational Determinants of Followers’ Strategic Calculations

Note: the dependent variable is the raw Wordscores. Positive coefficients stand for positions closer to Putin. Estimation is conducted with two-way fixed effects (region and year). HAC robust standard errors in brackets.
**p < 0.05, *p < 0.10.
Looking at the results in Models 1 and 2, we find that informational—and some of the non-informational (redistribution premium)—tools appear to play a significant and positive role in determining followers’ co-ordination. For example, the more media exposure Putin received, the more closely aligned the regional leaders became with him. Similarly, the higher the Redistribution Premium, the closer the regional leaders are to Putin.Footnote 35
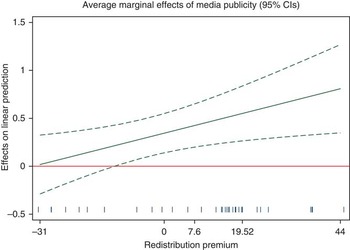
As argued earlier, however, followers’ strategic calculations in the co-ordination game are expected to be determined by a mixture of informational and non-informational effects. Models 3 and 4 test this argument by introducing the corresponding interaction effects. The interaction between media publicity and Redistribution Premium is the only statistically significant interaction term. Indeed, unlike other non-informational tools whose effects often depend on regional leaders’ individual circumstances, Redistribution Premium influences the calculations of all followers. For a substantive interpretation of the interaction effect we calculate marginal effects and plot them on Figure 3.
(Colour Online) Average marginal effects of media publicity over the range of redistribution premium Note: the figure plots average marginal effects of Media Publicity over the range of Redistribution Premium (difference between actual monthly oil price and anticipated oil price used to draft the federal budget). The results are based on the interaction effects in Model 4, Table 2. The rug plot shows the distribution of raw data for the Redistribution Premium, with the minimum/maximum, inter-quartile range, and zero points marked on the x-axis.

Our results suggest that the marginal effect of the greater media publicity received by Putin compared to Medvedev increases with the amount of discretionary finances available to Putin. Anticipation of financial redistributions from the federal center motivates governors to pay much closer attention to the signals sent by Premier. Alternatively, we can see that higher oil prices, and the expectation of private rents, render Putin's statist vision of Russia a more attractive proposition, thus making the followers take his media message more seriously. Unanticipated extra revenue for the state due to changes in oil prices—and the increased publicity of a leader whose policies depend on natural resource rents—reinforce each other and magnify the signal that followers receive.
Overall, we find support for the second hypothesis and show that a combination of informational and non-informational effects determines the strategic calculi of followers in the co-ordination game. Ignoring this interrelationship between the two leadership tools threatens the internal validity of the statistical inferences of causal effects in empirical leadership studies. This misspecification of the functional form by omitting the interaction effect may bias inferences on causal effects.
Discussion and Conclusions
Our results show strong empirical support for the importance of informational tools in the process of leadership in a real political environment. We also show that informational signals have a direct impact on followers’ rhetorical responses. Importantly, however, we show that an interplay of informational and non-informational tools determines follower co-ordination. Ignoring this complicated interaction can result in the biased estimates of causal effects in empirical studies of leadership.
Additionally, we find no evidence that coercion or patronage play a significant role in co-ordination in our case. These results support the notion that leadership is a voluntary exercise (Hermalin Reference Hermalin1998) and that coercion does not play a role in the leadership process, contrary to findings by Levi (Reference Levi2006). Admittedly, it is conceivable that our research design cannot fully control for the possibility that the patron-client relationship is “contaminated”. Indeed, as explained earlier, President Medvedev exercised considerable influence in the appointment of regional leaders, often overriding the reservations of federal envoys and forcing many leaders to step down. However, early in his term he consulted Putin on major appointments decisions.Footnote 36 It is therefore possible that some regional leaders had conflicting loyalties to both leaders, thus negating the effects of the appointment indicator in our analysis.
We believe that our results—particularly those related to the effects of informational tools—are sufficiently generalizable. Our operationalization of some non-informational tools may be more case specific. However this only highlights the fact that researchers need to fine tune the operationalization of non-informational tools depending on specific settings of their case, and does not negate the generality of the causal model of conditional effects of informational and non-informational tools on followers’ co-ordination. While the duality of executive power in Russia presented an excellent opportunity to examine elite co-ordination, further research in different settings will enable scholars to isolate the effects of non-informational tools more unequivocally.
Overall, this article contributes to the larger literature on leadership. Despite significant advances in formal studies on leadership to date, empirical analysis of theoretical implications has been largely conducted in experimental settings that are far removed from the real political environment. This article has shown how informational theories of leadership can be empirically evaluated through quantitative analysis of political rhetoric. Furthermore, the quantitative text analysis employed in the observational study can also be applied in experimental designs to analyze participants’ rhetoric. This article also breaks new ground by highlighting the importance of the interrelationship of informational and non-informational tools of leadership in real political settings.
Our study also has implications beyond the leadership literature. The questions relating to elite co-ordination and how rulers and followers sustain their coalitions are central to political science research. Indeed, elite splits have long been crucial to our understanding of regime change. This study demonstrates how scholars who are interested in studying intra-regime politics can examine elite co-ordination and the emergence of regime splits and defections using quantitative text analysis tools. Such analysis can improve our understanding of elite management, their responses to leaders’ conflicting policy signals and the mechanisms for the emergence of such splits.