1. Introduction
The process of entrainment is a defining feature of turbulent fountains – the flow established when the momentum flux of an otherwise jet-like source is opposed by the force arising from a flux of buoyancy. In addition to inducing a flow in the surrounding environment, mass transfer from the environment to a fountain due to entrainment controls the rate of dilution, both of the buoyancy scalar and of any contaminant advected from the fountain source. Moreover, entrainment plays a key role in determining the physical shape and volume of a fountain. In this study we present direct experimental measurements of entrainment by turbulent fountains from circular sources in otherwise quiescent uniform surroundings. Our results encompass source Froude numbers in the range
 $0.004\leqslant \mathit{Fr}_{0}\leqslant 25$
. To our knowledge, this is the first dataset to quantify entrainment by fountains for which the source conditions are prescribed rather than inferred.
As is conventional, we define the source Froude number as
 $\mathit{Fr}_{0}=w_{0}/\sqrt{g_{0}^{\prime }r_{0}}$
, where
 $r_{0}$
denotes the radius of the source,
 $w_{0}$
the mean vertical source velocity and
 $g_{0}^{\prime }=g({\it\rho}_{0}-{\it\rho}_{a})/{\it\rho}_{a}$
the source reduced gravity (or buoyancy) in which
 ${\it\rho}_{0}$
and
 ${\it\rho}_{a}$
denote the constant density of the source and ambient fluids, respectively. Our focus herein is on Boussinesq releases, i.e. those for which
 ${\it\rho}_{0}-{\it\rho}_{a}\ll {\it\rho}_{a}$
.
Entrainment is common to all turbulent free-shear flows, including jets, plumes and fountains. For jets and plumes, experimental studies of entrainment frequently centre around determining an entrainment coefficient for use in a turbulence closure model, for example in the closure model of Morton, Taylor & Turner (Reference Morton, Taylor and Turner1956). Determining a suitable entrainment coefficient experimentally and particularly its precise variation with height, or with the local Richardson number, is non-trivial and efforts still continue to this date (Ezzamel, Salizzoni & Hunt Reference Ezzamel, Salizzoni and Hunt2015).
Attempts to capture the dynamics of fountains by simplified theoretical models share a long history with the modelling of plumes, from early works (e.g. Morton Reference Morton1959) to more modern developments (e.g. Bloomfield & Kerr Reference Bloomfield and Kerr1998; Kaye & Hunt Reference Kaye and Hunt2006; Carazzo, Kaminski & Tait Reference Carazzo, Kaminski and Tait2010). The application of plume theory to established fountains, i.e. to their quasi-steady behaviour subsequent to the initial (rise and fall) transients, ideally requires a parameterisation for the exchanges of fluid between the ejected core and the counterflow, and between the counterflow and the ambient. A clear understanding of the internal flow on which to base a parameterisation is not well established; publications reporting results are scarce (e.g. Cresswell & Szczepura Reference Cresswell and Szczepura1993; Williamson, Armfield & Lin Reference Williamson, Armfield and Lin2011) and firm conclusions are difficult to draw. However, measurements of the bulk entrainment of ambient fluid, i.e. entrainment over the fountain as a whole, can be made with reasonable accuracy (§ 2) and the presentation of these measurements forms the focus of this article. Measurements of bulk entrainment provide estimates for the mean dilution of the buoyancy scalar over the fountain as a whole and, whilst not resolving entrainment rates locally, require no assumptions to be made regarding the internal flow nor the nature of the entrainment process.
A number of studies have investigated entrainment across density interfaces due to localised forcing by a fountain-like flow. Typically fluid from a localised source is ejected vertically upwards within a stratified (often two-layer) environment to form a fountain-like flow above the interface and the entrainment flux inferred by measuring the time derivative of the height of the interface (e.g. Baines Reference Baines1975; Kumagai Reference Kumagai1984; Cardoso & Woods Reference Cardoso and Woods1993). Although these flows are indeed fountain-like, their entrainment is influenced by the stratification, which tends to flatten or ‘pancake’ the turbulent structures responsible for the entrainment. To our knowledge, the only study explicitly seeking to report results for entrainment by fountains is that of Baines, Corriveau & Reedman (Reference Baines, Corriveau and Reedman1993) in which a dense saline solution was ejected vertically upwards to form a fountain within an initially uniform aqueous environment. The descending counterflow that formed spread laterally on reaching the base of the tank to produce a saline layer. By measuring the rate at which the saline layer depth increased, the total volume flux in the fountain’s counterflow at the height of the interface (separating saline and freshwater layers) was inferred. The entrainment above the interface was then deduced by estimating the volume flux in the rising dense jet-like core of the fountain at the level of the interface (on assuming the width of the core increased linearly with height between the level of the source and the interface). Baines et al. (Reference Baines, Corriveau and Reedman1993) established a weak downward flow within the environment, which (for the vast majority of the approximately 125 reported data points) simply caused the interface to rise more slowly (see their figure 6). For eight data points corresponding to interfacial Froude numbers
 $\mathit{Fr}_{i}\leqslant 0.7$
, a stationary interface was achieved far above the source. A further three experiments were described as ‘measured by moving the source to maintain the interface at the source elevation’ although no further details regarding the movement of the source were provided. Their study concludes that
 $Q_{E}/Q_{i}\propto \mathit{Fr}_{i}^{3}$
for
 $\mathit{Fr}_{i}\leqslant 3.0$
and
 $Q_{E}/Q_{i}\propto \mathit{Fr}_{i}$
for
 $\mathit{Fr}_{i}\geqslant 3.0$
, where
 $Q_{i}$
denotes the volume flux of the core at the level of the interface.
In the present study we report results for the bulk entrainment by turbulent fountains obtained using a modification to the experimental technique described by Baines (Reference Baines1983) for measuring the volume flux in a plume. The modification enables the aforementioned interface position to be held fixed in the plane of the source, thereby enabling, for the first time, the conditions of the flow at a stationary interface to be prescribed. Furthermore, the entrainment is therefore measured in the absence of interactions with a density interface. In addition, this set-up offers two further advantages: (i) the flow into the upper layer is precisely the flow from the source, which can be prescribed without the need to apply theoretical estimates of its evolution, and (ii) the entrainment can be deduced from measurements of the stationary position of the interface rather than its time derivative. The resulting set-up both simplifies the physics (for example, by removing the excitement of interfacial waves by the rising core), and provides an unprecedented level of accuracy for the measurement of bulk entrainment by fountains.
The remainder of this paper is structured as follows: details of the experimental technique and set-up are given in § 2; our measurements are presented and discussed in § 3; and the conclusions drawn in § 4.
2. Experimental measurements of bulk entrainment
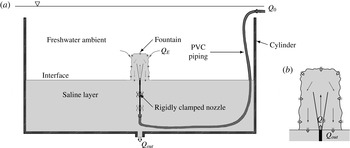
Baines (Reference Baines1983) conceived an elegant technique to measure the volume flux in a plume. We modified his basic technique in order to directly quantify the total volume flux entrained by an aqueous saline fountain. Our measurement was made in the plane of the source – a level that corresponds to the height at which the free-falling counterflow ceases to interact with the rising core of the fountain. We refer to the counterflow at this level as the fountain outflow. Figure 1 shows our set-up to measure the fountain outflow volume flux
 $Q_{out}$
and thereby deduce the volume flux entrained by the fountain
 $Q_{E}=Q_{out}-Q_{0}$
, where
 $Q_{0}$
denotes the source volume flux.
Schematics of (a) the experimental set-up showing a stationary horizontal interface (at the level of the source) separating saline (shaded) and freshwater layers in a circular cylinder, and (b) the outline of a fountain with the bulk fluxes into and out of the fountain marked by arrows.

A saline fountain was formed by the steady injection of an aqueous solution of sodium chloride (
 $3~\text{cm}~\text{s}^{-2}\leqslant g_{0}^{\prime }\leqslant 183~\text{cm}~\text{s}^{-2}$
) using a gear pump. Source volume fluxes of
 $18~\text{cm}^{3}~\text{s}^{-1}\leqslant Q_{0}={\rm\pi}w_{0}r_{0}^{2}\leqslant 540~\text{cm}^{3}~\text{s}^{-1}$
were ejected vertically upwards from a smooth-bore cylindrical nozzle (
 $0.51~\text{cm}\leqslant r_{0}\leqslant 15~\text{cm}$
) into a visualisation tank.
The visualisation tank was a concrete-walled structure of internal (horizontal) cross-section
 $520~\text{cm}\times 280~\text{cm}$
, which was filled to a depth of 260 cm with fresh water. The walls housed 12 viewing panels aligned in pairs across the tank, with each consisting of a clear glass pane of viewing height 152 cm and width 91 cm. Immersed within the tank was a hollow clear Perspex cylinder of height 100 cm and internal diameter 100 cm. The cylinder was open at the top and sealed at the base except for a centrally located opening (figure 1). An ‘extract pump’ connected to this opening extracted fluid at a rate
 $Q_{out}$
. For accuracy, the choice of extract pump was itself varied depending on the required flow rate
 $Q_{out}$
.
Beginning with a cylinder entirely filled with fresh water, the turbulent plume-like flow descending from the fountain formed a saline layer at the base of the cylinder. A well-defined interface formed between the lower saline and upper freshwater regions. On activating the extract pump, the interface tended towards a unique height corresponding to the level at which the volume flux in the counterflow was equal to the flow rate of the extract pump. This stationary interface height was then iteratively adjusted (by altering the flow rate of the extract pump) until it was coincident with the level of the fountain source. The volume flux in the fountain outflow,
 $Q_{out}$
, was then equal to the known flow rate of the extract pump. The bulk entrainment by the fountain was then inferred directly via
 $Q_{E}=Q_{out}-Q_{0}$
.
To aid visualisation, the apparatus was diffusely back-lit using an array of high-frequency fluorescent tubes and the saline released from the fountain source was stained with a dye. Images of the fountain and the interface were digitally recorded using a charge-coupled device camera (a JAI
 $\text{CVM}4^{+}\text{CL}$
) at a frequency of between 2 and 24 frames per second for intervals between
 $3600$
s and
 $11\,000$
s. From the images (and directly by eye) we were able to ensure that the interface was stationary and coincident with the plane of the source to an accuracy of approximately 0.1 cm. For
 $50~\text{cm}^{3}~\text{s}^{-1}\leqslant Q_{out}\leqslant 540~\text{cm}^{3}~\text{s}^{-1}$
, a Pompe Cucchi N1 gear metering pump (with an external servo-cooling unit) with an Apollo Flow RN3/20/5 turbine flowmeter were used. At lower flow rates, a self-calibrating ISMATEC MCP-Z Process gear pump was used. With this apparatus and instrumentation, the extraction flow rate was measured to accuracies within 0.3 % for
 $Q_{out}\leqslant 540~\text{cm}^{3}~\text{s}^{-1}$
. Higher flow rates,
 $540~\text{cm}^{3}~\text{s}^{-1}\leqslant Q_{out}\leqslant 1000~\text{cm}^{3}~\text{s}^{-1}$
, were achieved using a Clark International submersible water pump and measured using a Key Instruments variable-area flow rate meter to accuracies within 2 %. Combined with the accuracy associated with the source pump supplying
 $Q_{0}$
, the extract pump and the measurement of the interface position gave an experimental uncertainty in dimensionless entrained volume flux
 $Q_{E}/Q_{0}$
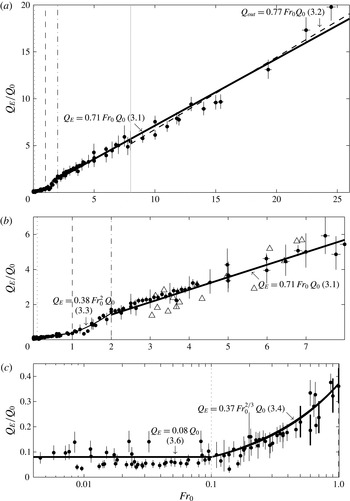
that varied between experiments from 3 % to 20 %. The uncertainty for each experimental measurement is reflected by the vertical bars in figure 2.
Variation of dimensionless volume flux entrained,
 $Q_{E}/Q_{0}$
, with
 $\mathit{Fr}_{0}$
. Our 153 experiments with distinct source conditions are marked
 $\bullet$
with vertical and horizontal bars to mark the maximum extent of experimental uncertainties. (a) Our entire dataset. (b) Our data for
 $0\leqslant \mathit{Fr}_{0}\leqslant 8.0$
with the data of Baines et al. (Reference Baines, Corriveau and Reedman1993) for
 $\mathit{Fr}_{0}\geqslant 3.0$
marked by
 $\triangle$
. (c) Our data for
 $0.004\leqslant \mathit{Fr}_{0}\leqslant 1.0$
plotted on log–linear axes. Vertical dotted, dashed and dot-dashed lines mark the boundaries between the
 $\mathit{Fr}_{0}$
bands. The best fits to our data are marked for the appropriate
 $\mathit{Fr}_{0}$
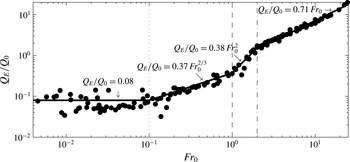
ranges. See figure 3 for a comparison of our data with the various power laws plotted on log–log axes.

Our data for the entrained volume flux (from figure 2) plotted on log–log axes.

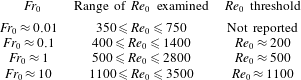
The range of source Reynolds numbers
 $\mathit{Re}_{0}$
for which bulk fountain entrainment
 $Q_{E}$
was measured herein. The
 $\mathit{Re}_{0}$
threshold values are taken from Burridge, Mistry & Hunt (Reference Burridge, Mistry and Hunt2015), who determined values of
 $\mathit{Re}_{0}$
above which fountain rise height (inherently affected by the entrainment of ambient fluid) may be regarded as independent of
 $\mathit{Re}_{0}$
. Note our measurements of
 $Q_{E}$
herein are with source conditions that always exceed the
 $\mathit{Re}_{0}$
thresholds.

The source conditions of the fountains formed were
 $0.004\leqslant \mathit{Fr}_{0}\leqslant 25$
(accurate to within 1.5 %) and with source Reynolds numbers of
 $350\leqslant \mathit{Re}_{0}=w_{0}r_{0}/{\it\nu}_{0}\leqslant 3460$
, where
 ${\it\nu}_{0}$
denotes the kinematic viscosity of the source fluid. For each value of
 $\mathit{Fr}_{0}$
, measurements of entrainment were recorded at a number of different values of
 $\mathit{Re}_{0}$
. The range of achievable
 $\mathit{Re}_{0}$
varied with
 $\mathit{Fr}_{0}$
but, by careful selection of the source conditions, we ensured that variations in entrainment with either
 $\mathit{Fr}_{0}$
or
 $\mathit{Re}_{0}$
could be determined. Table 1 indicates the
 $\mathit{Re}_{0}$
ranges examined at each decade of the source Froude number. No statistically significant correlation was observed between the rate of entrainment and the source Reynolds number over the range of
 $\{\mathit{Fr}_{0},\mathit{Re}_{0}\}$
parameter space examined. Thus, we regard our measurements of
 $Q_{E}$
as Reynolds-number-independent.
3. Results and discussion
Our measurements of entrainment are plotted in figure 2, which shows the volume flux entrained by the fountain relative to the source volume flux as a function of the source Froude number. A number of distinct trends are apparent in the data, which fall into the following bands: (I)
 $\mathit{Fr}_{0}\gtrsim 2.0$
, intermediate and forced fountains; (II)
 $1.0\lesssim \mathit{Fr}_{0}\lesssim 2.0$
, weak fountains; (III)
 $0.1\lesssim \mathit{Fr}_{0}\lesssim 1.0$
, very weak fountains; and (IV)
 $\mathit{Fr}_{0}\lesssim 0.1$
, low-
 $\mathit{Fr}_{0}$
fountains. These bands match with the existing classification for fountains (e.g. Hunt & Burridge Reference Hunt and Burridge2015) and we have adopted the existing naming convention (italicised) accordingly; the exception being that our data provide, to our knowledge, the first evidence that for
 $\mathit{Fr}_{0}\lesssim 1.0$
there is a further distinct form of fountain behaviour. We have replotted the data, figure 3, on log–log axes to further highlight the distinct trends.
3.1. Entrainment measurements
3.1.1. Intermediate and forced fountains,
 $\mathit{Fr}_{0}\gtrsim 2.0$

Figure 2(a,b) shows that the (non-dimensional) entrained volume flux varies approximately linearly with
 $\mathit{Fr}_{0}$
for intermediate and forced fountains. The best fit to our data, with a coefficient of determination
 $R^{2}=97.6\,\%$
, is
 $$\begin{eqnarray}\frac{Q_{E}}{Q_{0}}=0.71\mathit{Fr}_{0}\quad \text{for }\mathit{Fr}_{0}\gtrsim 2.0.\end{eqnarray}$$
Given that
 $\mathit{Fr}_{0}\propto M_{0}^{5/4}/B_{0}^{1/2}\,Q_{0}$
, where
 $M_{0}$
and
 $B_{0}$
denote the source fluxes of momentum and buoyancy, we note that the scaling in (3.1) suggests that for
 $\mathit{Fr}_{0}\gtrsim 2.0$
the entrained volume flux scales with the high-
 $\mathit{Fr}_{0}$
volume flux,
 $M_{0}^{5/4}/B_{0}^{1/2}\propto \mathit{Fr}_{0}Q_{0}$
– a scaling that is apparent on consideration of a source of momentum flux and buoyancy flux (Baines, Turner & Campbell Reference Baines, Turner and Campbell1990). As such, the outflow volume flux scales as
 $Q_{out}\propto M_{0}^{5/4}/B_{0}^{1/2}+Q_{0}$
, or equivalently
 $Q_{out}/Q_{0}\propto \mathit{Fr}_{0}+1$
. This highlights that the source volume flux affects the outflow fluxes for these intermediate and forced fountains but that this effect becomes diminishingly small at high
 $\mathit{Fr}_{0}$
. We also note that, for
 $\mathit{Fr}_{0}\gtrsim 8.0$
, a similar goodness of fit (
 $R^{2}=96.3\,\%$
) is achieved with
 $$\begin{eqnarray}Q_{out}=Q_{E}+Q_{0}=0.77\mathit{Fr}_{0}Q_{0}\propto \frac{M_{0}^{5/4}}{B_{0}^{1/2}}.\end{eqnarray}$$
This suggests that the source volume flux has an insignificant effect on the outflow flux of even moderately forced fountains (
 $\mathit{Fr}_{0}\approx 8$
), a result consistent with effects of the source volume flux on the rise heights of these fountains (see e.g. Hunt & Burridge Reference Hunt and Burridge2015).
3.1.2. Weak fountains,
$1.0\lesssim \mathit{Fr}_{0}\lesssim 2.0$

The best-fitting power law to our weak fountain data (figure 2 b) is
 $$\begin{eqnarray}\frac{Q_{E}}{Q_{0}}=0.38\mathit{Fr}_{0}^{2}\quad \text{for }1.0\lesssim \mathit{Fr}_{0}\lesssim 2.0.\end{eqnarray}$$
This scaling implies that the outflow volume flux is
 $Q_{out}=(0.38\mathit{Fr}_{0}^{2}+1)Q_{0}$
and that the outflow volume flux of weak fountains (for increasing
 $\mathit{Fr}_{0}$
) changes from being dominated by the source volume flux, at
 $\mathit{Fr}_{0}\approx 1$
, to being strongly dependent on the source Froude number (the dominant term scales with
 $Q_{0}\mathit{Fr}_{0}^{2}$
at
 $\mathit{Fr}_{0}\approx 2$
). This may contribute to the relatively poor fit attained (
 $R^{2}=66.3\,\%$
).
3.1.3. Very weak fountains,
$0.1\lesssim \mathit{Fr}_{0}\lesssim 1.0$

Very weak fountains have been shown to be hydraulically controlled and for their mean rise height to scale with
 $r_{0}\mathit{Fr}_{0}^{2/3}$
(Lin & Armfield Reference Lin and Armfield2000; Kaye & Hunt Reference Kaye and Hunt2006). Figure 2(c) shows that the best fit (with
 $R^{2}=87.7\,\%$
) to our entrainment data for these fountains is
 $$\begin{eqnarray}\frac{Q_{E}}{Q_{0}}=0.37\mathit{Fr}_{0}^{2/3}\quad \text{for }0.1\lesssim \mathit{Fr}_{0}\lesssim 1.0.\end{eqnarray}$$
The mean radius of a very weak fountain in the plane of the source (i.e. the radius of the fountain outflow) has been shown to be
 $r_{0}(1+0.6\,\mathit{Fr}_{0}^{2/3})$
by Lin & Armfield (Reference Lin and Armfield2000). If we assume that the surface area over which entrainment occurs scales with the product of the mean rise height and the mean radius, i.e. with
 $r_{0}^{2}\mathit{Fr}_{0}^{2/3}(1+0.6\,\mathit{Fr}_{0}^{2/3})$
, then to leading order the surface area scales as
 $r_{0}^{2}\mathit{Fr}_{0}^{2/3}$
for
 $\mathit{Fr}_{0}\lesssim 1.0$
. Defining a bulk entrainment velocity,
 $w_{E}$
, as the volume flux entrained per unit surface area then gives
 $$\begin{eqnarray}w_{E}\propto \frac{\mathit{Fr}_{0}^{2/3}Q_{0}}{r_{0}^{2}\mathit{Fr}_{0}^{2/3}}\propto w_{0}.\end{eqnarray}$$
In other words, the scaling evident in (3.4) is apparent on reasoning that entrainment occurs over a surface area proportional to the product of the fountain’s characteristic radius and height, and with an entrainment velocity that scales with the dominant velocity scale – for very weak fountains the latter has been shown to be the source velocity (Burridge & Hunt Reference Burridge and Hunt2013).
3.1.4. Low-
$\mathit{Fr}_{0}$
fountains,
$\mathit{Fr}_{0}\lesssim 0.1$


For these low-Froude-number fountains the entrainment ceases to exhibit any determinable dependence on
 $\mathit{Fr}_{0}$
, the best fit being
 $$\begin{eqnarray}\frac{Q_{E}}{Q_{0}}=0.08\pm 0.025\quad \text{for }\mathit{Fr}_{0}\lesssim 0.1.\end{eqnarray}$$
The tolerance in (3.6) reflects the standard deviation in our data. This result indicates that the outflow volume flux depends solely on
 $Q_{0}$
and is independent of
 $\mathit{Fr}_{0}$
. This finding is consistent with the deduction (Burridge & Hunt Reference Burridge and Hunt2014) that since
 $\mathit{Fr}_{0}\propto (M_{0}^{5/4}/B_{0}^{1/2})/Q_{0}$
one may regard low-
 $\mathit{Fr}_{0}$
fountains as those fountains for which the dominant volume flux within the fountain remains the source volume flux.
3.2. Entrainment by fountains and entrainment across a density interface
Finally, we reflect on the scalings that we have obtained for the volume flux entrained by turbulent fountains and those based on previous measurements of volume flux entrained across a density interface due to localised forcing by a turbulent jet or jet-like flow (e.g. Baines Reference Baines1975; Kumagai Reference Kumagai1984; Baines et al. Reference Baines, Corriveau and Reedman1993; Cardoso & Woods Reference Cardoso and Woods1993; Lin & Linden Reference Lin and Linden2005). If one considers a jet projected upwards towards a density interface from a source within a (dense) homogeneous lower layer, then the links between entrainment by a fountain and entrainment across an interface become apparent. On impinging with the interface, fluid from the jet (whether positively, negatively or neutrally buoyant in the lower layer) is typically observed to penetrate some distance into the region above before collapsing back under gravity. In other words, a fountain-like flow is established within the upper region as a consequence of the localised forcing of the interface.
A focus of the aforementioned experimental studies and of complementary phenomenological predictive models has been to parameterise the dimensionless flux of the fountain-like flow in the upper layer
 $Q_{E}/Q_{i}$
(a flux that is subsequently transferred across the interface) in terms of the Froude number at the interface
 $\mathit{Fr}_{i}$
. At moderately high Froude numbers,
 $\mathit{Fr}_{i}\gtrsim 3.0$
, Baines (Reference Baines1975), Baines et al. (Reference Baines, Corriveau and Reedman1993) and Lin & Linden (Reference Lin and Linden2005) all report values for the entrainment flux that are of similar magnitude to our results (see e.g. figure 2
b). However, at lower Froude numbers, these studies report significantly lower entrainment than we measured in our experiments (for
 $\mathit{Fr}_{i}\lesssim 1$
, the interfacial entrainment flux reported is typically between one and two orders of magnitude smaller than for the fountain in homogeneous surroundings).
Whilst no general consensus can be drawn from these earlier studies regarding the precise variation of
 $Q_{E}/Q_{i}$
with
 $\mathit{Fr}_{i}$
(as summarised in Shrinivas & Hunt Reference Shrinivas and Hunt2014), we hypothesise that differences between our measurements of fountain entrainment and the existing measurements of entrainment across density interfaces may be attributed to the energy dissipated by interfacial waves excited as the rising turbulent jet penetrates the interface – an effect absent in our experiments. The tilting of the interface as a consequence of the impinging rising jet misaligns the pressure and density fields and an unsteady baroclinic torque is induced that acts to restore the interface towards the horizontal. Consistent with our hypothesis, a simplified scaling for the energy flux transported away from the impingement region by the resulting interfacial waves indicates that the energy dissipated by these waves may be significant at low
 $\mathit{Fr}_{i}$
(appendix A).
4. Conclusions
Measurements of the bulk entrainment by turbulent fountains have been presented. Our results span source Froude numbers between 0.004 and 25. The results have been shown to agree with the volume flux scalings apparent for fountains on dimensional grounds at low and high Froude numbers (Baines et al. Reference Baines, Turner and Campbell1990; Burridge & Hunt Reference Burridge and Hunt2014), and may be summarised as follows:
 $$\begin{eqnarray}\frac{Q_{E}}{Q_{0}}=\left\{\begin{array}{@{}ll@{}}1.08\pm 0.025,\quad & \mathit{Fr}_{0}\lesssim 0.1,\\ 0.37\mathit{Fr}_{0}^{2/3},\quad & 0.1\lesssim \mathit{Fr}_{0}\lesssim 1.0,\\ 0.38\mathit{Fr}_{0}^{2},\quad & 1.0\lesssim \mathit{Fr}_{0}\lesssim 2.0,\\ 0.71\mathit{Fr}_{0},\quad & 2.0\lesssim \mathit{Fr}_{0}\lesssim 8.0,\\ 0.77\mathit{Fr}_{0}-1,\quad & \mathit{Fr}_{0}\gtrsim 8.0.\end{array}\right.\end{eqnarray}$$
From a practical perspective, quantifying entrainment by fountains (4.1) may assist in the selection of source conditions that best suit a particular application. For example, in the cooling of rooms by localised cool air supplies at floor level, entrainment by the fountains produced plays an instrumental role in the temperatures attained within the room and the rate of cooling. Given that entrainment rates may vary from being independent of the source Froude number to quadratic in
 $\mathit{Fr}_{0}$
, the selection of source conditions for these supplies may strongly influence the comfort of occupants.
Acknowledgement
The careful experiments examining low-
 $\mathit{Fr}_{0}$
fountains by Mr Z. Wang are gratefully acknowledged.
Appendix A. Simplified scalings for the energy carried by interfacial waves
A number of studies have experimentally investigated the entrainment across a density interface by a turbulent jet (e.g. Baines Reference Baines1975; Kumagai Reference Kumagai1984; Baines et al. Reference Baines, Corriveau and Reedman1993; Cardoso & Woods Reference Cardoso and Woods1993; Lin & Linden Reference Lin and Linden2005). As the turbulent jet penetrates the interface, it imparts an unsteady baroclinic torque, which is then opposed by the buoyancy force due to the change in density across the interface. The unsteady nature of this interaction can result in the dissipation of energy through the formation of interfacial waves. We now present a simple scaling for the energy flux in interfacial waves to assess how the role of these waves may vary with changes in the Froude number at the interface.
In a time-averaged sense, the jet at the interface is of circular cross-section, the radius of which we denote
 $b_{i}$
. As a simple model we consider the flux of energy carried away by interfacial waves generated around a ring of radius
 $b_{i}$
. In order to obtain a scaling for the energy flux, it may be reasonable in the region near this ring, i.e. in the region where the energy is carried away from the initiating flow, to neglect the effects of the curvature on the (radial) waves and treat them as a set of one-dimensional waves generated over a length
 $2{\rm\pi}b_{i}$
. We are not concerned with the evolution of the propagating waves, only the energy that they carry away. Following Sutherland (Reference Sutherland2010), the (specific) energy flux in the interfacial waves, generated over a length proportional to
 $b_{i}$
, scales as
 $$\begin{eqnarray}\mathscr{F}\propto c_{g}A^{2}g_{i}^{\prime }\,b_{i},\end{eqnarray}$$
where
 $c_{g}$
is the wave group velocity,
 $A$
the wave amplitude and
 $g_{i}^{\prime }$
the buoyancy difference across the interface. The flux of (specific) kinetic energy within the initiating jet at the interface scales as
 $$\begin{eqnarray}K_{i}\propto b_{i}^{2}w_{i}^{3},\end{eqnarray}$$
where
 $w_{i}$
is the characteristic velocity of the jet at the interface. Thus the non-dimensional flux of energy in the waves is
 $$\begin{eqnarray}\widehat{\mathscr{F}}=\frac{\mathscr{F}}{K_{i}}\propto \frac{c_{g}g_{i}^{\prime }A^{2}}{w_{i}^{3}b_{i}}.\end{eqnarray}$$
The amplitude of the waves must be determined by a length scale associated with the jet at the interface. We expect this length scale to be set by the fluctuations in the width of the turbulent jet at the interface. These fluctuations in width are driven by eddies within the jet, the scale of which is set by the width of the jet (at least for negatively buoyant jets, Burridge & Hunt Reference Burridge and Hunt2013). As such, it is reasonable to assume that
 $A\propto b_{i}$
. The group velocity in shallow layers scales as
 $c_{g}\propto \sqrt{g_{i}^{\prime }H}$
(Sutherland Reference Sutherland2010), where
 $H$
is the layer depth. The radius of the initiating jet, whether jet-like or plume-like, scales as
 $b_{i}\propto z\sim H$
and hence we take
 $c_{g}\propto \sqrt{g_{i}^{\prime }b_{i}}$
. Thus a scaling for the energy flux for interfacial waves in shallow layers is
 $$\begin{eqnarray}\widehat{\mathscr{F}_{s}}\propto \frac{g_{i}^{\prime 3/2}b_{i}^{3/2}}{w_{i}^{3}}=\mathit{Fr}_{i}^{-3},\end{eqnarray}$$
where
 $\mathit{Fr}_{i}=w_{i}/\sqrt{g_{i}^{\prime }b_{i}}$
. The group velocity in deep layers scales as
 $c_{g}\propto \sqrt{g_{i}^{\prime }/k}$
(Sutherland Reference Sutherland2010), where
 $k$
is the interfacial wavenumber. Assuming that the interfacial wavenumber is set by the buoyancy and velocity at the interface (i.e.
 $k\propto g^{\prime }/w_{i}^{2}$
) or equivalently reasoning that the group velocity is set by the velocity scale of the initiating jet, gives
 $c_{g}\propto w_{i}$
. Thus, a scaling for the energy flux for interfacial waves in deep layers is
 $$\begin{eqnarray}\widehat{\mathscr{F}_{d}}\propto \frac{g_{i}^{\prime }b_{i}}{w_{i}^{2}}=\mathit{Fr}_{i}^{-2}.\end{eqnarray}$$
As one would expect, the relationships (A 4) and (A 5) both indicate that at high
 $\mathit{Fr}_{i}$
the portion of kinetic energy in the penetrating jet that is carried away by interfacial waves is diminishingly small. This is further supported by the broad agreement, at moderately high
 $\mathit{Fr}_{i}$
, between our results and those obtained utilising a penetrating jet; for example, the data for entrainment obtained by Baines et al. (Reference Baines, Corriveau and Reedman1993) for
 $\mathit{Fr}_{i}\gtrsim 3$
(figure 2
b). However, at
 $\mathit{Fr}_{0}\lesssim 1$
, (A 4) and (A 5) indicate that the portion of the kinetic energy flux carried away by the waves becomes more significant. At these Froude numbers, experiments with a penetrating jet report entrainment rates that are significantly lower than those measured in our experiments. This is consistent with the fountain-like flow established by a penetrating jet having a kinetic energy which is, at low
 $\mathit{Fr}_{i}$
, significantly depleted by the excitement of interfacial waves. Moreover, studies reporting data for
 $\mathit{Fr}_{i}=O(10^{-1})$
typically determine that the entrained volume flux increases strongly with the interfacial Froude number (
 $Q_{E}/Q_{i}\propto \mathit{Fr}_{i}^{2}$
or
 $Q_{E}/Q_{i}\propto \mathit{Fr}_{i}^{3}$
(see Baines Reference Baines1975; Kumagai Reference Kumagai1984; Baines et al.
Reference Baines, Corriveau and Reedman1993; Cardoso & Woods Reference Cardoso and Woods1993)). Such findings suggest that, at these low Froude numbers, the energy available for mixing within the fountain-like flow increases rapidly with increasing
 $\mathit{Fr}_{i}$
; this is consistent with the notion that the dissipation by interfacial waves decreases (A 4)–(A 5) rapidly. We note that since the portion of the kinetic energy in the jet that is dissipated by interfacial waves has an upper bound of unity, (A 4)–(A 5) require that the constants of proportionality are suitably small. Furthermore, in the limit that the inertia in the jet is diminishingly small compared to the buoyancy due to the change in density across the interface, i.e.
 $\mathit{Fr}_{i}\rightarrow 0$
, the jet will fail to penetrate the interface; in this limit the analysis leading to (A 4)–(A 5) is clearly no longer valid.