
I. INTRODUCTION
Combining the advantages of Si3N4 and BN ceramics, Si–B–N ceramics exhibit low density, high thermal stability, high mechanical performance, good oxidation, and a low dielectric constant. Reference Lu1,Reference Liao, Xue and Zhang2 Si–B–N ceramics are promising electromagnetic wave transparent materials for electromagnetic windows or radomes on high-speed aircrafts and supersonic near space vehicles which endure high temperatures, thermal shock, rain erosion and particle impingement, and which also require a stable wave transparent capability at the same time. Si–B–N ceramics can make ceramic fibers, Reference Baldus, Passing and Eiling3–Reference Tang, Wang, Li, Xie, Wang, Li and Wang8 films, Reference Maeda and Makino9–Reference Essafti, Gómez-Aleixandre and Albella14 interphase coatings, Reference Stöckel, Marx and Goedel15–Reference Li20 and ceramic matrices. Reference Li, Zhang, Cao, Wang, Li and Chen21–Reference Jiang, Zhang, Cao, Wang, Hu and Qi24
Up to now, main fabrication methods of Si–B–N ceramics are polymer-derived ceramic (PDC) routes Reference Peng, Han, Zhao and Yu5,Reference Li, Zhang, Cao, Wang, Li and Chen21–Reference Heinemann, Assenmacher, Mader, Kroschel and Jansen28 and chemical vapor deposition (CVD). Reference Moore, Sayir, Fanner and Morscher17–Reference Li, Cheng, Liu and Ye19 PDC routes have been widely used to make fine Si–B–N fibers and Si–B–N ceramic matrices for the designable precursors. On the other hand, low-pressure chemical vapor deposition or infiltration process (LPCVD/CVI), which yields smooth, continuous, and dense ceramics at a lower temperature with a high purity and well-controlled composition and microstructure, has been widely used in the fabrication of Si–B–N films, interphase coatings, and matrices in ceramic fiber-reinforced ceramic composites. Reference Naslain29–Reference Zuo, Zhang, Liu, Li and Cheng32
The microstructure and phase composition of Si–B–N ceramics fabricated by CVD vary with vapor precursors and deposition parameters. Hirai et al. Reference Hirai, Goto, Sakai, Davis, Palmour and Porter33 illustrated that the Si–B–N film prepared by LPCVD from SiCl4–NH3–H2–B2H6 gas sources at deposition temperatures ranging from 1100 to 1300 °C was composed of amorphous Si3N4 and turbostratic BN. Besmann Reference Besmann34 performed a thermodynamic analysis of the CVD system of H2SiCI2–BCl3–NH3 and indicated that the solid phase assemblage Si3N4 + BN was stable over a large region. Essafti Reference Essafti, Gómez-Aleixandre, Fierro, Fernández and Albella11,Reference Essafti, Gómez-Aleixandre and Albella14 fabricated Si–B–N films by LPCVD using SiH4–B2H6–NH3 and focused on the effects of temperature and gas composition on the deposition process and the film’s properties. A mixture of turbostratic boron nitride and silicon nitride was deposited at 1000 °C for a high NH3 flow rate (SiH4:B2H6:NH3, 10:25:500). By controlling the [SiH4]/[B2H6] flow ratio, the film hardness increased with the increase of Si content in the film. Li et al. Reference Li, Cheng, Liu and Ye19 studied the deposition phase diagrams of SiCl4–NH3–BCl3–H2–Ar and drew the conclusion that the optimum condition for the deposition of Si–B–N coatings was temperatures ranging from 700 to 900 °C under a low total pressure and that N–Si and N–B were the main chemical bonds of the coating. However, only parts of reactant contents were considered in the thermodynamic calculations. It is necessary to get a complete phase diagram to sufficiently understand the distribution of products under different equilibrium conditions and give sufficient guidance for experiments. Liu et al. Reference Essafti, Gómez-Aleixandre and Albella14,Reference Liu, Chai, Li, Ye, Liu and Cheng16 researched the effect of deposition temperature on the kinetics of Si–B–N coating deposited from the SiCl4–BCl3–NH3–H2–Ar mixture and found that Si–B–N coatings deposited from 700 to 1200 °C were amorphous and that the deposition mechanism referred to two parallel reaction systems of BCl3 + NH3 and SiCl4 + NH3. Generally, all of Si–B–N ceramics deposited by CVD were amorphous. It is essential to evaluate the thermal stability of amorphous Si–B–N ceramics fabricated by CVD for their applications at elevated temperatures. Through theoretical computations and reactions analyzed by the second-law and third-law methods, Meloni et al. Reference Meloni, Viswanathan and Gingerich35 reported that the BNSi molecule was more stable than Si2N and B2N by 67 and 10 kJ/mol, respectively. However, there is no report of experimental study on the microstructure evolution and phase transformation of amorphous Si–B–N ceramics at elevated temperatures in the literature.
In our work, ternary phase diagram of the SiCl4–NH3–BCl3–H2–Ar system at different temperatures and deposition efficiencies of Si3N4 and BN as functions of the temperature, pressure, and dilution ratio of H2 were calculated to determine the optimum deposition condition of Si–B–N ceramic coatings. Microstructure evolution and phase transformation of as-prepared Si–B–N ceramic coatings with different annealing temperatures were investigated to evaluate the thermal stability.
II. THERMODYNAMIC CALCULATIONS AND EXPERIMENTAL PROCEDURES
A. Thermodynamic calculations
Thermodynamic studies on LPCVD of SiCl4–NH3–BCl3–H2–Ar system can provide a fundamental understanding of the products under certain equilibrium conditions. During the LPCVD process for Si–B–N ceramics, inert gas Ar acted as a protection and dilution gas. Based on the Gibbs free energy minimization principle, equilibrium phases were calculated under given processing conditions which were determined by temperature, pressure, and reactant concentration by Factsage programs (Thermofact/CRCT and GTT-Technologies, Montreal, Canada and Herzogenrath, Germany). The free energy (G) of this system, containing gaseous and solid species could be described by Eq. (2.1) Reference Pattanaik and Sarin36
 $$\min G = \min \left\{ {\sum\limits_{i = 1}^s {n_i^{{\rm{cond}}}} \Delta G_{m,i}^\theta \left( {{\rm{cond}}.} \right) + \sum\limits_{i = s + 1}^N {{n_i}\left[ {\Delta G_{m,i}^\theta \left( {{\rm{gas}}} \right) + RT\ln p + RT\ln {{{n_i}} \over {\sum\limits_{j = s + 1}^N {{n_j}} }}} \right]} } \right\}\quad ,$$
where s and m are the total number of the condensed phases and gaseous species, respectively; N is the total number of the species in the system (consequently N = m + s); p is the total pressure; n
i
is the mole of the ith gaseous species; and
 $n_i^{{\rm{cond}}}$
is the mole of the ith condensed-phase species satisfying
 $$\sum\limits_{i = 1}^N {{a_{ij}}{n_i}} = {B_j}\left( {j = 1,\;2, \ldots ,M} \right)\quad ,$$
where a ij is the atomicity of element j in the species i; B j is the total atomicity of element j; and M is the total number of different elements.
In Eq. (2.1), the standard molar Gibbs free energy either for the condensed-phase
 $\Delta G_m^\theta$
(cond.) or for gaseous species
 $\Delta G_m^\theta$
(gas) at any temperature T is defined as:
 $$\Delta G_m^\theta \left( T \right) = \Delta H_m^\theta \left( T \right) - T \cdot \Delta S_m^\theta \left( T \right)\quad ,$$
in which,
 $\Delta H_m^\theta \left( T \right) = {\Delta _{\rm{f}}}H_m^\theta \left( {298.15\;{\rm{K}}} \right) + \int_{298.15}^T {{C_{p,m}}{\rm{d}}T}$
and
 $\Delta S_m^\theta \left( T \right) = S_m^\theta \left( {298.15\;{\rm{K}}} \right) + \int_{298.15}^T {{{{C_{p,m}}} \over T}{\rm{d}}T}$
. The dilution ratio of H2 is defined as d(H2) = n(H2)/[n(SiCl4) + n(BCl3) + n(NH3)]. Ternary phase diagrams from 800 to 1200 °C and the theoretical deposition efficiency of BN and Si3N4 with p from 0.001 to 1 atm and d(H2) from 2 to 20 were calculated. The required data of related species were from the database of the Factsage program.
B. Experimental procedures
Carbon fiber cloth (woven with T300 carbon fibers from Toray Co., Tokyo, Japan) was used as a substrate to deposit Si–B–N coatings from SiCl4 (purity 99.99 wt%), BCl3 (purity 99.99 wt%), NH3 (purity 99.99 wt%), H2 (purity 99.99 wt%), and Ar (purity 99.99 wt%). Detailed deposition parameters were listed in Table I, with d(H2) = 2. SiCl4 was vaporized in an oil bath at 30 °C by bubbling it with the carrier gas of H2 and then supplied into the deposition chamber together with BCl3 and NH3. The specimens were put into the reactor to deposit the Si–B–N ceramic coating for 2 times, 7 h for each time. The deposited Si–B–N coatings were heattreated at temperatures from 1200 to 1800 °C for 2 h under an N2 atmosphere of 1 atm.
Deposition parameters of Si–B–N coating with SiCl4–BCl3–NH3–H2–Ar system via (LPCVD).

The surface and cross-section morphologies of Si–B–N ceramic coatings were observed by scanning electron microscopy (SEM; S-4700, Hitachi, Tokyo, Japan). The elemental composition was qualitatively analyzed by Energy dispersive spectroscopy (EDS; Genesis XM2, EDAX, Mahwah, New Jersey) attached to SEM. The phase compositions were examined by X-ray diffraction (XRD; D8-Advance, Bruker, Karlsruhe Germany) with Cu Kα radiation. X-ray photoelectron spectroscopy (XPS; K-Alpha, Thermo Scientific, New York, NY) measurements were carried out to determine the chemical bonding states and elemental composition of the Si–B–N ceramic coatings.
III. RESULTS AND DISCUSSION
The possible solid phases of SiCl4–NH3–BCl3–H2–Ar system under varied amounts of reactant gases, temperatures, and pressures have been calculated by Li. Reference Li, Cheng, Liu and Ye19 700–900 °C and low pressure was considered as the best deposition condition to prepare Si–B–N ceramic coatings through area change analysis of Si3N4 + BN phase regions. A more detailed phase diagram could be illustrated with the ternary phase diagram. Moreover, the theoretical deposition efficiency can be determined by the equilibrium calculations to optimize the deposition condition.
A. Thermodynamic study of SiCl4–NH3–BCl3–H2–Ar system
Figure 1 illustrates the ternary deposition phase diagrams of the SiCl4–BCl3–NH3–H2–Ar system at 800 °C, 1000 °C, and 1200 °C, respectively, with p = 1 kPa and d(H2) = 5. Succeeding the experimental condition is located at ‘Exp’ point (SiCl4:BCl3:NH3 = 0.3:0.1:0.6) labeled in Fig. 1. There are 7 kinds of condensed species at 800 °C, including BN, SiB3, SiB6, SiB14, Si, B, and Si3N4, which are consistent with Besmann’s results. Reference Besmann34
Deposition phase diagram from SiCl4–BCl3–NH3–H2–Ar system at different temperatures with p = 1 kPa, d(H2) = 5. (a) 800 °C, (b) 1000 °C, and (c) 1200 °C; ‘Exp’ point is succeeding the experiment condition point.

BN and Si3N4 phases are the target products. The BN phase existed in all scopes of calculated parameters. However, Si3N4 only existed at excess of NH3. The reason is that the chemical reaction, which produces BN, happened easily than the reaction that produces Si3N4 in an SiCl4–NH3–BCl3–H2–Ar system. BN formed easily and was stable in this system, becoming the main solid phase. The overall reactions producing Si3N4 and BN are as follows:
 $$3{\rm{SiC}}{{\rm{l}}_4} + 4{\rm{N}}{{\rm{H}}_3} = {\rm{S}}{{\rm{i}}_3}{{\rm{N}}_4}\left( {\rm{s}} \right) + 12{\rm{HCl}}\quad .$$
 $${\rm{BC}}{{\rm{l}}_3} + {\rm{N}}{{\rm{H}}_3} = {\rm{BN}}\left( {\rm{s}} \right) + 3{\rm{HCl}}\quad .$$
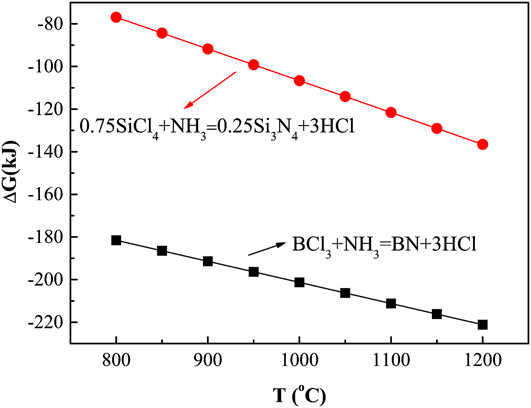
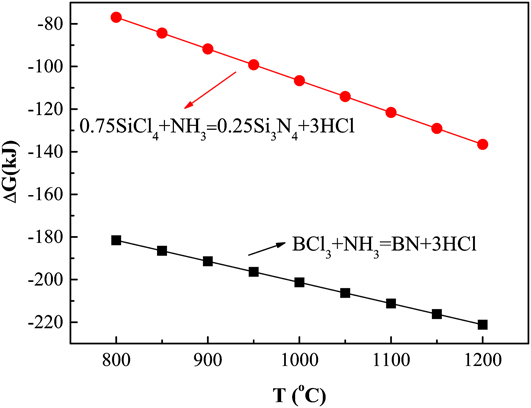
Figure 2 shows the variation of the Gibbs energy (ΔG) of these two reactions with increasing the temperature from 800 to 1200 °C. The ΔG of reaction (3.2) is much lower than that of reaction (3.1), making reaction (3.2) the main reaction. Moreover, the area of the BN + Si3N4 phase region decreased with the increase of temperature because the area of the Si3N4 phase region greatly decreased when the temperature increased above 1000 °C. Thus, a temperature below 1000 °C favors codeposition of BN and Si3N4 and consequently saves process costs.
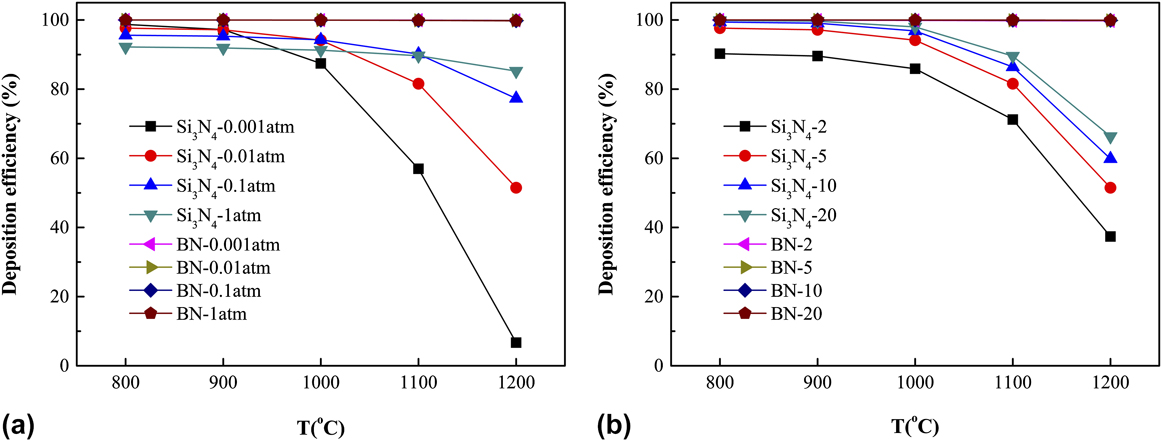
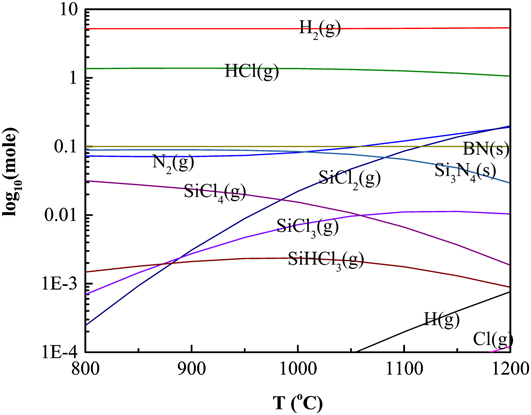
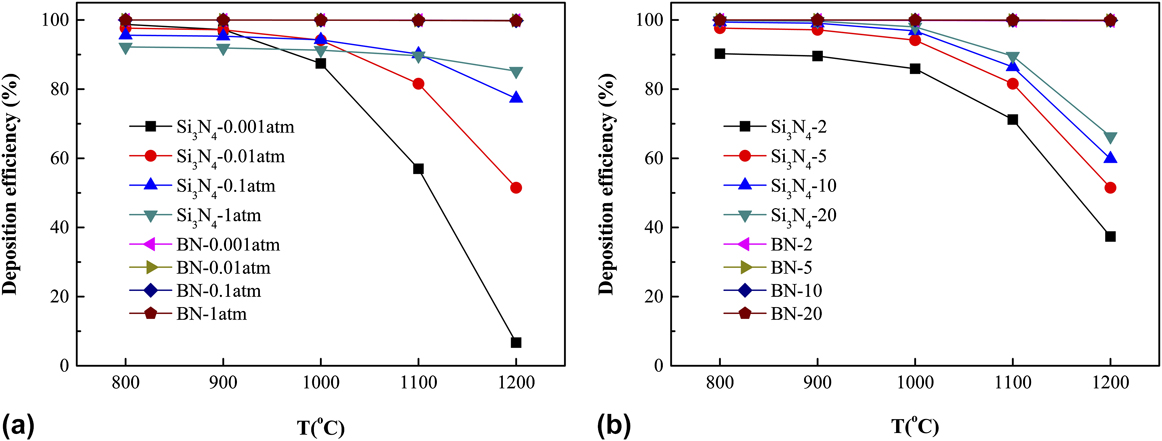
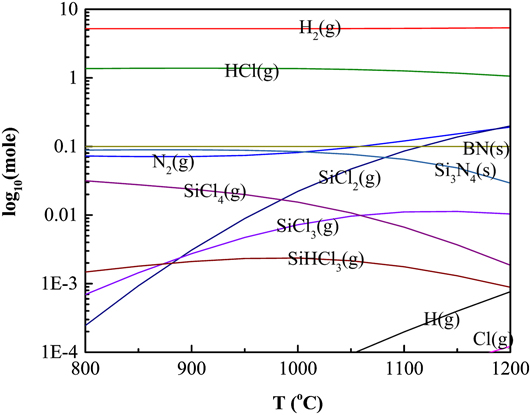
Theoretical deposition efficiencies of BN and Si3N4 (Fig. 3) were carefully analyzed as functions of temperature, pressure, and d(H2) with a certain reactant gas composition labeled as ‘Exp’ in Fig. 1. Theoretical CVD efficiency is defined as the ratio between the equilibrium moles of BN and Si3N4 predicted to deposit and the gram atoms of B or Si (multiplied by 3) assumed in the reactant gas, respectively. Reference Besmann34 The generally greater theoretical CVD efficiency of BN reflects the higher stability of BN than that of Si3N4 with respect to the gaseous species. The deposition efficiency of Si3N4 declined as the temperature increased (Fig. 3), resulting from the generation of increasing equilibrium partial pressures of SiCl x (x < 4) species (Fig. 4). Therefore, temperatures below 1000 °C are beneficial for depositing Si3N4.
Theoretical deposition efficiencies of Si3N4 and BN as a function of temperature for (a) p = 0.001, 0.01, 0.1, 1 atm and (b) dilution ratio of H2 and d(H2) = 2, 5, 10, and 20.
Equilibrium products of ‘Exp’ point (SiCl4:BCl3:NH3 = 0.3:0.1:0.6 mol) at different temperatures, d(H2) = 5, p = 1 kPa.
Theoretical deposition efficiency of Si3N4 increases as the total pressure increases at temperatures above 1000 °C and decreases as the total pressure increases [Fig. 3(a)] at temperatures below 1000 °C. The determining equilibrium reaction at higher temperatures involves the dominant gaseous species such as SiCl2, H2, and N2. The following reaction occurs:
 $$3{\rm{SiC}}{{\rm{l}}_2} + 2{{\rm{N}}_2} + 3{{\rm{H}}_2} = {\rm{S}}{{\rm{i}}_3}{{\rm{N}}_4}\left( {\rm{s}} \right) + 6{\rm{HCl}}\quad ,$$
where it is a volume contraction process, which is driven to the right by increasing the total pressure. However, the predominant silicon-containing gaseous species at lower temperatures become SiCl4 (Fig. 4).
 $$3{\rm{SiC}}{{\rm{l}}_4} + 2{{\rm{N}}_2} + 6{{\rm{H}}_2} = {\rm{S}}{{\rm{i}}_3}{{\rm{N}}_4}\left( {\rm{s}} \right) + 12{\rm{HCl}}\quad ,$$
where it is a volume expansion process, which would be forced to the left by increasing the total pressure. Reference Besmann34 Thus, the low pressure is beneficial for the codeposition of BN + Si3N4 at temperatures below 1000 °C.
The theoretical deposition efficiency of Si3N4 increases when d(H2) increases [Fig. 3(b)], which can be explained from reactions (3.3) and (3.4). Larger values of d(H2) drive these reaction equations to the right, yielding more products. And below 1000 °C, the influence of d(H2) on the deposition efficiency of Si3N4 was not obvious. In contrast, the theoretical deposition efficiency of BN is near 100% over almost all conditions due to its stability with respect to the boron-containing species.
From the above thermodynamic analysis, we may conclude that 800 °C and low pressure are the optimum deposition conditions. Meanwhile, it seems that the dilution ratio of H2 has little influence on the codeposition of BN + Si3N4 at 800 °C. Moreover, low temperature and low pressure are beneficial to maintain the preform porosity open in the CVI process, resulting in a good infiltrating uniformity. Reference Naslain29
B. Experimental research of Si–B–N ceramic coating
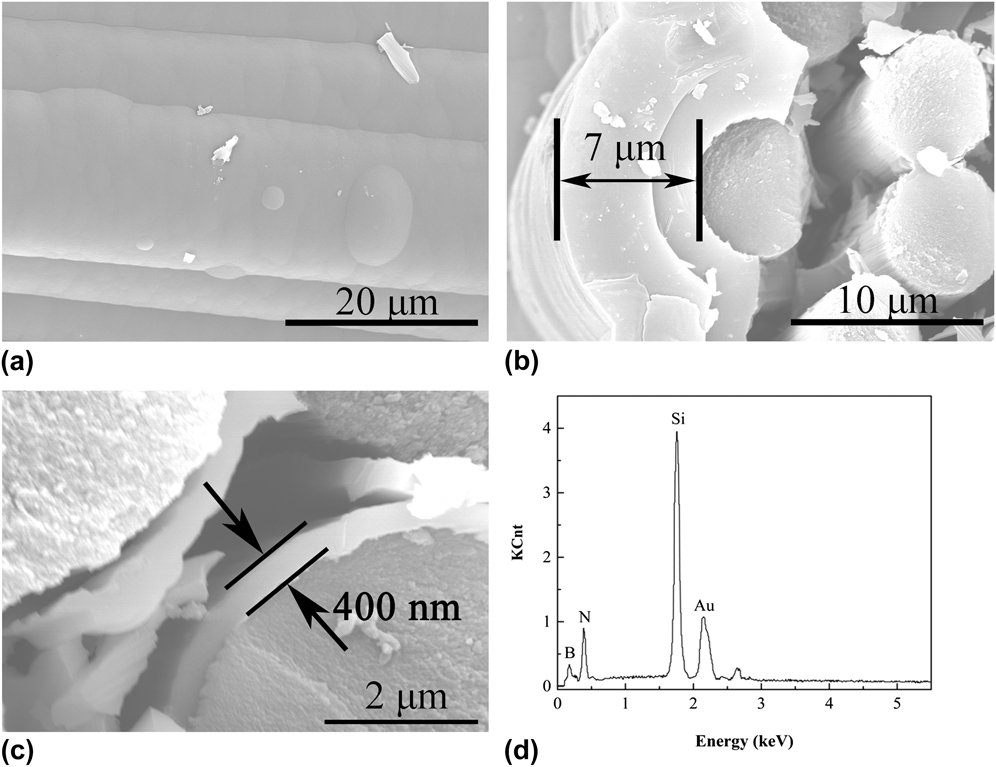
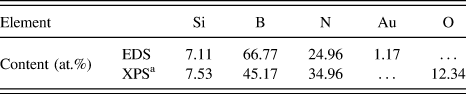
According to the above analysis, Si–B–N ceramic coating was deposited on carbon fiber cloth at 800 °C by LPCVD with p = 1 kPa and d(H2) = 2 from the SiCl4–NH3–BCl3–H2–Ar gas precursor. The surface and cross-section morphologies of the Si–B–N coating were shown in Figs. 5(a)–5(c). Carbon fibers were covered by the deposits after the deposition process. Being smooth, continuous, and dense, the surface of the Si–B–N ceramic coating showed cauliflower-like morphologies, which were typical surface morphologies of amorphous ceramics made by LPCVD. Reference Liu, Chai, Li, Ye, Liu and Cheng16 Cross-section morphologies of CVD Si–B–N coated carbon cloth showed that the thickness of the Si–B–N coating on the carbon cloth surface was about 7 μm, and the Si–B–N coating thickness of the inner carbon cloth was about 400 nm. The thickness gradient through the cloth thickness was obvious. The infiltrated depth and uniformity depended on reaction rate, pore size, and diffusion rate of reactants in the fiber preforms, which were analyzed by Liu et al. Reference Liu, Chai, Li, Ye, Liu and Cheng16 The coating boundary between the 1st and 2nd deposition can be observed clearly due to the surface passivation during temperature fall and rise periods. Thickness of coating deposited on the Si–B–N ceramic substrate during the 2nd deposition is thicker than that of the 1st deposition on the carbon cloth substrate, which illustrates that deposition rates of the Si–B–N ceramic coating depend on the property of the substrate. The energy-dispersive X-ray spectroscopy (EDS) patterns [Fig. 5(d)] showed that the as-prepared Si–B–N ceramic coating contains mainly B, N, and Si elements, and the elemental contents were listed in Table II, in which Au was the signal introduced from aided gold spraying. It seems that Si–B–N ternary phase ceramics were deposited with a high purity.
Scanning electronic microscopy photographs of Si–B–N ceramic coating deposited on carbon fiber cloth. (a) Surface morphology, (b) cross-section morphology at carbon cloth surface, (c) cross-section morphology inner carbon cloth, and (d) energy dispersive spectroscopy pattern of Si–B–N ceramic coating.

Elemental content of Si–B–N coating determined by EDS and XPS.

a XPS analysis with Ar+ ion etching 120 s.
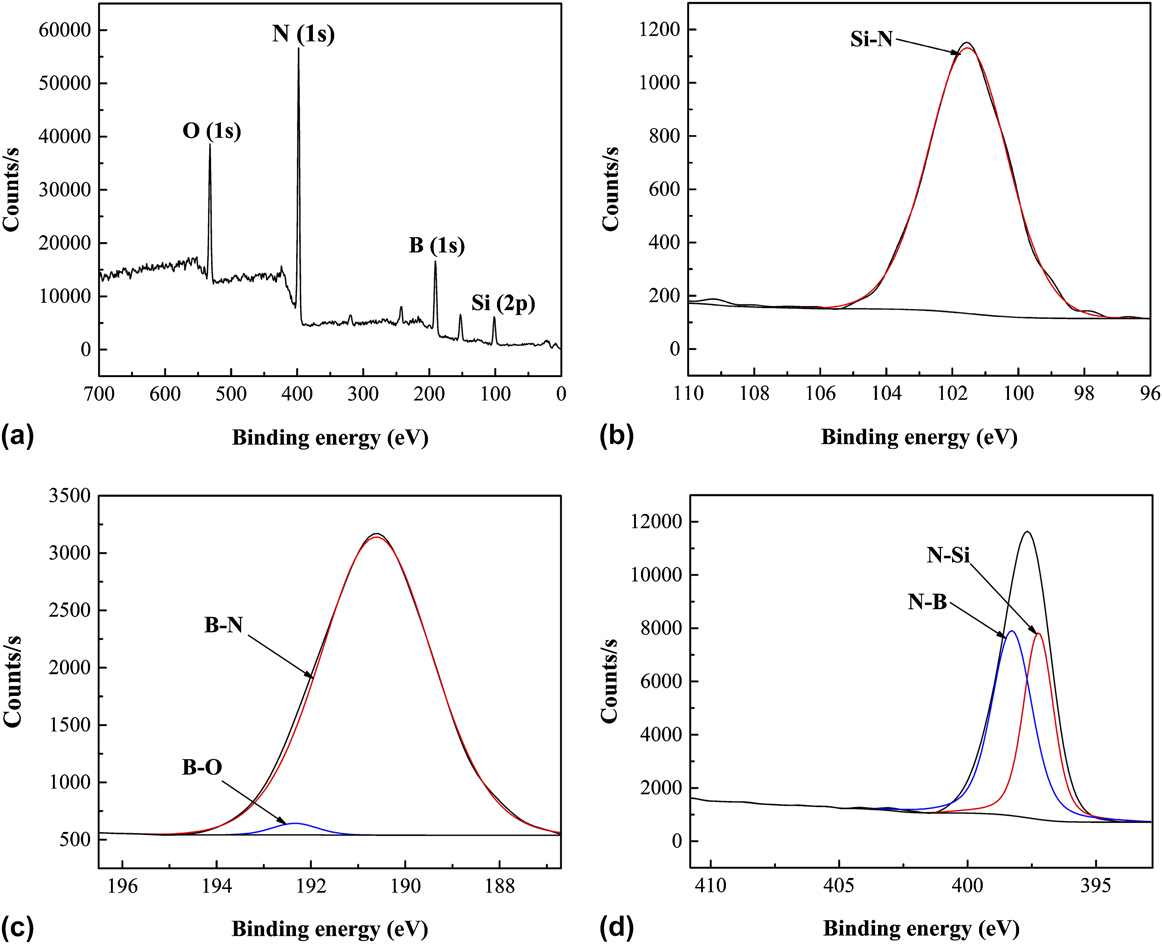
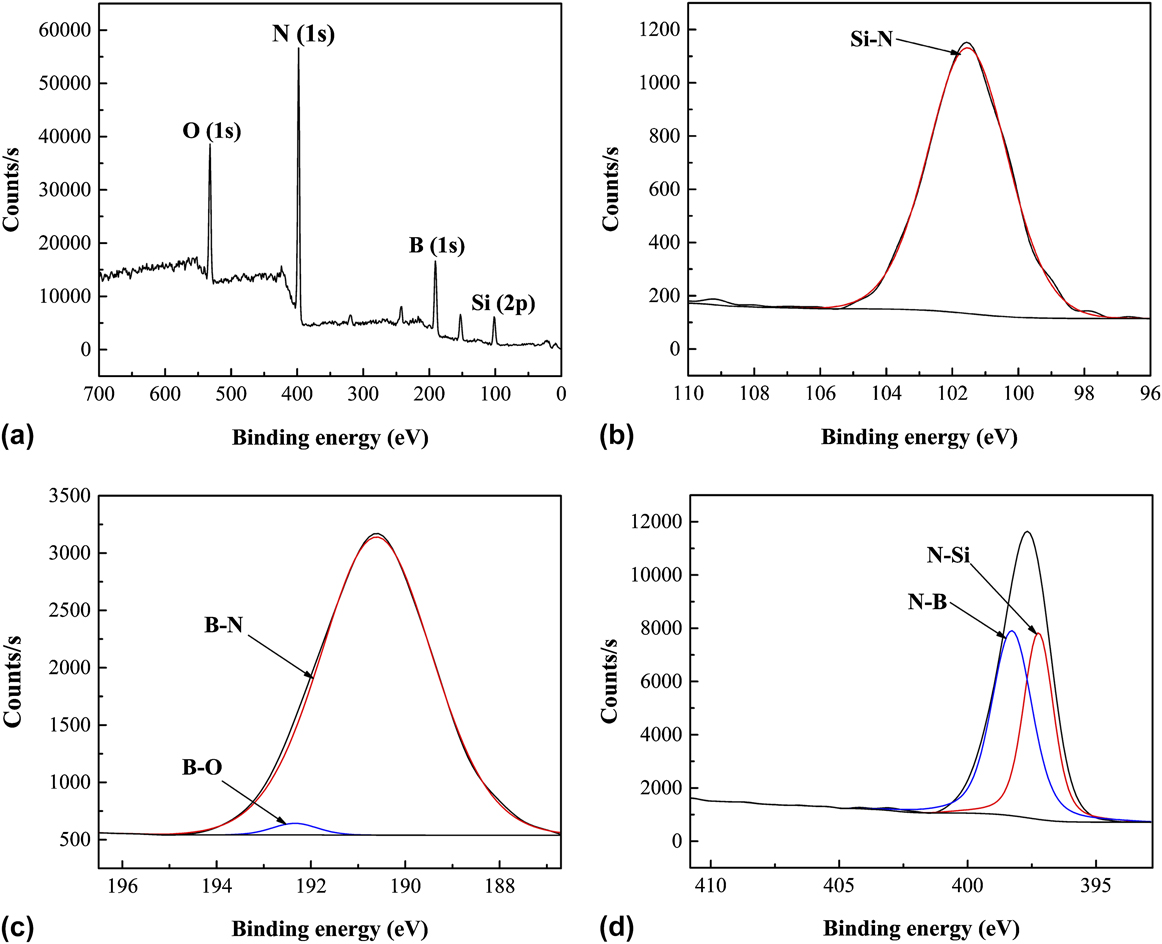
Detailed analysis such as the chemical bonding state of the Si–B–N coating was studied by X-ray photoelectron spectroscopy (XPS). XPS is a surface-sensitive quantitative spectroscopic technique that offers direct information about the elemental composition, chemical state, electronic state, and the bonding type of the atoms in solid phases. XPS of the as-prepared Si–B–N coating was shown in Fig. 6. Elemental composition determined by XPS was listed in Table II. As can be seen, the coating was composed of Si, B, N, and O elements, while O probably came from air absorption since amorphous BN in the coating easily reacted with oxygen when exposed to air and is susceptible to moisture. It was consistent with the EDS analysis. The Si content was higher than the Si–B–N coating deposited at 800 °C by Liu et al. Reference Liu, Chai, Li, Ye, Liu and Cheng16 due to the higher flow rate ratio of SiCl4/BCl3. By deconvolution of the XPS spectra, chemical bonds in the Si–B–N ceramic coatings were shown in Figs. 6(b)–6(d) with respect to Si2p , B1s , and N1s core levers. Bond types and the binding energy (E B) of the Si–B–N ceramic coating were shown in Table III. The spectrum from the Si2p core lever consisted of XPS signals peaking at 101.53 eV, which suggested the generation of an Si–N bond. Reference Ingo, Zacchetti, Dellasala and Coluzza37–Reference Senemaud, Drisskhodja, Gheorghiu, Harel, Dufour and Roulet40 The spectrum from B1s core lever consisted of XPS signals peaking at an E B of 190.61 and 192.34 eV, which were possibly due to the generation of B–N Reference Polo, Martínez, Esteve and Andújar41–Reference Gouin, Grange, Bois, Lharidon and Laurent43 and B–O Reference Brainard and Wheeler44,Reference Burke, Brown, Bowling, Glaub, Kapsch, Love, Whitaker and Moddeman45 bonds. The B–O bond was attributed to the incorporation of O2 impurities from air. The spectrum from the N1s core lever could be divided into two separate peaks located at an E B of 398.27 and 397.24 eV, which were possibly due to generation of N–B Reference Liu, Chai, Li, Ye, Liu and Cheng16,Reference Polo, Martínez, Esteve and Andújar41 and N–Si Reference Liu, Chai, Li, Ye, Liu and Cheng16,Reference Xue, Yin, Ye, Zhang, Cheng and Bessman38 bonds, respectively. According to Fig. 6(d), the amount of N–B was a little larger than that of N–Si. The dominance of N–B bonds verified the thermodynamic calculations described above. The amount ratio of N–Si bonds over N–B bonds of this work is much higher than that of Si–B–N coatings deposited by Liu et al. Reference Liu, Chai, Li, Ye, Liu and Cheng16 Si–B–N ceramic coatings were successfully fabricated by LPCVD.
(XPS) spectra of the CVD Si–B–N ceramic: (a) Survey spectrum, (b) deconvolution of the Si2p peak, (c) deconvolution of the B1s peak, and (d) deconvolution of the N1s peak.
Binding energy (E B) of Si–B–N ceramic coatings.

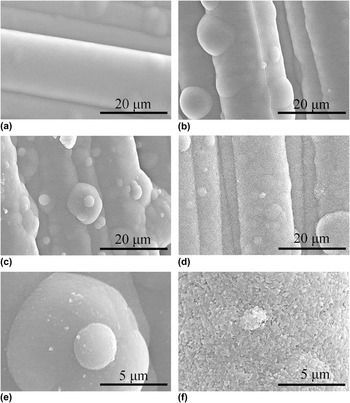
The surface of as-prepared Si–B–N ceramic coatings exhibited a typical amorphous morphology, which will be further verified by the XRD analysis in the following part of the article. It is essential to further illustrate performances of amorphous nitride ceramics at elevated temperatures for high-temperature applications. Thus, as-prepared Si–B–N ceramic coatings in our work were annealed at temperatures from 1200 to 1800 °C for 2 h in N2 to study the phase evolution. Surface morphologies of Si–B–N ceramic coatings on a carbon fiber cloth heat treated from 1200 to 1800 °C were shown in Fig. 7. No obvious change was observed on the surface below 1600 °C [Figs. 7(a–b)]. As the temperature increased, micro lighter particles emerged uniformly in the amorphous Si–B–N ceramic matrix [Fig. 7(c)] after annealing at 1600 °C. It can be clearly seen in the higher resolution photograph of Fig. 7(e), which might be attributed to the crystallization of ceramics, and this will be proved by the following XRD analysis. When heat treated at 1800 °C for 2 h, surface morphology of the Si–B–N coating underwent a drastic change, which was full of plate-like particles [Fig. 7(d)]. A large quantity of micro pores appeared uniformly in the coating, which could be observed in the higher resolution photograph in Fig. 7(f). It indicates that some reactions generating gas occurred, which will be further verified by the following analysis.
Surface morphology of Si–B–N the ceramic coating on carbon fiber cloth after heat treatment at different temperatures for 2 h (a) 1200 °C, (b) 1400 °C, (c) 1600 °C, and (d) 1800 °C. High resolution graph of Si–B–N ceramic coatings heat treated at (e) 1600 °C and (f) 1800 °C.

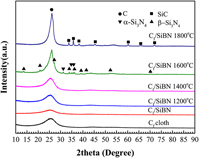
Phase transformation of the Si–B–N ceramic coating heat treated from 1200 to 1800 °C was studied by XRD (Fig. 8). The spectra of as-prepared Si–B–N ceramics were the same with that of the carbon cloth substrate which only consists of carbon peaks, indicating the amorphous state of as-received Si–B–N ceramics. When the temperature increased, the intensity of carbon peaks increased and the as-prepared Si–B–N coating kept amorphous below 1600 °C. When annealed at 1600 °C, peaks of α-Si3N4 and β-Si3N4 emerged, which indicated that the Si–N bonds in the amorphous Si–B–N matrix partly crystallized. According to Park’s research on changes in the crystalline phases and microstructure of the amorphous Si–C–N powder during sintering, α-Si3N4 was formed initially from the amorphous Si–C–N by 1530 °C and then was transformed to β-Si3N4 at 1600 °C. Reference Park, Komura and Yamakawa46 The same transformation may occur in amorphous Si–B–N ceramics when annealed at elevated temperatures. At 1600 °C, α-Si3N4 formed and then was transformed to β-Si3N4. It has been reported that amorphous Si3N4 ceramic coatings deposited on nonoxide substrates from the SiCl4–NH3–H2–Ar system at 800 °C transformed into α-Si3N4 after annealing above 1400 °C. Reference Guifang47 Thus, incorporation of boron atoms into amorphous Si3N4 inhibited the crystallization of Si3N4. The probable reason for this maybe the amorphous Si–B–N phase at the grain boundaries which retards the growth of crystalline Si3N4. Although crystalline BN is thermodynamically stable at experimental temperatures, peaks of crystalline BN were not observed by the XRD analysis when the amorphous Si–B–N ceramics were annealed from 1200 to 1800 °C. The same phenomenon was also observed in the crystallization behavior of amorphous borosilicon nitride (Si3B3N7) and borosilicon carbonitride (SiBN3C) by Baldus et al. Reference Baldus and Passing27 and in the crystallization behavior of polymer-derived Si–B–C–N ceramics by Cai et al. Reference Cai, Zimmermann, Prinz and Aldinger48 This is different from the crystallization behavior of amorphous BN ceramic coatings deposited from the BCl3–NH3–H2–Ar system, Reference Cheng, Yin, Liu, Li, Cheng and Zhang49 in which turbostratic BN ceramics transformed into well-crystallized hexagonal boron nitride (h-BN) after heat treated above 1300 °C. Crystalline BN was hardly formed in the amorphous Si–B–N ceramics by heat treatment. Therefore, thermal stability of amorphous Si–B–N ceramics deposited from SiCl4–NH3–BCl3–H2–Ar is higher than the amorphous BN and amorphous Si3N4 ceramics deposited separately.
X-ray powder diffraction (XRD) patterns of Si–B–N coating deposited on the carbon fiber cloth heat-treated for 2 h from 1200 to 1800 °C under N2 of 1 atm.

When heat treated at 1800 °C for 2 h under N2 atmosphere, peaks of Si3N4 disappeared completely and crystalline SiC appeared. It is far more likely that a carbothermic reduction reaction between Si3N4 and the carbon substrate happened.
 $$3{\rm{C}} + {\rm{S}}{{\rm{i}}_3}{{\rm{N}}_4} = 3{\rm{SiC}} + 2{{\rm{N}}_2}\left( {\rm{g}} \right)\quad .$$
The ΔG of reaction (3.5) at 1800 °C was −110.72 kJ, calculated by the Factsage program. This reaction also occurred in the crystallization of polymer-derived silicon carbonitride. Reference Friess, Bill, Golczewski, Zimmermann, Aldinger, Riedel and Raj50 It generated SiC and N2 gas, which confirmed the facts that peaks of SiC appeared in XRD patterns and micro pores emerged in the coating morphology after annealing at 1800 °C. Thus, it is necessary to further research the phase transformation of amorphous Si–B–N ceramics at elevated temperatures above 1600 °C using substrates without carbon, such as SiC. Moreover, the effect of elemental contents on the crystallization behavior of the amorphous Si–B–N ceramics fabricated by CVD is worth investigating in the future.
IV. CONCLUSIONS
Ternary phase diagram of SiCl4–NH3–BCl3–H2–Ar was calculated and experimentally validated by deposition of Si–B–N ceramic coatings on the carbon fiber cloth and by detailed investigation of the phase composition and microstructure of the coatings. Microstructure evolution and phase transformation of the as-deposited Si–B–N ceramic coating with different annealing temperatures were investigated to evaluate its thermal stability. The conclusions are as follows:
-
(1) Condensed phase regions are strongly depended on the temperature. BN + Si3N4 dual phase regions existed at excess of NH3, and BN was the main condensed phase. Through the deposition efficiency analysis, temperatures below 1000 °C were beneficial to achieve codeposition of BN and Si3N4 and to keep higher theoretical deposition efficiencies. Meanwhile, the pressure and dilution ratio of H2 had little influence on deposition efficiencies of BN and Si3N4.
-
(2) Amorphous Si–B–N ceramic coatings were successfully deposited on the carbon fiber cloth from SiCl4–NH3–BCl3–H2–Ar by CVD at 800 °C, in which N–Si bonds and N–B bonds are formed, and the N–B bond was dominant. Phase transformation at elevated temperatures suggested that as-prepared Si–B–N ceramic coatings kept the X-ray amorphous below 1600 °C and partly transformed to α/β-Si3N4 when heat treated at 1600 °C. Above 1600 °C, carbothermic reduction reaction between the carbon substrate and Si3N4 formed in Si–B–N ceramic coatings occurred. Compared with the crystallization behavior of amorphous Si3N4 and BN ceramics deposited separately, the thermal stability of amorphous Si–B–N ceramics was higher than that of amorphous Si3N4 and amorphous BN ceramics.
ACKNOWLEDGMENTS
The authors acknowledge the support of the Chinese National Foundation for Natural Sciences under Contracts (Nos. 51672217, 51472201, 51602257, 51602258, and 51632007), the Research Fund of the State Key Laboratory of Solidification Processing (Grant No. 120-TZ-2015).