Introduction
Direct conversion of solar radiation into electricity with photovoltaics represents a major component of proposed renewable energy portfolios, yet currently comprises less than 0.2% of energy production in the United States1 and approximately 0.4% of global energy production,2 indicating tremendous opportunity for innovation in materials that more efficiently and inexpensively harness the abundance of solar insolation. Of existing photovoltaic technologies, crystalline silicon cells currently dominate production, with grid-connected electricity generation as the main end-use of these cells.3 The potential for lower production and materials costs make thin-film inorganic and organic solar cells leading candidates for ushering in wide-scale adoption of photovoltaics.
Inorganic thin-film solar cells have demonstrated 20% efficiency, already making them competitive with crystalline silicon photovoltaics, which have exhibited 25% efficiency.Reference Green, Emery, Hishikawa, Warta and Dunlop4 It is estimated that organic photovoltaics will become cost competitive with crystalline silicon cells at efficiencies between 5% and 10% and at lifetimes between 5 and 10 years;Reference Azzopardi, Emmott, Urbina, Krebs, Mutale and Nelson5 by comparison, crystalline silicon solar cells are typically sold with 20–25 year warranties. Remarkably, the efficiency of organic solar cells has increased from 3% to 10% in the last five years,Reference Green, Emery, Hishikawa, Warta and Dunlop4, Reference Green, Emery, King, Hishikawa and Warta6 and the upper practical efficiency limit has been estimated to be ∼20%.Reference Forrest7 A better understanding of nanoscale phenomena in both organic and thin-film inorganic photovoltaics is needed for this progress to continue apace. The goal of this brief article is to survey scanning probe microscopy (SPM) studies of these fascinating materials. It is fair to say that SPM measurements continue to influence organic semiconductor development by forcing the materials science community to revise its assumptions about charge trapping and charge injection in these materials. For example, SPM has played a seminal role in disentangling and separately analyzing the processes of charge injection, charge transport, and charge trapping at the organic/metal and organic/dielectric interfaces in organic transistors.Reference Silveira, Muller, Ng, Dunlap, Marohn, Kalinin and Gruverman8, Reference Pingree, Reid and Ginger9 While this article focuses on scanning probe studies of organic and thin-film inorganic photovoltaics, other types of devices, such as dye sensitized solar cellsReference Zorn, Weber, Tahir, Tremel, Butt, Berger and Zentel10 and quantum dot solar cells,Reference Choi, Wenger, Hoffman, Lim, Luria, Jasieniak, Marohn and Hanrath11 have benefited from similar investigations. SPM has been invaluable both for optimizing individual solar cell devices and, more generally, in helping the community understand the sub-processes at play in solar cells made from both organic and inorganic materials.
Materials issues
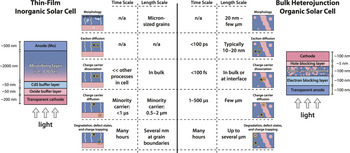
The main components of a single layer thin-film inorganic solar cell are shown in Figure 1 (left). Such devices typically employ thin layers of Al-doped ZnO and intrinsic ZnO as a light-transparent cathode, followed by a CdS “buffer” layer. The light absorbing component consists of an inorganic semiconductor (i.e., Cu(In,Ga)Se2 – CIGSe – or CdTe), and the anode usually consists of molybdenum deposited on a soda-lime glass substrate. As revealed through surface potential imaging with Kelvin probe force microscopy (KPFM), charge separation in CIGSe solar cells occurs at a homojunction buried ∼50 nm in the absorbing layerReference Jiang, Hasoon, Moutinho, Al-thani, Romero and Al-jassim12 due to Cd doping of this layer.Reference Cojocaru-Miredin, Choi, Wuerz and Raabe13
The structures of representative inorganic and organic solar cells. The table enumerates general time and length scales of the fundamental processes contributing to the photovoltaic action in each device. Ovals represent excitons, circles represent mobile charges, and squares represent trapped charges. CIGSe, Cu(In,Ga)Se2.

The main components of a typical bulk-heterojunction organic solar cell are also shown in Figure 1 (right). The transparent electrode is the anode in these devices and most often consists of SnO2-doped In2O3 (ITO) coated with a thin electron blocking layer, such as the heavily doped polymer PEDOT:PSS.Footnote * A blend of a donor (i.e., π-conjugated polymerReference Brabec, Sariciftci and Hummelen14, Reference Mayer, Scully, Hardin, Rowell and McGehee15 or small moleculeReference Peumans, Yakimov and Forrest16–Reference Hains, Liang, Woodhouse and Gregg18) and an acceptor (i.e., fullerene derivative) makes up the photoactive layer in bulk-heterojunction cells. This layer is then capped with a thin (<5 nm) hole blocking layer (i.e., LiF) and finally with a metal electrode (i.e., Al) as the cathode.
To help put scanning probe studies into context, in the middle of Figure 1, we list the time and length scales of the fundamental processes contributing to photovoltaic action in each type of device. It is important to appreciate that photocurrent is generated very differently in inorganic and organic semiconductor devices. In both materials, light absorption creates an exciton. In the inorganic material, the exciton’s electron and hole are weakly bound and thermally dissociate in high yield; the pn junction’s role in this device is to provide an electric field to drive the electron and hole in opposite directions to create a net current. Producing a low-cost thin-film inorganic solar cell typically necessitates working with polycrystalline, multi-component materials having micron-scale features. Therefore, pressing questions regarding inorganic solar cells include determining the location of the pn junction; quantifying trapped charge; identifying defect sites and determining their role in charge generation; and measuring the energy levels and electric fields at grain boundaries and interfaces.
In organic solar cells, by contrast,Reference Gregg19, Reference Gregg and Hanna20 the exciton’s electron and hole are tightly bound (∼500 meV),Reference Bredas, Cornil and Heeger21, Reference Alvarado, Seidler, Lidzey and Bradley22 and a heterojunction is required to dissociate them. Achieving high photocurrent is thought to require an organic layer consisting of interpenetrating donor and acceptor networks whose width is on the order of twice the exciton diffusion length, typically 10 to 20 nm. In studying organic solar cells, the challenges for materials analysis include measuring the rates of exciton diffusion and charge transport, particularly across heterogeneous interfaces; determining the mechanisms of degradation and charge trapping; identifying the location of charge generation; measuring the energy levels and electric fields at the organic/organic and organic/metal interfaces; and assessing the 3D structure and connectivity of the donor-acceptor network. In both organic and inorganic solar cell materials, probing many of these phenomena requires the simultaneous imaging of structure and function.
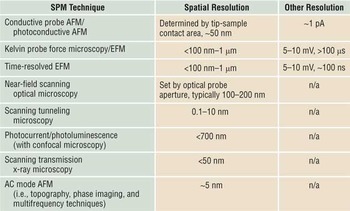
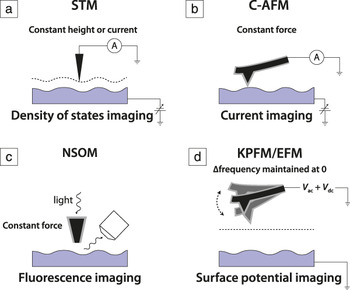
In Figure 2, we sketch the various SPM techniques used to study solar cell materials, as discussed in detail later. Comparing the length and time scales of the photovoltaic sub-processes in Figure 1 with the experimental resolutions listed in Table I, we can appreciate what scanning probe studies can tell us about the fundamental properties of a solar cell. Spatial resolution ranges from 700 nm for photocurrent microscopy, to (best case) a few nm for atomic force microscopy (AFM) and KPFM,Reference Zerweck, Loppacher, Otto, Grafstrom and Eng23–Reference Spadafora, Demadrille, Ratier and Grevin27 and 20 nm for conductive- and photoconductive AFM—sufficient for studying device-relevant surface features in both inorganic and organic solar cells. Temporal resolution can be as good as 100 ns for time-resolved electric force microscopy (tr-EFM).Reference Giridharagopal, Rayermann, Shao, Moore, Reid, Tillack, Masiello and Ginger28 While insufficient for directly probing exciton diffusion and carrier dissociation, this temporal resolution allows observation of transient charge diffusion and charge trapping.
Scanning probe microscopy resolutions.

AFM, atomic force microscopy; EFM, electric force microscopy.
Scanning probe microscopies used to study inorganic and organic solar cell materials and devices. (a) STM, scanning tunneling microscopy; (b) C-AFM, conductive atomic force microscopy; (c) NSOM, near-field scanning optical microscopy; (d) KPFM, Kelvin probe force microscopy; EFM, electric force microscopy; A, ammeter; V ac and V dc, ac and dc biases applied to tip, respectively.

Scanning tunneling microscopy (STM) and AFM are routinely used to assess the nanoscale surface structure of solar cell films. A key attraction of the remaining SPMs enumerated in Figure 2 is their ability to carry out functional imaging, particularly under illumination. By functional imaging, we mean simultaneously recording images of local morphology and, for example, surface potential or photocurrent. No microscope exists that is capable of performing 3D, nanoscale-resolved functional imaging of a working, as-fabricated solar cell device. Nevertheless, the microscopies listed in Figure 2 have made major contributions to optimizing individual devices, understanding and improving materials, and identifying poorly performing domains that limit macroscopic efficiency.Reference Choi, Wenger, Hoffman, Lim, Luria, Jasieniak, Marohn and Hanrath11, Reference Alvarado, Seidler, Lidzey and Bradley22, Reference Mönig, Smith, Caballero, Kaufmann, Lauermann, Lux-Steiner and Sadewasser29–Reference Coffey and Ginger32
Scanning probe studies
Sample preparation
For samples rigid enough to be cleaved, SPM techniques can be used to study cross-sectional morphology, conductivity, and electrostatic potential. Cross-sectional SPM studies have mainly been used to study the built-in potential in inorganic thin-film solar cells with KPFM,Reference Jiang, Hasoon, Moutinho, Al-thani, Romero and Al-jassim12, Reference Breymesser, Schlosser, Peiro, Voz, Bertomeu, Andreu and Summhammer33–Reference Mainz, Streicher, Abou-ras, Sadewasser, Klenk and Lux-steiner39 although there is some precedent for carrying out cross-sectional studies of organic solar cells with AFM.Reference Dante, Peet and Nguyen40, Reference Dante, Garcia and Nguyen41
Scanning photocurrent microscopy and near-field scanning optical microscopy (NSOM) can look “inside” a device either by photoexciting through the transparent front contact or by employing a thin semi-transparent back contact. Scanning photocurrent microscopy has limited spatial resolution (<700 nm), however. For high-resolution SPM studies, samples must be prepared with the top contact missing. Since a metal contact in a device enforces a semi-infinite equipotential surface and also likely band bending, SPM studies are necessarily carried out on surfaces that only approximate the real buried interface in a working device. In a STM, conductive AFM (C-AFM), and photoconductive AFM (pc-AFM) experiment, one brings a metal tip into electrical contact with the sample—approximating the top contact in a working device—and images current as a function of voltage and/or illumination. KPFM and electric force microscopy (EFM) are non-contact measurements that image the surface potential and tip-sample capacitance and are thought to approximately represent the sample under open circuit conditions.
For many inorganic samples, it has been important to carry out SPM studies in ultrahigh vacuum to avoid oxidation. While organics do not form oxides, they often degrade due to exposure to both light and air, unless they are encapsulated by a metal contact. Thus, carrying out SPM measurements in vacuum, or at least in an inert atmosphere, is required for studying many organic semiconductors.
Scanning tunneling microscopy
STMReference Binnig, Rohrer, Gerber and Weibel42 has provided insight critical to the physics of solar cell operation, including the exciton binding energy in a semiconducting polymer,Reference Alvarado, Seidler, Lidzey and Bradley22, Reference Alvarado, Barth, Bässler, Scherf, van der Horst, Bobbert and Michels43, Reference Kemerink, Alvarado, Müller, Koenraad, Salemink, Wolter and Janssen44 the electrostatic potential distribution inside an organic semiconductor,Reference Kemerink, Offermans, Van duren, Koenraad, Janssen, Salemink and Wolter45 and the metal-organic injection barrier.Reference Kemerink, Alvarado, Müller, Koenraad, Salemink, Wolter and Janssen44 Scanning tunneling spectroscopy (STS)Reference de Lozanne, Elrod and Quate46 has been used to acquire the density of states (DOS) in hydrogenated microcrystalline siliconReference Azulay, Millo, Savir, Conde and Balberg47 and at grain boundaries in chalcopyrites.Reference Mönig, Smith, Caballero, Kaufmann, Lauermann, Lux-Steiner and Sadewasser29
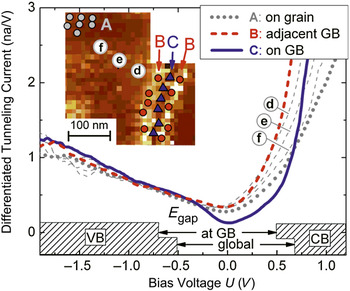
Representative data are shown in Figure 3. Using STM and STS, Mönig et al.Reference Mönig, Smith, Caballero, Kaufmann, Lauermann, Lux-Steiner and Sadewasser29 found that grain boundaries in Cu(In,Ga)Se2 thin films exhibited a lowered DOS relative to the grain surfaces. Figure 3 shows tunneling spectra at and around the grain boundary and on the grain surface. These data confirm the lower DOS at the grain boundary, indicate band bending into the grain, and reveal a high defect density on the grain surface. These observations imply low recombination activity at grain boundaries, meaning such sites do not have the same deleterious effects on chalcopyrite-based solar cells as they do in polycrystalline silicon solar cells.
Scanning tunneling spectroscopy near a grain boundary (GB) in a Cu(In,Ga)Se2 thin film. Differentiated tunneling spectra recorded in the vicinity of a GB. The three bold lines (curves A, B, and C) are averaged spectra, where the locations of all single spectra used for the averaging are indicated by symbols in the inset tunneling current image. The single spectra d, e, and f indicate a band bending effect toward the GB. V, voltage; E gap, bandgap energy; VB, valence band; CB, conduction band. Reprinted with permission from Reference Reference Mönig, Smith, Caballero, Kaufmann, Lauermann, Lux-Steiner and Sadewasser29. ©2010, American Physical Society.

Atomic force microscopy
AFMReference Binnig, Quate and Gerber48 is routinely used to study morphology after processing. In organic solar cells, for example, AFM has been used to observe that the rate of solvent evaporation greatly affects domain separation in polyfluorene:PCBMFootnote † (donor:acceptor) blends.Reference Nilsson, Bernasik, Budkowski and Moons49 Furthermore, in cross-sectioned samples, AFM has been used to reveal the sub-surface morphology of donor-acceptor networks.Reference Dante, Garcia and Nguyen41 Combined with bulk solar cell performance, such studies allow assessment of the processing conditions that optimize domain connectivity.
Conductive atomic force microscopy
Conductive AFMReference Kelley, Granstrom and Frisbie50 has been used to map conduction paths in microcrystalline silicon and hydrogenated microcrystalline siliconReference Azulay, Millo, Savir, Conde and Balberg47, Reference Azulay, Balberg, Chu, Conde and Millo51 and in chalcopyrites.Reference Azulay, Millo, Balberg, Schock, Visoly-Fisher and Cahen52 If the tip-sample contact with the semiconductor is ohmic, then from the observed space charge limited current, one can estimate the local charge mobility with high spatial resolution.Reference Guide, Dang and Nguyen30, Reference Reid, Munechika and Ginger53 This being said, an ohmic organic/metal contact is, in general, difficult to achieve. By using high and low work function metals for the tip, one can use C-AFM to image the hole and electron paths to the substrate, respectively.Reference Dante, Peet and Nguyen40 Measuring C-AFM current-voltage curves as a function of annealing, one can learn whether the spatial homogeneity limits the internal quantum efficiency,Reference Pingree, Reid and Ginger54 that is, the number of charge carriers collected per photon absorbed by the cell.
Photoconductive atomic force microscopy
In organic materials, photoconductive AFM (i.e., C-AFM performed under illumination)Reference Coffey, Reid, Rodovsky, Bartholomew and Ginger55–Reference Xin, Reid, Ren, Kim, Ginger and Jenekhe58 has been used to visualize transport networks and produce high-resolution maps of photocurrent. The dependence of open-circuit voltage on light intensity has been studied by pc-AFM and used to draw conclusions regarding structural anisotropy.Reference Reid, Xin, Jenekhe and Ginger56, Reference Dang, Tamayo, Seo, Hoven, Walker and Nguyen57 pc-AFM has also been used to map photocurrent in chalcopyrites, where it was found that charge transport can proceed (beneficially) through both grains and grain boundaries at potentials large enough to overcome band bending at the latter.Reference Azulay, Millo, Balberg, Schock, Visoly-Fisher and Cahen52
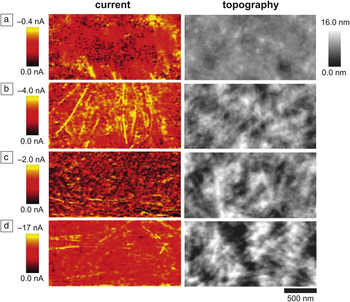
Figure 4Reference Xin, Reid, Ren, Kim, Ginger and Jenekhe58 is taken from a representative study in which AFM, C-AFM, and pc-AFM were used to study films of an organic bulk heterojunction solar cell composed of a 1:1 mixture of P3BTFootnote ‡ polymer nanowires and the small molecule PC71BM processed under various conditions. If the drying time was too short, the resulting films had too few nanowires, resulting in inefficient charge collection. Conversely, for longer drying times, a vast network of nanowires formed shunting pathways, resulting in reduced open-circuit voltage. From their scanning probe measurements, the authors were thus able to describe and explain how different processing conditions affected morphology and device performance.
Conductive atomic force microscopy (C-AFM; left column) and AFM images (right column) of an organic bulk heterojunction solar cell film composed of a 1:1 mixture of P3BT polymer nanowires (streaking features) and the small molecule PC71BM processed under various conditions: (a) 3 min aging then annealing, (b) 50 min aging then annealing, (c) 100 min aging then annealing, and (d) 100 min aging with no annealing. P3BT, poly(3-butylthiophene); PC71BM, [6,6]-phenyl-C71-butyric acid methyl ester. Reprinted with permission from Reference Reference Xin, Reid, Ren, Kim, Ginger and Jenekhe58. ©2010, American Chemical Society.

Scanning optical techniques
Where STM, C-AFM, and KPFM/EFM use a metal probe to map the electrical properties of a material, scanning optical techniques use a focused light source to investigate a material’s optical properties, with photoluminescence and photoconductivity of particular interest for studying photovoltaics. As noted in Table I, scanning optical techniques often have much lower spatial resolution than other varieties of SPM. NSOMReference Betzig, Trautman, Harris, Weiner and Kostelak59 has been used in polymer-blend solar cells to image fluorescence decay lifetime and thereby map charge-carrier generation efficiency,Reference Cadby, Khalil, Fox and Lidzey60 and in Cu(In,Ga)Se2, thin-film solar cells are used to extract local bandgap variations from maps of photoluminescence.Reference Gutay, Pomraenke, Lienau and Bauer61 Near-field scanning photocurrent microscopy has been used to visualize charge transport networks,Reference McNeill and Dastoor62, Reference Mukhopadhyay, Ramachandra and Narayan63 and scanning photocurrent microscopyReference Ahn, Dunning and Park64 has been used to infer the diffusion-lifetime product for holes and electrons in organic semiconductor films.Reference Kabra and Narayan65 Furthermore, confocal scanning photoluminescence and photocurrent microscopy have been used to measure local current collection at both the anode and cathode in a working bulk heterojunction solar cell,Reference Brenner and Mcneill31 illustrating an advantage of scanning photocurrent microscopy over pc-AFM, in which the metal probe serves as a top contact, rather than a typical device electrode.
Kelvin probe force microscopy
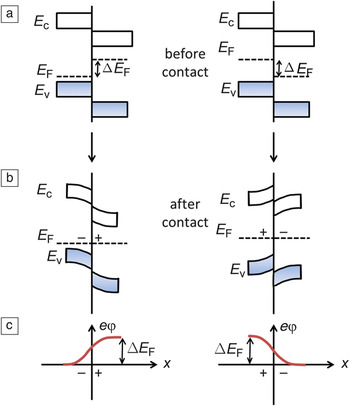
KPFMReference Martin, Abraham and Wickramasinghe66–Reference Kikukawa, Hosaka and Imura69 measures (1) the local electrostatic potential φ at a surface and (2) the derivative of the tip-sample capacitance—∂C ts/∂z (from cantilever force) or, more generally, ∂2C ts/∂z 2 (from cantilever frequency), where z is the coordinate defining tip-sample separation.Reference Kikukawa, Hosaka and Imura69, Reference Albrecht, Grütter, Horne and Rugar70 In interpreting KPFM data, two subtleties must be appreciated. First, the actual quantity measured is φ + ΔW, with ΔW being the difference in work function between the sample and the cantilever’s metal coating. Since the cantilever work function strongly depends on surface contamination and generally varies by ∼100 mV between cantilevers, KPFM is best understood as measuring the relative surface potential. Second, φ is sensitive to both energy levels and chemical potentials. If the chemical potential is initially different in two semiconductors brought into contact, then equilibration will yield interfacial charge transfer and a depletion layer. In Figure 5, we show the electrostatic potential developed by this depletion layer. Since the sign of φ depends on the direction of charge transfer in the depletion layer, it follows that in illuminated samples, the change in potential Δφ indicates the direction of photo-induced interfacial charge transfer.
Energy levels of two differently doped semiconductors (a) before and (b) after they are brought into contact. The energies of the conduction-band edge, valence-band edge, and Fermi level or electron chemical potential are labeled E c, E v, and E F, respectively. (c) The electrostatic potential φ that arises from charge transfer across the interfacial depletion region. ΔE F, difference in Fermi level; e, electron charge; x, distance from interface.

Over an organic donor-acceptor blend, the sign and magnitude of the surface potential depend on the nature of the underlying substrate.Reference Maturova, Kemerink, Wienk, Charrier and Janssen71 This important KPFM finding indicates that the charge density in an organic solar cell material is fundamentally related to not just doping or charge transfer between the donor and acceptor, but also to charge equilibration with the substrate.
Light-induced changes in surface electrostatic potentialReference Spadafora, Demadrille, Ratier and Grevin27, Reference Maturova, Kemerink, Wienk, Charrier and Janssen71–Reference Reid, Rayermann, Coffey and Ginger75 and time-resolved measurements of local capacitanceReference Coffey and Ginger32 have been used to draw conclusions about the spatial distribution of charge generation in organic solar cells. In initial work, Snaith et al. concluded—based on a study of topography, blend ratio, and performance of a PFB:F8BTFootnote § solar cell—that charge is generated at mesoscale interfaces between PFB-rich and F8BT-rich phases.Reference Snaith, Arias, Morteani, Silva and Friend76 This finding was corroborated in a KPFM study.Reference Chiesa, Bürgi, Kim, Shikler, Friend and Sirringhaus73 Other authors, however, have since used a combination of AFM,Reference Coffey and Ginger32, Reference McNeill, Frohne, Holdsworth and Dastoor77 time-resolved EFM,Reference Coffey and Ginger32 photocurrent microscopy,Reference Brenner and Mcneill31, Reference McNeill, Frohne, Holdsworth and Dastoor77 and photoluminescence microscopyReference Brenner and Mcneill31 to conclude that the majority of the photocurrent is generated within the PFB-rich and F8BT-rich phases rather than at the interface of the phases and have suggested that edges act as recombination centers.Reference Groves, Reid and Ginger78 It was also found that a PFB capping layer over the F8BT-rich phase reduces charge collection efficiency.Reference Brenner and Mcneill31, Reference Chiesa, Bürgi, Kim, Shikler, Friend and Sirringhaus73
Turning to inorganic materials, KPFM has been used to measure the work function distribution in the crucial middle layer separating two absorbing materials in tandem quantum dot solar cells.Reference Choi, Wenger, Hoffman, Lim, Luria, Jasieniak, Marohn and Hanrath11 KPFM has also been used to observe differences of up to 250 meV between the metal- and selenium-terminated {112} facets of CuGaSe, implying different band alignments at the pn junction and suggesting inhomogeneous current flow across the junction in devices.Reference Sadewasser, Glatzel, Rusu, Jäger-Waldau and Lux-Steiner79 This conclusion agrees with results of NSOM-based scanning photocurrent microscopy carried out on a CIGSe device prepared with the top CdS layer in place.Reference McDaniel, Hsu and Gabor80
KPFM has been used extensively to study grain boundaries in inorganic solar cell materials. Grain boundaries in chalcopyrites have been examined in the dark,Reference Sadewasser, Glatzel, Schuler, Nishiwaki, Kaigawa and Lux-Steiner81–Reference Baier, Abou-Ras, Rissom, Lux-Steiner and Sadewasser87 under illumination,Reference Fuertes Marrón, Sadewasser, Meeder, Glatzel and Lux-Steiner88 and after chemical treatment prior to CdS depositionReference Jiang, Noufi, Ramanathan, Moutinho and Al-Jassim89 (corroborated by cathodoluminescence imagingReference Hanna, Glatzel, Sadewasser, Ott, Strunk, Rau and Werner84). The role of the buffer layer in modifying potential barriers has also been explored in the darkReference Rusu, Glatzel, Neisser, Kaufmann, Sadewasser and Lux-Steiner90, Reference Glatzel, Rusu, Sadewasser and Lux-Steiner91 and under illumination.Reference Glatzel, Rusu, Sadewasser and Lux-Steiner91 KPFM has been used to identify secondary phases in Cu-rich CuGaSe2 solar cell devices.Reference Fuertes Marrón, Glatzel, Meeder, Schedel-Niedrig, Sadewasser and Lux-Steiner92 Visoly-Fisher et al.Reference Visoly-Fisher, Cohen, Gartsman, Ruzin and Cahen93 has presented an extensive study of grain boundaries in II–VI materials. In all, these studies have improved the understanding of the microstructure, interface formation, and electronic properties of grain boundaries in inorganic devices.
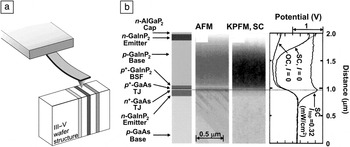
KPFM has been used to carry out electrostatic potential imaging of cross-sections of devices made from GaInP2Reference Jiang, Moutinho, Friedman, Geisz and Al-Jassim35 (under bias and under illumination,Reference Jiang, Moutinho, Friedman, Geisz and Al-Jassim35, Reference Jiang, Friedman, Geisz, Moutinho, Romero and Al-Jassim36 supported by measurements of internal quantum efficiencyReference Ptak, France, Jiang and Reedy38), silicon,Reference Breymesser, Schlosser, Peiro, Voz, Bertomeu, Andreu and Summhammer33 II–VI semiconductors,Reference Visoly-Fisher, Cohen, Cahen and Ferekides37 III–V semiconductors,Reference Ptak, France, Jiang and Reedy38 and chalcopyriteReference Jiang, Hasoon, Moutinho, Al-thani, Romero and Al-jassim12, Reference Glatzel, Fuertes Marrón, Schedel-Niedrig, Sadewasser and Lux-Steiner34, Reference Mainz, Streicher, Abou-ras, Sadewasser, Klenk and Lux-steiner39 devices. One strength of cross-sectional experiments is the ability to study the potential profile across the device under applied bias and under illumination. In the case of a tandem solar cell, the illumination energy can be selected to provide absorption in either the top cell or in the bottom cell, leading to flattening of the band of the respective cell.Reference Jiang, Moutinho, Friedman, Geisz and Al-Jassim35, Reference Jiang, Friedman, Geisz, Moutinho, Romero and Al-Jassim36 For the compound GaInNAs, which is a possible candidate for the fourth junction in a multi-junction solar cell, potential profiles through the device structure measured by KPFM could confirm the position of the junction to be in good agreement to that determined indirectly from internal quantum efficiency measurements.Reference Ptak, France, Jiang and Reedy38 Representative data showing the potential profile collected across a GaInP2/GaAs tandem solar cell using KPFM in air is shown in Figure 6. Limited resolution in the experiment due to surface contamination and oxidation resulted in a difference between the experimental result and 1D Poisson simulations of the potential profile of the device structure. Specifically, Fermi-level pinning due to surface defects can modify the experimental potential profile.
Cross-sectional Kelvin probe force microscopy (KPFM) measurements of a GaInP2/GaAs tandem solar cell. (a) Arrangement of the atomic force microscopy (AFM) and sample for a cross-sectional measurement. (b) KPFM images and potential profiles taken on the cross-section of a GaInP2/GaAs tandem solar cell. The layered structure is shown on the left side. Potential profiles were taken in the dark at open circuit and under illumination at both open and short circuit conditions. The horizontal line indicates the location of the tunneling junctions. KPFM measurements taken while illuminating the sample with photon energies greater than the bandgap allowed identification of the boundary between the bottom and tunneling junctions, as indicated by the horizontal line. TJ, tunneling junction; BSF, back surface field; SC, short circuit; OC, open circuit; I, illumination intensity; I top, illumination intensity of top cell. (b) Reproduced with permission from Reference Reference Jiang, Moutinho, Friedman, Geisz and Al-Jassim35. ©2003, American Institute of Physics.

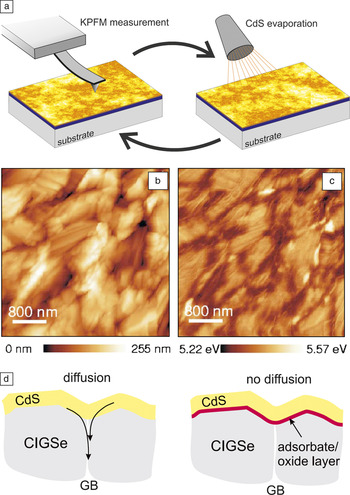
Figure 7 presents KPFM data from a representative study of the evolution of interface formation in a CIGSe thin film during step wise deposition of a CdS buffer layer.Reference Rusu, Glatzel, Neisser, Kaufmann, Sadewasser and Lux-Steiner90, Reference Glatzel, Rusu, Sadewasser and Lux-Steiner91 A lowering of the work function was evident up to 200 nm away from the CIGSe grain boundaries with a ∼10 nm CdS layer deposited by thermal evaporation (Figure 7b–c). This work function decrease could only be observed for clean CIGSe substrates, which were prepared in ultrahigh vacuum conditions by thermal desorption of a protective Se-capping layer. For CIGSe thin films with a native oxide, a similar effect could not be observed. The measured decrease in work function was therefore interpreted as arising from a diffusion process along CIGSe grain boundaries, where the oxide layer on the CIGSe surface prevents the corresponding diffusion process (Figure 7d). The diffusion of elements from the CdS buffer layer into the grain boundaries enhances the interface area by formation of a 3D pn junction, which enhances carrier collection and increases device efficiency.Reference Rusu, Glatzel, Neisser, Kaufmann, Sadewasser and Lux-Steiner90 The diffusion of Cd and S deep into the CIGSe absorber was confirmed by x-ray spectroscopy.Reference Rusu, Bär, Lehmann, Sadewasser, Weinhardt, Kaufmann, Strub, Röhrich, Bohne, Lauermann, Jung, Heske and Lux-Steiner94
Kelvin probe force microscopy (KPFM) measurements of surface potential over thin CdS films grown on a Cu(In,Ga)Se2 (CIGSe) layer. (a) Increasing CdS film thicknesses were measured in the KPFM by subsequent evaporation of CdS material. Simultaneously obtained (b) topography and (c) work function images obtained by KPFM for a 2.3-nm-thick CdS film. (d) A work function decrease around the grain boundaries (GBs) is observed, indicating diffusion of elements from the CdS film into the GBs of the Cu(In,Ga)Se2 film (left). For samples with an oxide surface layer, such effects were not observed (right). Images partly reproduced with permission from Reference Reference Rusu, Glatzel, Neisser, Kaufmann, Sadewasser and Lux-Steiner90, ©2006, American Institute of Physics, and Reference Reference Glatzel, Rusu, Sadewasser and Lux-Steiner91, ©2008, IOP Publishing.

Time-resolved electric force microscopy
Time-resolved electric force microscopy (tr-EFM)Reference Coffey and Ginger32 has been used to study charge generation in organic solar cells,Reference Coffey and Ginger32, Reference Reid, Rayermann, Coffey and Ginger75 where it was established that charging time correlated with a device’s short-circuit photocurrent, providing a direct link between device performance and the local electrical properties and phase separation of organic semiconductor blends. In a study of photo-induced degradation in an organic solar cell, it was observed that tr-EFM was a more sensitive and accurate measure of degradation than changes in surface potential.Reference Reid, Rayermann, Coffey and Ginger75 Specifically, tr-EFM detected reductions in photoactivity at photon doses 32 times less than KPFM. The time resolution of tr-EFM has recently been extended down to 100 ns,Reference Giridharagopal, Rayermann, Shao, Moore, Reid, Tillack, Masiello and Ginger28 allowing the study of shorter charging times, which are associated with larger short circuit photocurrents, and thus, higher performing devices.
Conclusions
There is a pressing need for a better developed understanding of the sub-processes at play in emerging photovoltaic materials and technologies. In this article, we have summarized the relevant time and length scales of the fundamental processes involved in solar cell operation in two important classes of materials—inorganic thin films and organic bulk heterojunctions. We have defined open questions pertinent to device operation, evaluated the opportunities and limitations of scanning probe techniques in addressing these issues, and discussed numerous contributions already made by scanning probe techniques toward deepening our understanding of solar cell operation. While some of the measurements described here require specialized hardware and expertise, an increasing number of sophisticated scanning probe microscopy measurements can be carried out on commercially available instruments. A major advantage of scanning probe techniques is their ability to make local measurements, enabling the direct correlation of physical (morphology, material phase) and electronic (photocurrent, photovoltage, charge trapping, energy levels) phenomena. Although no single tool can fully analyze an operating solar cell, scanning probe techniques provide crucial and unique data and should become more widely adopted in photovoltaic research.
Acknowledgments
J.R.O. acknowledges the support of the Energy Materials Center at Cornell (EMC2), an Energy Frontier Research Center funded by the US Department of Energy’s Office of Basic Energy Sciences (DE-SC0001086). L.M.B. acknowledges an NSF Graduate Research Fellowship. N.C.H. acknowledges the support of the Center for Nanoscale Systems (CNS) at Cornell, funded through the NSF (EEC-0117770 and EEC-0646547). J.A.M. and L.M.B. acknowledge the support of the NSF (DMR-1006633). S.S. acknowledges the support of many colleagues at the Helmholtz-Zentrum Berlin für Materialien und Energie and financial support from the Deutsche Forschungsgemeinschaft (DFG), the Bundesministerium für Umwelt, Naturschutz und Reaktorsicherheit (BMU), and European Union.