





1 Introduction
High-power, high-brightness fiber lasers underpin a wide range of technologies, from industrial manufacturing to space exploration and scientific discovery[ Reference Jauregui, Limpert and Tünnermann 1 – Reference Wen, Zhang, Zhu, Gao, Jiang, Tao, Chu, Shu, Li, Zhang, Lin, Peng and Wang 7 ]. As their output power continues to rise, thermal effects in the fiber become increasingly severe, and the resulting dynamic transverse mode instability (TMI) has now overtaken thermal lensing as the principal barrier to further power scaling[ Reference Zervas 8 – Reference Rao, Chen, Wang, Li, Yang, Zhao, Ye, Tang, Wang, Li, Chen, Cao, Xiao, Liu, Ma and Yao 12 ]. Although TMI was first observed in high-power pulsed fiber lasers[ Reference Eidam, Hanf, Seise, Andersen, Gabler, Wirth, Schreiber, Limpert and Tünnermann 13 ], for years it was thought that its threshold depended on the average output power[ Reference Eidam, Wirth, Jauregui, Stutzki, Jansen, Otto, Schmidt, Schreiber, Limpert and Tünnermann 14 – Reference Laurila, Jørgensen, Hansen, Alkeskjold, Broeng and Lægsgaard 16 ]. However, recent experiments have overturned this view[ Reference Jauregui, Stihler, Tünnermann and Limpert 17 – Reference Ding, Li, Zeng, Wu, Zhang, Wang, Ning and Xi 22 ]. Stable operation at twice the nominal TMI threshold achieved through pump modulation[ Reference Jauregui, Stihler, Tünnermann and Limpert 17 ], and the introduction of hybrid continuous-wave (CW)/quasi-continuous-wave (QCW) pumping that raises the threshold by more than 75%[ Reference Ding, Li, Zeng, Wu, Zhang, Wang, Ning and Xi 22 ], reveal that the onset of TMI is governed not only by time-averaged thermal loading but also by the temporal dynamics of the laser’s operation.
Yet, the underlying physical mechanism remains elusive. Existing theoretical frameworks fail to provide a unified, quantitative picture that can predict the TMI threshold under general temporal modulation schemes[ Reference Stihler, Jauregui, Tünnermann and Limpert 23 , Reference Stihler, Jauregui, Tünnermann and Limpert 24 ]. The proposed non-adiabatic waveguiding perspective[ Reference Jauregui, Eidam, Otto, Stutzki, Jansen, Limpert and Tüennermann 25 ], for example, relies on idealized assumptions (the quasi-static modal interference pattern (MIP) and refractive index grating (RIG)) that do not extend to the complex, noise-driven TMI observed in practical systems[ Reference Smith and Smith 26 , Reference Stihler, Jauregui, Kholaif and Limpert 27 ] and, critically, does not offer a predictive guide for optimizing control parameters[ Reference Kholaif, Jauregui and Limpert 20 ]. Consequently, leveraging temporal control for TMI suppression remains a largely empirical, trial-and-error process, severely limiting the potential of high-power laser systems[ Reference Chai, Liu, Wang, Zhou, Zhang, Liu, Zhang, Lu, Zhang, Jiang and Zhao 28 ]. A quantitative, physically grounded model is urgently needed to move beyond intuition and enable predictable power scaling.
Here, we provide a comprehensive theoretical framework to unify the roles of temporal modulation and nonlinear effects in TMI. Through detailed numerical simulations, we reveal that self-phase modulation (SPM), a neglected nonlinear effect in this context, is the dominant physical mechanism responsible for TMI suppression. We show that SPM, by inducing rapid, chaotic fluctuations in the modal phases, effectively disrupts the resonant energy transfer between the fundamental and higher-order modes (HOMs), generating a dynamic, non-stationary thermal grating. Building on this core physical insight, we develop a quantitative predictive model that directly links modulation parameters and fiber properties to the TMI threshold. This work not only provides the missing fundamental understanding of nonlinear TMI suppression but also establishes a design methodology for temporal modulation, offering a clear and scalable pathway to overcome the TMI bottleneck and enable a new generation of high-power, high-brightness fiber lasers.
2 Theoretical model
The two-beam coupling theory considering the interaction between the fundamental mode (FM) and the dominant HOM is employed to characterize the TMI effect. The TMI process is initiated when the MIP between these two modes creates a thermally induced RIG via the thermo-optic effect. Meanwhile, the frequency shift between the FM and the HOM drives the motion of the MIP, resulting in a phase shift between the MIP and the RIG. Subsequently, the RIG exerts a feedback effect on the MIP depending on this phase shift, thereby inducing dynamic intermodal coupling. To simplify the coupling process, we consider only the FM and the lowest-order HOM in the following analysis. The slowly varying electric field envelopes of the LP
${}_{01}$
 mode and LP
${}_{11}$
 mode can be expressed as follows:

where the subscripts 1 and 2 denote the LP
${}_{01}$
 mode and LP
${}_{11}$
 mode, respectively, A is the amplitude, f is the normalized mode field distribution,
$\beta$
 is the propagation constant and
${\omega}_\mathrm{s}$
 is the angular frequency.
Based on the pulse-propagation equation in multimode fibers[
Reference Agrawal
29
], the coupled-mode equations for the LP
${}_{01}$
 mode and LP
${}_{11}$
 mode can be written as follows:


where
$m$
 ,
$n$
 ,
${p}$
 ,
$q$
 can take the values 1 and 2;
${g}_1$
 and
${g}_2$
 denote the pump gains of the LP
${}_{01}$
 mode and LP
${}_{11}$
 mode, respectively;
$\Delta \beta$
 represents the nonlinear dispersive term;
${g}_\mathrm{s}$
 is the transverse gain distribution;
${k}_0$
 is the wavenumber; and
$\Delta n$
 denotes the thermally induced refractive index change, which is governed by the heat conduction:


where
$\kappa$
 ,
$\rho$
 ,
${C}_0$
 and
${k}_\mathrm{T}$
 are the fiber’s thermal conductivity, density, specific heat capacity, and thermo-optic coefficient, respectively;
$Q$
 is the heat density distribution; and
${\lambda}_\mathrm{s}$
 ,
${\lambda}_\mathrm{p}$
 denote the signal and pump wavelengths. Notably, unlike in our prior work[
Reference Hansen, Alkeskjold, Broeng and Lægsgaard
30
], Equation (7) omits gain saturation to reduce model complexity and isolate the role of nonlinear dispersion in intermodal coupling.
The coupling dynamics are critically influenced by nonlinear dispersion terms, which arise from the nonlinear polarization. While 16 such terms exist in principle, modal orthogonality reduces them to eight non-trivial contributions. To facilitate the investigation of the influence of dispersion arising from thermally induced refractive index changes, it can be categorized into SPM, cross-phase modulation (XPM) and four-wave mixing (FWM) based on the form of dispersion[
Reference Hansen, Alkeskjold, Broeng and Lægsgaard
30
, Reference Zervas
31
]. Among these, the terms
$\Delta {\beta}_{1111}$
 ,
$\Delta {\beta}_{2211}$
 ,
$\Delta {\beta}_{1122}$
 and
$\Delta {\beta}_{2222}$
 originate from SPM;
$\Delta {\beta}_{1221}$
 and
$\Delta {\beta}_{2112}$
 are associated with XPM and contribute to the formation of the RIG required for TMI initiation[
Reference Hansen, Alkeskjold, Broeng and Lægsgaard
30
, Reference Li, Wu, Yang, Ding, Huang, Pan, Wang and Zhou
32
, Reference Dong
33
]; and
$\Delta {\beta}_{2121}$
 ,
$\Delta {\beta}_{1212}$
 arise from FWM, which may induce static TMI effects, but they are rarely observed in conventional single-core fibers[
Reference Zervas
31
, Reference Lægsgaard, Poli, Cucinotta and Selleri
34
, Reference Li, Huang, Wu, Chen, Pan and Zhou
35
].
To specifically investigate the role of SPM, we simplify the model by considering a common scenario where the laser operates in a near diffraction-limited regime (
$\mid {A}_1\mid \gg \mid {A}_2\mid$
 ) within a single-core fiber. This allows us to retain only the essential XPM terms and the dominant SPM contributions, and thus the coupled-mode equations (Equations (2) and (3)) can be simplified to the following:


The key to the suppression mechanism lies in the difference between the two primary SPM-induced dispersion terms, defined as
$D$
 :

The thermally induced refractive index change
$\Delta {n}_{11}$
 , which is predominantly localized in the central region of the fiber core, implies a stronger
$\Delta {\beta}_{1111}$
 compared to
$\Delta {\beta}_{1122}$
 . The corresponding beat length
${L}_{\mathrm{beat}}$
 is therefore approximated as follows:

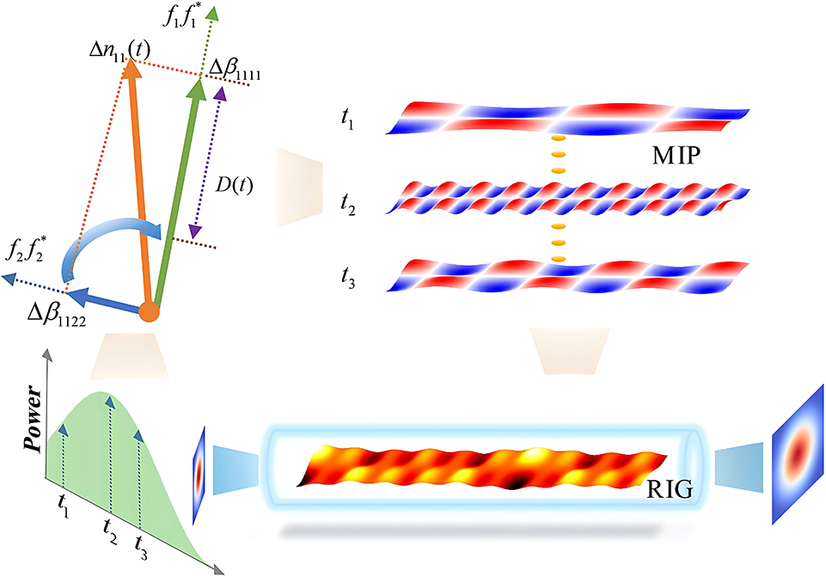
The MIP beat length is inversely proportional to the dispersion difference induced by the SPM effect. Since the strength of SPM is proportional to the instantaneous laser power, power modulation dynamically alters the beat length along the fiber. Therefore, as illustrated in Figure 1, a modulated power profile creates a cascade of MIPs, each with a different beat length. These individual MIPs generate their own RIGs, which then superimpose to form a disordered, composite grating. This composite grating has a significantly reduced net strength and, crucially, lacks a fixed phase relationship with any single MIP. This disruption of the coherent coupling condition is the fundamental mechanism by which temporal modulation actively suppresses TMI.
Physical mechanism of the SPM-suppressed TMI effect. SPM-induced dispersion projects thermal load onto modes, with projection disparities altering the MIP period. Power fluctuations dynamically adjust this period via SPM-dispersion differences. The resulting superposition of MIP-driven RIGs yields a disordered grating, which inhibits modal coupling and maintains beam quality.

Figure 1 Long description
The diagram is divided into four functional zones.
1. Top-Left Vector Diagram: An orange dot serves as the origin for several vectors. An orange arrow labeled delta n sub 1 1 open parenthesis t close parenthesis points upward. A green arrow labeled f sub 1 f sub 1 super asterisk points further upward. A blue arrow labeled delta beta sub 1 1 2 2 points left, while a dotted blue arrow labeled f sub 2 f sub 2 super asterisk points further left. A purple vertical double-headed arrow labeled D open parenthesis t close parenthesis measures the distance between delta beta sub 1 1 1 1 and the origin. A curved blue arrow indicates a rotational relationship between the orange and blue vectors.
2. Top-Right Temporal Sequence: Three horizontal wave patterns labeled M I P are stacked vertically, corresponding to time steps t sub 1, t sub 2, and t sub 3. The patterns consist of alternating red and blue segments. The pattern at t sub 2 is significantly more compressed and higher frequency than t sub 1 and t sub 3. Yellow dashed lines connect the centers of these patterns.
3. Bottom-Left Power Graph: A line graph with a vertical axis labeled Power and a horizontal axis showing time. A green shaded area under a curve contains three vertical dashed arrows marking t sub 1, t sub 2, and t sub 3, showing power increasing then decreasing.
4. Bottom-Right Fiber Model: A cylindrical fiber contains a complex, disordered three-dimensional wave pattern labeled R I G with yellow and red peaks. To the left, a small square shows a multi-mode beam profile. To the right, a larger square shows a stabilized, high-quality Gaussian-like beam profile.
3 Phase shift modulated by the self-phase modulation effect
To investigate the influence of SPM on temporal modulation for suppressing TMI, we compare the laser output before and after including the SPM effect in our theoretical model. Current systematic research on TMI suppression via temporal modulation has primarily centered on large-pitch fiber (LPF)[
Reference Limpert, Stutzki, Jansen, Otto, Eidam, Jauregui and Tünnermann
36
] amplifiers[
Reference Jauregui, Stihler, Tünnermann and Limpert
17
, Reference Kholaif, Jauregui and Limpert
20
, Reference Stihler, Jauregui, Tünnermann and Limpert
24
]. Taking the commonly used LPF45 fiber as an example[
Reference Stihler, Jauregui, Tünnermann and Limpert
24
], Zervas[
Reference Zervas
8
] proposed that its properties can be accurately approximated by modeling a large-mode-area fiber with an 80 μm core diameter and a V-parameter of 3. This approximation effectively captures the transverse mode distribution in LPF systems and has thus guided the selection of simulation parameters in the present study. Therefore, the specific simulation parameters employed in this work are set as follows: core diameter of 80 μm, cladding diameter of 250 μm, core V-parameter of 3, pump wavelength of 976 nm and signal wavelength of 1080 nm. The average power of the single-mode seed source is set to 5 W, the intensity of the HOM noise is
${10}^{-11}$
 W/Hz and the signal gain coefficient is set to 10 dB/m. The amplifier is configured with a modulation frequency of 500 Hz and a modulation depth of 50%.
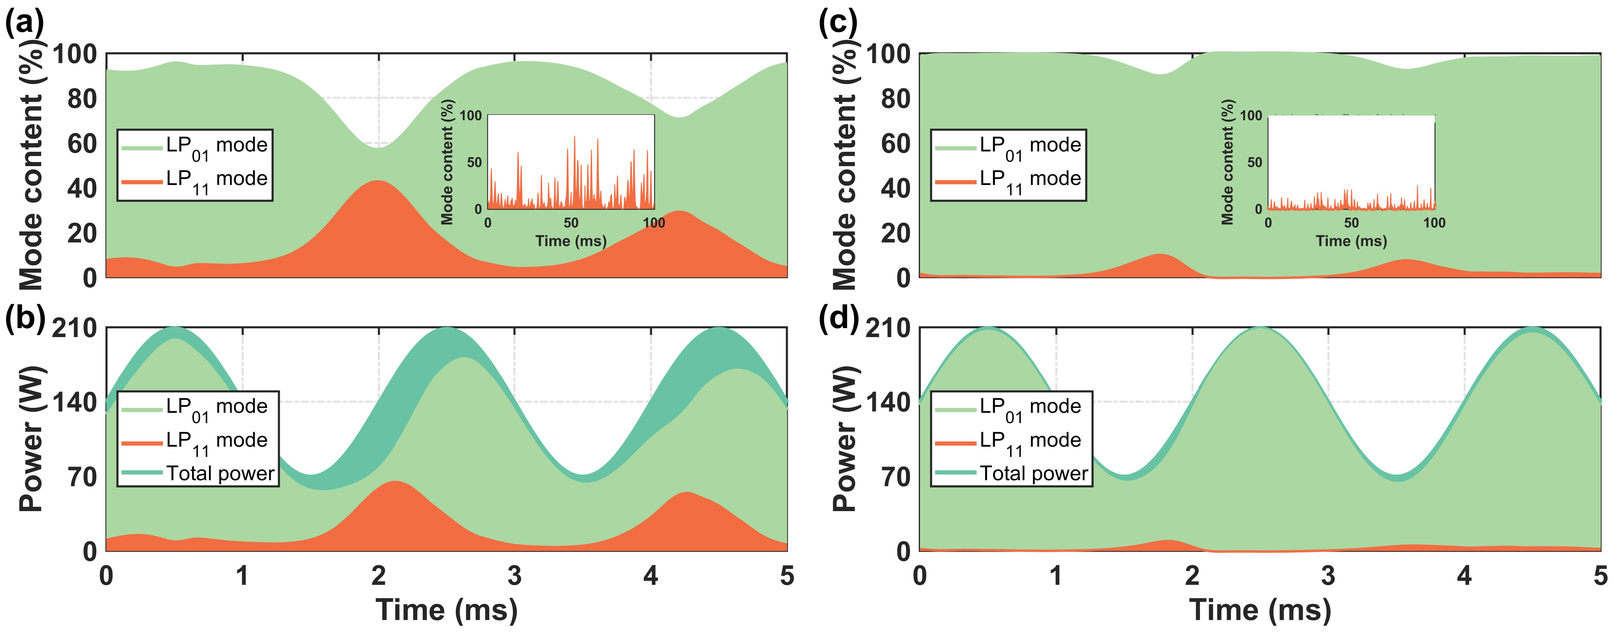
The TMI threshold is defined as the average output power at which the HOM power reaches 1% of the total output. Without modulation, the TMI threshold is calculated to be 126 W, and this value is unaffected by the inclusion of the SPM effect. With the gain fiber length set to 1.6 m, the average output power reaches approximately 139 W, exceeding the CW TMI threshold. This operating condition allows for investigation of modulation-induced stabilization mechanisms in the unstable regime. Figure 2 shows the simulated real-time output power and modal content evolution under sinusoidal wave modulation. As illustrated in Figures 2(a) and 2(b), without considering the SPM effect, a significant HOM component appears in the output beam, with an average power fraction of approximately 15%. Besides, it is observed that the HOM power positively correlates with the total output power, indicating that mode coupling preferentially occurs when the output power exceeds the TMI threshold. This result, however, contradicts experimental observations where signal modulation elevates the TMI threshold and coupling predominantly occurs during the falling edge of the power cycle[ Reference Stihler, Jauregui, Tünnermann and Limpert 24 ]. This behavior is not captured by simulations neglecting the SPM effect, resulting in a noticeable discrepancy between simulation results and experimental phenomena. In contrast, when the SPM effect is included, as shown in Figures 2(c) and 2(d), no significant HOM content is observed under the same average power. The average power fraction of the HOM remains below 3%, which is considerably lower than the result obtained without considering the SPM effect. Crucially, the simulation now reproduces the experimentally observed anomalous TMI behavior: HOM power is suppressed at the power peaks and intensifies during the valleys, showing a distinct inverse correlation with the FM and total power. These results confirm that incorporating SPM is essential for accurately modeling the asymmetric dynamics of TMI under power modulation and explains the increased average power threshold.
Temporal evolution of output power and modal content under sinusoidal modulation (500 Hz, 50% depth). (a), (b) Without SPM, strong HOM growth occurs near power peaks, inconsistent with experiments. (c), (d) With SPM, HOM is suppressed at peaks but rises at valleys, matching experimental observations and demonstrating SPM-mediated stabilization.

Figure 2 Long description
The figure consists of four panels labeled a through d.
Panel a shows Mode content percent versus Time in milliseconds from 0 to 5. A stacked area plot displays L P sub 0 1 mode in green and L P sub 1 1 mode in orange. Without S P M, the orange L P sub 1 1 mode grows significantly to nearly 40 percent at the power peaks around 2 and 4 milliseconds. An inset graph shows high-frequency fluctuations of mode content from 0 to 100 milliseconds.
Panel b shows Power in Watts versus Time. The total power, indicated by a teal line, oscillates sinusoidally between 70 and 210 Watts. The stacked areas show that the L P sub 1 1 mode (orange) contributes a large portion of the total power during the peaks.
Panel c displays the same axes as panel a but with S P M included. The green L P sub 0 1 mode remains dominant, near 100 percent, throughout the cycle. The orange L P sub 1 1 mode is suppressed at the power peaks but shows minor increases at the power valleys. The inset graph shows significantly reduced fluctuations compared to panel a.
Panel d shows Power versus Time with S P M. The total power follows the same sinusoidal curve as panel b, but the orange area representing L P sub 1 1 mode is nearly flat and minimal across the entire time domain, indicating stabilization of the fundamental mode.
To understand the physical origin of this anomalous TMI behavior, we analyze the real-time evolution of the MIP and the thermally induced RIG over a 10 ms operational period (see Visualizations 1 and 2). According to the frequency-shift theory, intermodal energy coupling in TMI occurs between the FM and HOM with a Stokes frequency shift. This implies that both the MIP and RIG are expected to propagate in the direction opposite to the laser beam. This backward propagation is consistent with the wave behavior observed in the visualizations. In the absence of SPM (Visualization 1), the MIP and RIG propagate with stable periodicity and a nearly constant relative spatial phase, indicating consistent intermodal energy coupling. Conversely, with SPM included (Visualization 2), the periodicity of both gratings is disrupted. While the net motion remains counter-propagating, intermittent co-propagating movement and disordered relative positioning are observed. The observed disruption of MIP and RIG coherence is fully consistent with the theoretical framework outlined earlier. This disruption arises because SPM introduces a power-dependent phase shift, causing the formation of successive MIPs with varying beat lengths. The spatial interference between these MIPs and the RIGs they generate creates a complex, aperiodic composite grating that frustrates efficient, sustained energy transfer to HOMs, thereby suppressing TMI.
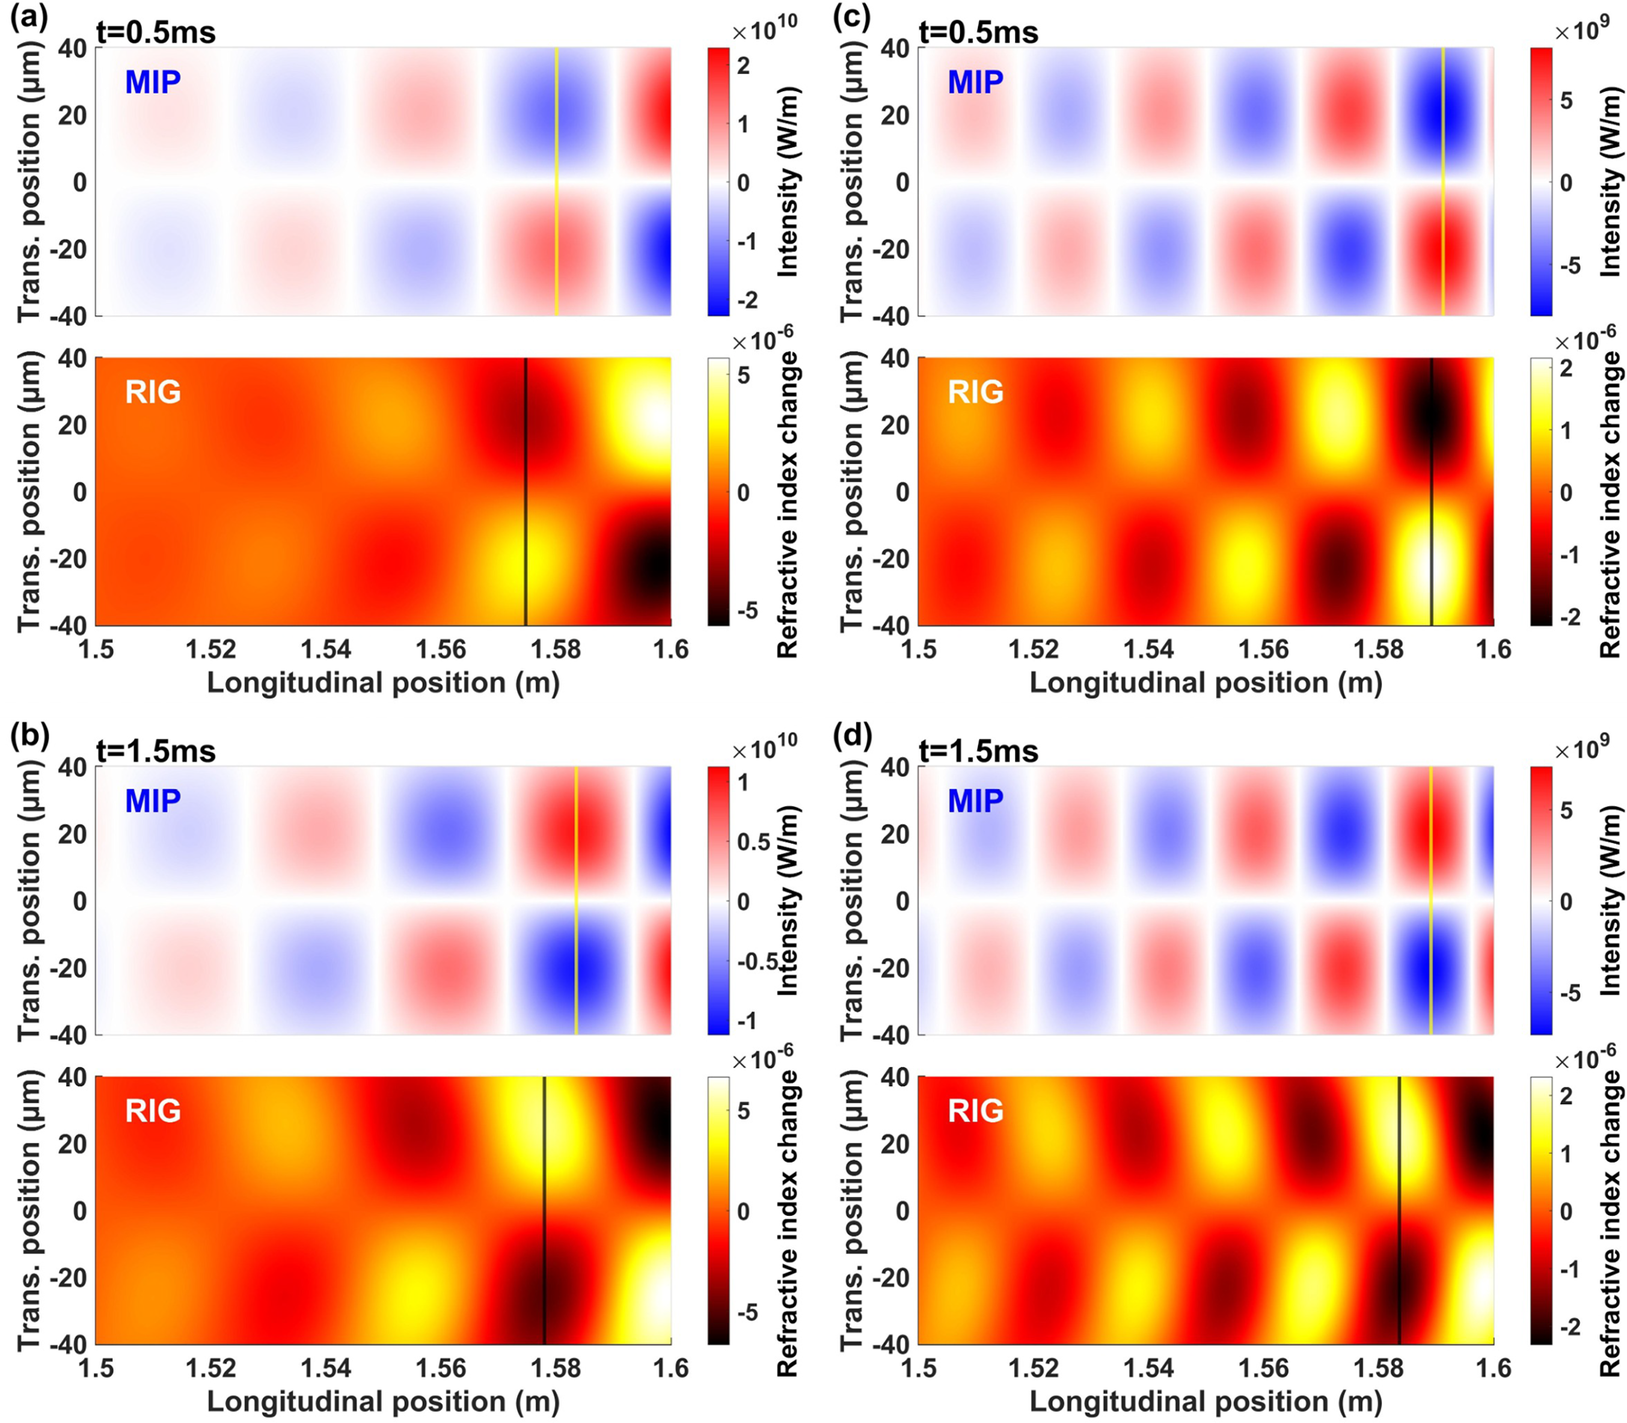
To further elucidate the differences in mode coupling dynamic between the peak and valley stages of the output power, the spatial distributions of the MIP and RIG at
$t$
 = 0.5 ms (peak) and
$t$
 = 1.5 ms (valley) are extracted from Visualizations 1 and 2, as shown in Figure 3. Without SPM (Figures 3(a) and 3(b)), the relative positions are nearly identical at both instances. With SPM (Figures 3(c) and 3(d)), a significant dynamic shift is evident: the MIP and RIG are closely aligned at the power peak (smaller phase shift), whereas they are more separated at the valley (larger phase shift). In general, the intermodal coupling strength exhibits a nonlinear relationship with the phase shift. Specifically, a positive correlation exists when the phase shift falls within the range from 0 to
$\pi /2$
 , where a larger phase shift leads to stronger coupling. Although Figure 3 indicates that the phase shift between the MIP and RIG is larger at the valley moment than at the peak moment, the exact values of these phase shifts still need to be quantitatively determined.
Temporal evolution of the relative positions of the MIP and RIG at different time points, comparing cases with and without the SPM effect: (a)
$t$
 = 0.5 ms and (b)
$t$
 = 1.5 ms without SPM effect; (c)
$t$
 = 0.5 ms and (d)
$t$
 = 1.5 ms with SPM effect. Yellow line, MIP peak position; black line, RIG peak position.

Figure 3 Long description
The figure consists of four quadrants labeled a through d. Each quadrant contains two vertically stacked heat maps. The top map in each set shows M I P intensity in Watts per meter, and the bottom map shows R I G refractive index change. All maps share an x-axis of Longitudinal position in meters from 1.5 to 1.6 and a y-axis of Transverse position in micrometers from negative 40 to 40.
* Panel a: At t equals 0.5 milliseconds without S P M effect. The M I P peak, marked by a yellow vertical line, is at approximately 1.58 meters. The R I G peak, marked by a black vertical line, is slightly behind at 1.575 meters.
* Panel b: At t equals 1.5 milliseconds without S P M effect. The M I P yellow line remains at 1.58 meters, while the R I G black line has shifted slightly forward to approximately 1.578 meters.
* Panel c: At t equals 0.5 milliseconds with S P M effect. The M I P yellow line is at 1.59 meters. The R I G black line is aligned very closely at 1.589 meters. The intensity and refractive index patterns show higher spatial frequency oscillations compared to the non-S P M cases.
* Panel d: At t equals 1.5 milliseconds with S P M effect. The M I P yellow line is at 1.59 meters. The R I G black line has shifted slightly backward to approximately 1.584 meters.
In all panels, the M I P intensity maps use a blue-white-red color scale, and the R I G refractive index change maps use a black-red-yellow-white color scale. The S P M effect cases in c and d show significantly more complex, periodic wave structures than the cases in a and b.
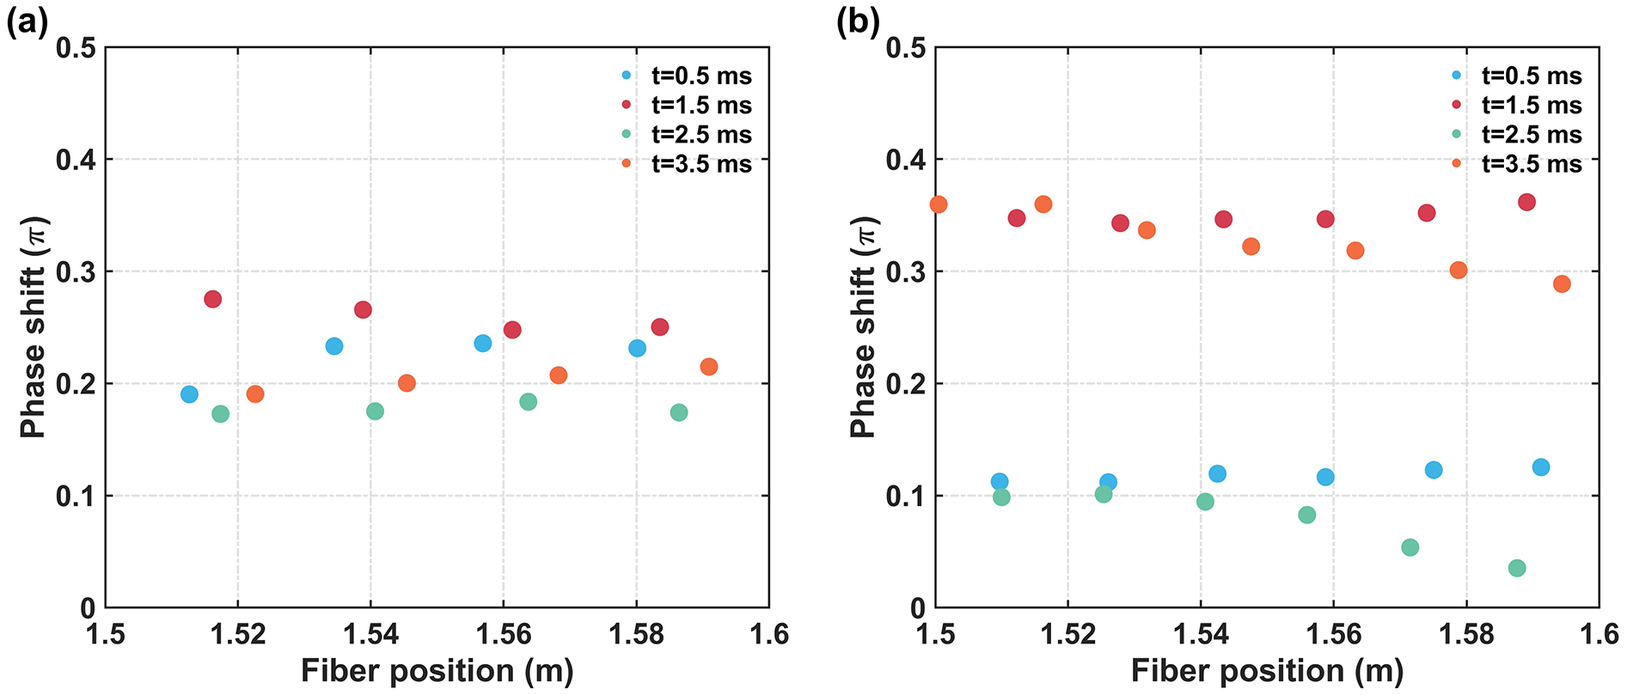
Figure 4 summarizes the temporal evolution of the phase shift between the MIP and RIG. Without SPM (Figure 4(a)), the phase shift remains stable at approximately
$0.2\pi$
 . In this scenario, coupling strength is dictated primarily by the RIG intensity, which scales with laser power, thus promoting TMI at power peaks. With SPM (Figure 4(b)), the phase shift dynamically varies, reaching significantly larger values at the power valleys (
$t$
 = 1.5, 3.5 ms) than at the peaks (
$t$
 = 0.5, 2.5 ms). This larger phase shift during the valleys enhances the coupling efficiency, overriding the effect of the weaker RIG and explaining the intensified HOM generation at lower power levels.
Phase shift evolution between the MIP and RIG: (a) without SPM; (b) with SPM.

Figure 4 Long description
A two-panel scatter plot. Both panels share identical axes: the horizontal x-axis represents Fiber position in meters ranging from 1.5 to 1.6, and the vertical y-axis represents Phase shift in units of pi ranging from 0 to 0.5. Each plot contains four data series: t equals 0.5 m s (blue), t equals 1.5 m s (red), t equals 2.5 m s (green), and t equals 3.5 m s (orange).
* Panel a, labeled without S P M: The data points for all four time intervals are clustered together between 0.15 and 0.3 pi. There is no clear vertical separation between the different time series, and the values fluctuate randomly across the fiber position.
* Panel b, labeled with S P M: The data shows a distinct vertical bifurcation. The t equals 0.5 m s (blue) and t equals 2.5 m s (green) series are grouped at the bottom of the plot, generally below 0.15 pi. Conversely, the t equals 1.5 m s (red) and t equals 3.5 m s (orange) series are grouped at the top of the plot, fluctuating between 0.3 and 0.4 pi. This indicates a significant phase shift increase for specific time intervals when S P M is present.
This periodic variation in phase shift is driven by SPM-induced changes in the MIP beat length. At high power (peaks), strong SPM shortens the MIP beat length relative to the RIG, reducing their spatial separation and thus the phase shift. At low power (valleys), the weaker SPM effect allows the MIP beat length to stretch, increasing the phase shift relative to the RIG. This physical insight suggests that TMI suppression can be optimized by engineering the modulation parameters. Therefore, in the parameter design for signal modulation, efforts should be made to avoid scenarios where the MIP beat length exceeds that of the RIG. For example, employing a rectangular wave modulation could maintain a less favorable phase-matching condition throughout the cycle, thereby improving system stability and output quality.
4 Modulation parameters and transverse mode instability threshold
The previous section demonstrated the effectiveness of SPM in suppressing TMI through temporal modulation. This section investigates the influence of key modulation parameters, including the duty ratio, modulation frequency, waveform and depth, on the TMI threshold.
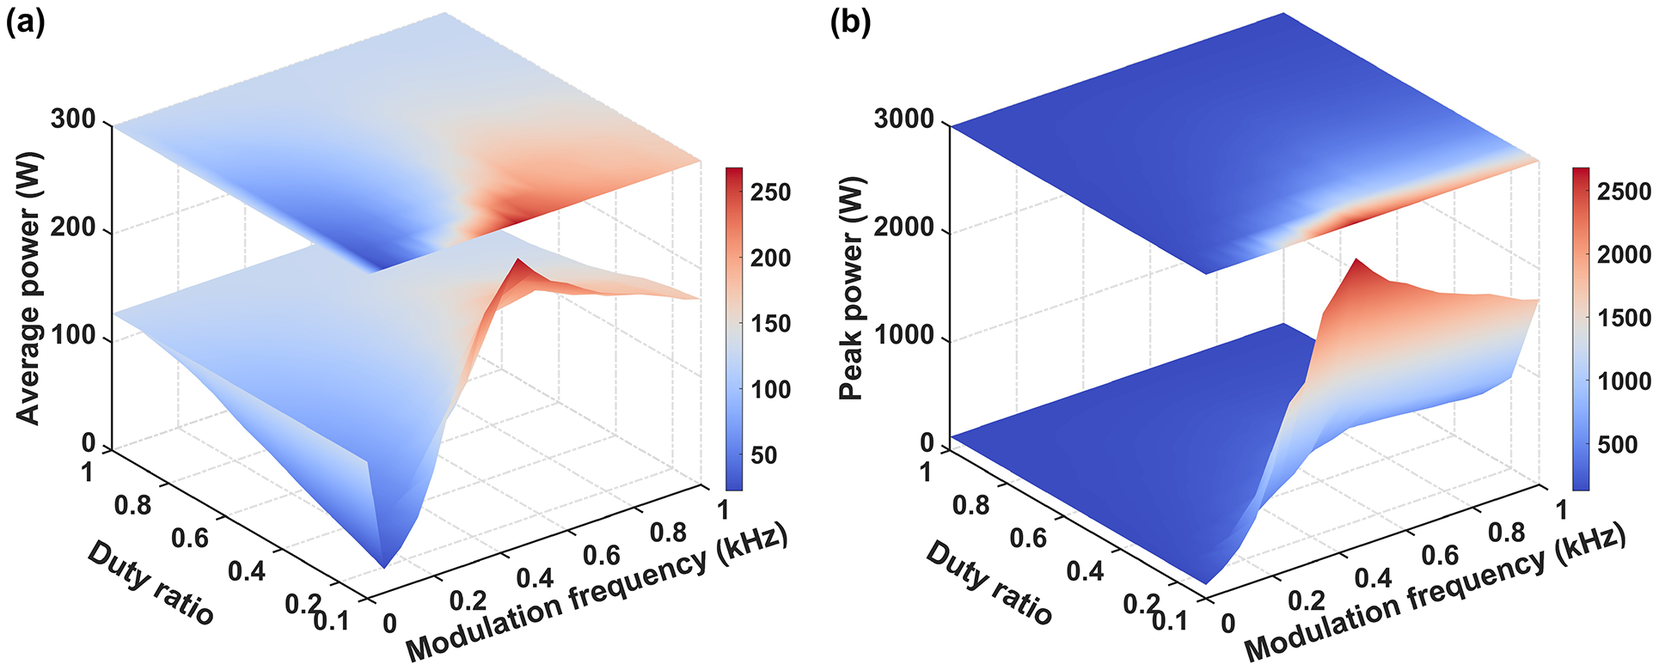
Taking a rectangular wave signal as an example, with duty ratios ranging from 0.1 to 1 and modulation frequencies from 0 to 1000 Hz, Figure 5 shows the average power and peak power of the TMI threshold under different duty ratios and modulation frequencies. At high modulation frequencies (typically
$>$
 750 Hz), both the average and peak power TMI thresholds increase as the duty ratio decreases. However, at low frequencies, this trend inverts for the average power threshold. This inversion occurs because when the modulation period is long, TMI can be triggered within a single high-power pulse, making peak power the more relevant metric for the TMI threshold. In the peak power regime, a smaller duty ratio corresponds to a faster-changing signal, which is more effective at suppressing TMI. Regarding modulation frequency, the TMI threshold first increases and then decreases, revealing an optimal frequency for TMI suppression. At very high frequencies, the thermal effects that drive SPM cannot respond to the rapid power fluctuations, causing the TMI threshold to regress toward the unmodulated CW value. This observation also agrees with experimental phenomena[
Reference Kholaif, Jauregui and Limpert
20
]. To gain deeper insights into the underlying physical mechanisms, we can assess the impact of the duty ratio and modulation frequency on the TMI threshold using the variation in SPM-induced dispersion intensity. The greater the variation in dispersion intensity, the higher the TMI threshold. The spectral representation of dispersion intensity can be expressed as follows:


Effect of duty ratio and modulation frequency on the TMI threshold: (a) average power and (b) peak power.

Figure 5 Long description
Two panels labeled a and b.
Panel a displays Average power in Watts on the vertical z-axis ranging from 0 to 300. The x-axis represents Modulation frequency in k H z from 0 to 1.0. The y-axis represents Duty ratio from 0.1 to 1. A color bar on the right scales from 50 in blue to 250 in red. The plot features two stacked surfaces. The lower surface shows a sharp peak in average power reaching approximately 250 Watts at a modulation frequency of 0.6 k H z and a low duty ratio. The upper surface is a projection showing a similar heat map where red intensity concentrates at the same coordinates.
Panel b displays Peak power in Watts on the vertical z-axis ranging from 0 to 3000. The x and y axes remain Modulation frequency and Duty ratio with the same scales as panel a. The color bar scales from 500 in blue to 2500 in red. The lower surface shows a dramatic rise in peak power as the duty ratio decreases, specifically peaking near 2500 Watts at a modulation frequency of 0.6 k H z. The upper projection surface mirrors this trend with a distinct red band at the low duty ratio and mid-range frequency region.
where
${\tau}_\mathrm{T}$
 is the thermal diffusion time;
$\eta$
 is the duty ratio and
${f}_\mathrm{M}$
 is the modulation frequency. Since the heat diffusion equation acts as a low-pass filter, it links the thermal spectrum to the dispersion strength. A smaller duty ratio increases the density of non-zero frequency components in the thermal spectrum, leading to stronger variations in SPM-induced dispersion and thus a higher TMI threshold. Conversely, as the modulation frequency
${f}_\mathrm{M}$
 increases, the low-pass filtering effect attenuates these beneficial high-frequency components, reducing the efficacy of the modulation and causing the TMI threshold to decrease from its optimum.
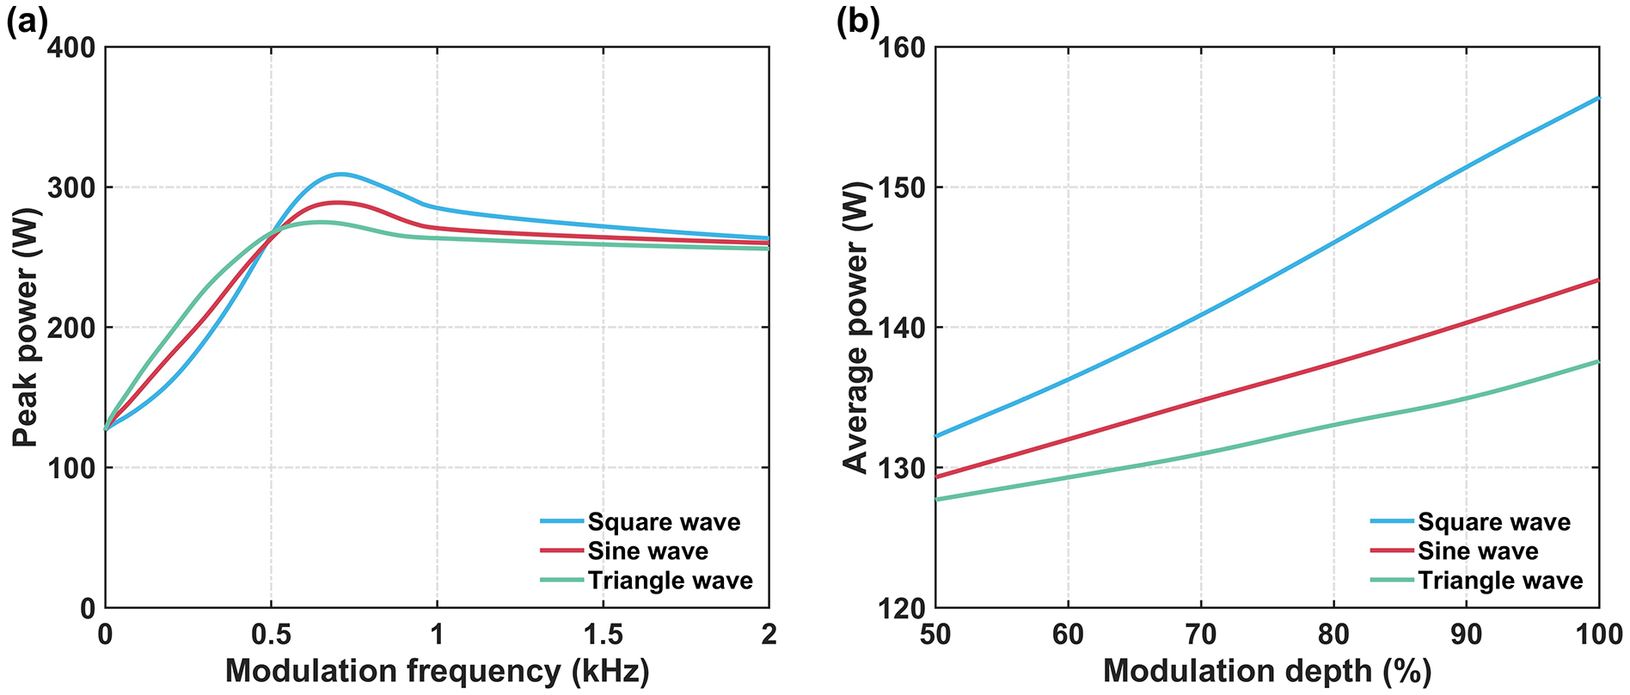
The choice of modulation waveform is also critical. Since SPM-induced phase shift modulation makes intermodal coupling more probable during power valleys, a rectangular wave, which minimizes energy in the valley region, is expected to offer superior TMI suppression. Figure 6(a) presents the simulated peak power TMI thresholds for rectangular, sinusoidal and triangular waveforms at a fixed 0.5 duty ratio. Below 500 Hz, the TMI threshold is primarily determined by the peak power duration; the triangular wave, having the least energy concentrated at its peak, exhibits the highest threshold. Above 500 Hz, the SPM mechanism dominates. Here, the rectangular wave, with the lowest power in the critical valley region, achieves the highest TMI threshold and the triangular waveform yields the lowest. This behavior is quantitatively supported by the spectral density of the dispersion strength at the fundamental modulation frequency, which for rectangular, sinusoidal and triangular waves follows the ratio: sinc(0.5):0.5:sinc2(0.5) = 1:0.79:0.64. This indicates that the rectangular waveform induces the most significant variation in SPM-dispersion strength, while the triangular waveform has the weakest effect. Therefore, among the three modulation waveforms, the rectangular waveform is the most effective in suppressing TMI, followed by the sinusoidal and then the triangular waveform. Our findings show a slight discrepancy from the experimental results reported by Chai et al. [ Reference Chai, Liu, Wang, Zhou, Zhang, Zhang, Liu, Lu, Zhang, Jiang and Zhao 19 ], where a triangular wave seemingly outperformed a sinusoidal wave. Analysis of their data reveals inconsistencies in the pump current modulation depth across different waveforms (specifically, the triangular wave exhibits a higher modulation depth than the sinusoidal wave). Given that modulation depth is a critical variable governing the TMI threshold, this parametric inconsistency is highly likely the root cause of the deviation between our simulation and their experimental results. As shown in Figure 6(b), the TMI threshold is highly sensitive to modulation depth. The discrepancy in their results can be attributed to a significantly lower modulation depth for the sinusoidal signal. Therefore, optimizing TMI suppression requires careful selection of not only the waveform but also the modulation depth.
Impact of (a) modulation frequency and (b) modulation depth on the TMI threshold under three modulation waveforms. In (a), the duty ratio is fixed at 0.5 and the modulation depth is 100%. In (b), the modulation frequency is set to 700 Hz.

Figure 6 Long description
Two line graphs labeled a and b.
Panel a is a line graph showing Peak power in Watts on the y axis from 0 to 400 versus Modulation frequency in k H z on the x axis from 0 to 2. Three curves represent different waveforms. All curves start at approximately 130 Watts at 0 k H z. They show a steep increase, peaking between 0.5 and 1.0 k H z, before slightly declining and plateauing. The Square wave (blue) reaches the highest peak at approximately 310 Watts. The Sine wave (red) peaks at approximately 290 Watts. The Triangle wave (green) has the lowest peak at approximately 275 Watts. By 2 k H z, all three converge near 260 Watts.
Panel b is a line graph showing Average power in Watts on the y axis from 120 to 160 versus Modulation depth in percent on the x axis from 50 to 100. All three waveforms show a positive linear trend. The Square wave (blue) is the uppermost line, rising from 132 Watts at 50 percent to approximately 157 Watts at 100 percent. The Sine wave (red) is the middle line, rising from 129 Watts to 143 Watts. The Triangle wave (green) is the bottom line, rising from 128 Watts to 138 Watts.
5 Fiber parameters and transverse mode instability threshold
Following the analysis of modulation parameters, this section investigates the impact of fiber design on the efficacy of temporal modulation, focusing on the fiber length, core diameter and V-parameter.
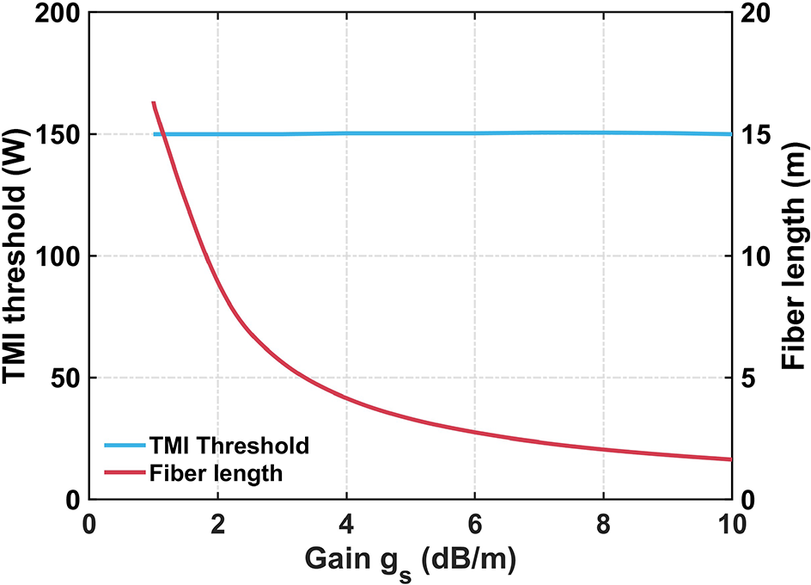
Firstly, the effect of fiber length on the TMI threshold is analyzed by varying the doping concentration. The modulation frequency and duty ratio are fixed at 800 Hz and 0.5, respectively, with the gain coefficient ranging from 1 to 10 dB/m. According to the experimental results of Tao et al.
[
Reference Tao, Ma, Wang, Zhou and Liu
37
], adjusting the fiber length by varying the doping concentration does not affect the TMI threshold of CW lasers. Subsequent simulation results indicate that QCW lasers exhibit a similar phenomenon. As shown in Figure 7, increasing the gain coefficient leads to a continuous reduction in the required fiber length, while the TMI threshold remains nearly unchanged. The mechanism underlying TMI suppression via temporal modulation is the dispersion induced by the SPM effect. The accumulated dispersion over the entire fiber length, quantified by the dispersion integral
$B$
 , can be expressed as follows:

TMI threshold (average power) as a function of fiber length under varying gain coefficients, with the modulation frequency and duty ratio fixed at 800 Hz and 0.5, respectively.

Figure 7 Long description
The horizontal X axis represents Gain g sub s in d B forward slash m, ranging from 0 to 10. The primary vertical Y axis on the left represents T M I threshold in Watts, ranging from 0 to 200. The secondary vertical Y axis on the right represents Fiber length in meters, ranging from 0 to 20.
Two data series are plotted:
* T M I Threshold is represented by a horizontal blue line. It remains constant at approximately 150 Watts across the entire gain range from 1 to 10 d B forward slash m.
* Fiber length is represented by a red curve. It starts at approximately 16 meters when gain is 1 d B forward slash m and follows an asymptotic decay curve, dropping sharply before leveling off toward 2 meters as gain approaches 10 d B forward slash m.
A legend in the bottom left quadrant identifies the blue line as T M I Threshold and the red line as Fiber length.
The dispersion integral
$B$
 resulting from the SPM effect stems from thermal effects. Given a constant total thermal load, variations in fiber length do not influence the total dispersion induced by the SPM effect, thereby leaving the TMI threshold unaffected. Despite the absence of experimental studies directly linking fiber length to TMI suppression through temporal modulation, both rod-type fibers of approximately 1 m in length and step-index fibers extending to tens of meters have exhibited substantial potential for TMI suppression using temporal modulation[
Reference Kholaif, Jauregui and Limpert
20
, Reference Chai, Liu, Wang, Zhou, Zhang, Liu, Zhang, Lu, Zhang, Jiang and Zhao
28
]. These results lend indirect support to the notion that the signal modulation’s efficacy in TMI suppression is independent of fiber length, reinforcing the findings of this section with robust experimental evidence.
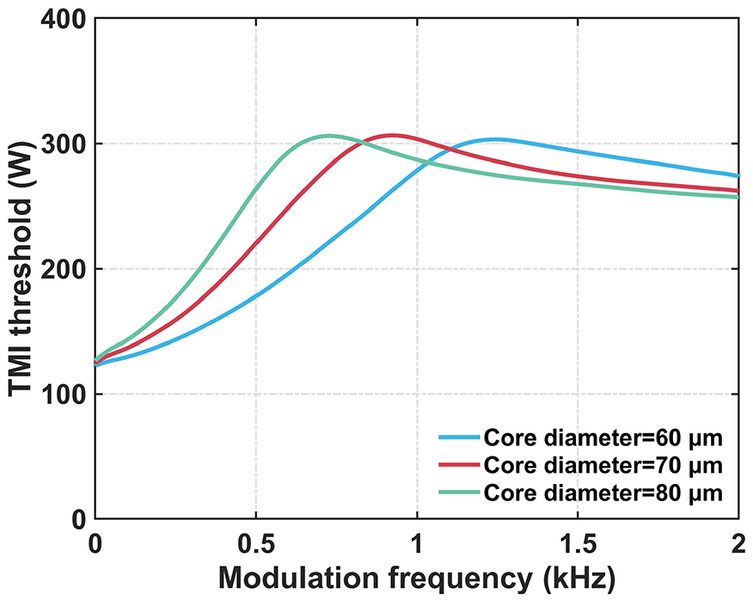
Secondly, we investigate the effect of the core diameter while maintaining a constant V-parameter of 3. As seen in Figure 8, while the maximum TMI threshold is similar for different core diameters (as their CW thresholds are nearly identical[ Reference Hansen, Alkeskjold, Broeng and Lægsgaard 38 ]), the optimal modulation frequency shifts significantly. For core diameters of 60, 70 and 80 μm, the optimal frequencies are 1200, 900 and 700 Hz, respectively. These frequencies are approximately twice the characteristic TMI frequencies of the corresponding fibers under CW operation (610, 450 and 340 Hz). This reveals a critical design rule: the optimal modulation frequency should be increased for fibers with smaller core diameters.
TMI threshold (peak power) as a function of modulation frequency for three core diameters, with the duty ratio fixed at 0.5 and V-parameter maintained at 3.

Figure 8 Long description
The horizontal x-axis represents Modulation frequency in k H z, ranging from 0 to 2 with major ticks every 0.5. The vertical y-axis represents T M I threshold in Watts, ranging from 0 to 400 with major ticks every 100. Three curves are plotted, each representing a different core diameter.
* The green curve for Core diameter equals 80 micrometers starts at approximately 130 Watts, rises sharply to a peak of about 310 Watts at 0.7 k H z, and then gradually declines toward 260 Watts.
* The red curve for Core diameter equals 70 micrometers starts at the same point, rises to a peak of about 310 Watts at 0.9 k H z, and then gradually declines toward 265 Watts.
* The blue curve for Core diameter equals 60 micrometers starts at the same point, rises more gradually to a peak of about 305 Watts at 1.3 k H z, and then declines toward 275 Watts.
As core diameter increases, the peak T M I threshold occurs at lower modulation frequencies. All three curves converge toward a similar threshold value as the frequency approaches 2 k H z.
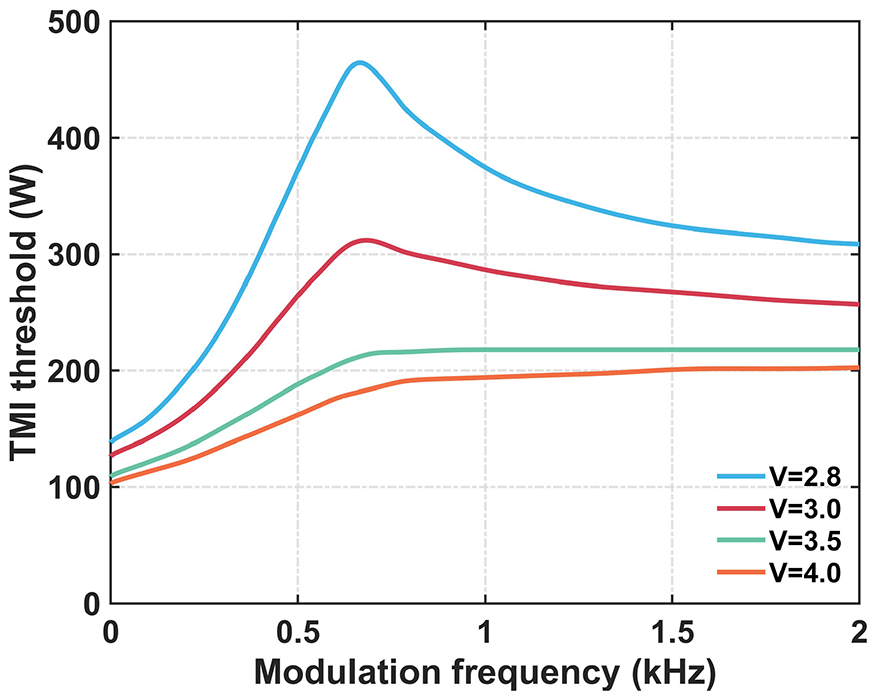
Finally, the influence of the core V-parameter on temporal modulation is analyzed. The mechanism by which the V-parameter affects the TMI threshold in CW fiber lasers has been well established in previous studies[ Reference Li, Huang, Wu, Wang and Zhou 39 ]. The V-parameter determines the overlap between transverse modes and the core region: a smaller V-value leads to reduced mode–core overlap. By decreasing the V-parameter, the HOM–core overlap is reduced, weakening the RIG strength and thereby increasing the TMI threshold. This baseline advantage carries over to the modulated case (Figure 9). Furthermore, according to Equations (10) and (11), reducing the V-parameter enhances the dispersion difference between the FM and HOM, thereby strengthening the SPM-induced modulation effect on the MIP beat length. Consequently, the TMI threshold under the optimal modulation frequency continues to increase. This suggests a clear design strategy: selecting gain fibers with a smaller V-parameter (e.g., via a lower numerical aperture (NA) design) maximizes the TMI suppression capability of the temporal modulation technique.
TMI threshold (peak power) as a function of modulation frequency for different V-parameters, with the duty ratio fixed at 0.5.

Figure 9 Long description
The horizontal X-axis represents Modulation frequency in k H z ranging from 0 to 2. The vertical Y-axis represents T M I threshold in Watts ranging from 0 to 500. Four curves are plotted for different V-parameters.
* V equals 2.8 blue line. Starts at approximately 140 Watts at 0 k H z, rises sharply to a peak of roughly 460 Watts at 0.7 k H z, and then decays asymptotically toward 310 Watts at 2 k H z.
* V equals 3.0 red line. Starts at 125 Watts, peaks at approximately 310 Watts at 0.7 k H z, and gradually decreases to 260 Watts.
* V equals 3.5 green line. Starts at 110 Watts, rises to a plateau of approximately 220 Watts starting at 0.8 k H z, remaining nearly flat through 2 k H z.
* V equals 4.0 orange line. Starts at 105 Watts, rises steadily to a plateau of approximately 200 Watts by 1.2 k H z.
Overall, lower V-parameters result in higher T M I thresholds and more pronounced peaks at low modulation frequencies.
Notably, the preceding analysis of fiber-parameter influences on temporal-modulation-based TMI suppression was conducted under the assumption of negligible gain saturation. Consequently, these conclusions are particularly well-suited for the large-core-cladding-ratio LPF amplifiers discussed herein. However, for typical large-mode-area step-index fibers (e.g., 20/400 and 30/400 μm), gain saturation effects are non-negligible. While gain saturation attenuates the strength of the RIG, enhanced saturation can improve the TMI threshold. Furthermore, higher output power exacerbates thermal load and SPM, which may amplify the efficacy of temporal modulation in suppressing TMI.
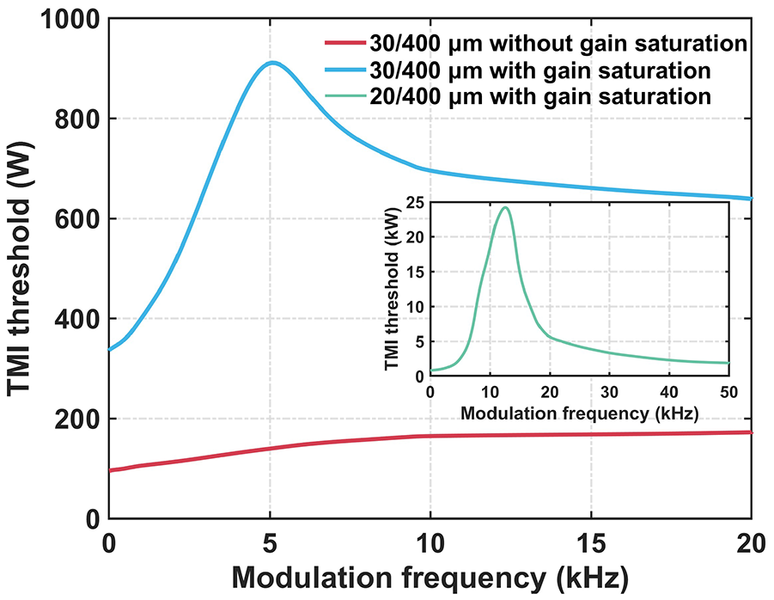
As shown in Figure 10, without considering gain saturation, the TMI threshold (peak power) for the 30/400 μm fiber with NA of 0.06 (V-parameter
$\sim$
 5.24) gradually increases with rising modulation frequency and eventually saturates at twice the CW laser TMI threshold due to the 0.5 duty ratio and 100% modulation depth. Here, the suppressive effect of SPM is scarcely observable. This aligns with the conclusion drawn from Figure 9: a larger V-parameter results in a smaller disparity in thermal load projection between the FM and HOM, thereby diminishing the SPM suppression effect. When considering gain saturation, the CW laser TMI threshold of the 30/400 μm fiber rises significantly from 96 to 336 W. As the modulation frequency increases, the TMI threshold (peak power) first increases, then gradually decreases, and finally stabilizes at twice the CW laser TMI threshold. Notably, at the optimal modulation frequency of approximately 5 kHz, the peak power reaches up to 945 W, with an average power of 472.5 W, which is 1.41 times the CW laser TMI threshold. This demonstrates that, through the amplifying mechanism of gain saturation, temporal modulation can be effectively applied to typical step-index fibers, playing a pivotal role in overcoming the TMI effect and achieving higher output power.
TMI threshold (peak power) as a function of modulation frequency for typical large-mode-area step-index fibers (NA = 0.06, duty ratio fixed at 0.5).

Figure 10 Long description
The main graph features a horizontal x-axis labeled Modulation frequency in k H z ranging from 0 to 20 and a vertical y-axis labeled T M I threshold in W ranging from 0 to 1000.
Two primary data series are shown in the main plot area.
- A red line representing 30 forward slash 400 micrometer without gain saturation starts at approximately 100 W and shows a slow, nearly linear increase to just under 200 W at 20 k H z.
- A blue line representing 30 forward slash 400 micrometer with gain saturation starts at approximately 340 W, rises sharply to a peak of about 910 W at 5 k H z, and then gradually decays toward 630 W at 20 k H z.
An inset graph is positioned in the middle-right quadrant. Its x-axis is Modulation frequency in k H z from 0 to 50 and its y-axis is T M I threshold in k W from 0 to 25.
- A green line representing 20 forward slash 400 micrometer with gain saturation shows a very sharp peak of approximately 24 k W at a modulation frequency of roughly 12.5 k H z, with values near zero at the 0 and 50 k H z extremes.
In addition, the 20/400 μm step-index fiber features a smaller core diameter, a stronger gain saturation effect and a lower V-parameter of 3.49 at the same NA, compared with the 30/400 μm counterpart. Consequently, its CW laser TMI threshold increases to 789 W (bending losses are neglected here). Physically, the strong gain saturation elevates the CW laser TMI threshold. A higher threshold permits greater output power and concurrently induces a higher heat load. Meanwhile, a lower V-parameter further amplifies the disparity in heat load projection between the FM and HOM. The combined effect of strong gain saturation and a low V-parameter implies that the SPM effect exerts a more potent TMI suppression during temporal modulation. This mechanism enables a significant TMI threshold (peak power) of 25.8 kW at the optimal modulation frequency of approximately 13 kHz, corresponding to an average power 16.4 times that of the CW laser TMI threshold. Although the 20/400 μm fiber is more susceptible to stimulated Raman scattering (SRS) at high-power fiber lasers[ Reference Ma, Yao, Liu, Pan, Chen, Yang, Chen, Wang, Zhou and Chen 40 ], which limits the full demonstration of the TMI suppression performance of temporal modulation, the simulation results still reveal the great potential of temporal modulation for large-mode-area step-index fibers with strong gain saturation. Therefore, leveraging the amplification effect of gain saturation on TMI suppression via temporal modulation, co-optimizing the modulation and fiber parameters while balancing SRS and TMI effects, offers a viable pathway to break through the power limits of high-power fiber lasers.
6 Conclusion
In summary, we have developed a comprehensive theoretical model that unifies the understanding of TMI in fiber lasers under temporal modulation, bridging the gap between CW and pulsed operation regimes. The work identifies SPM as the dominant mechanism for TMI suppression. Power-dependent SPM dynamically alters the beat length of the MIP, generating a rapidly fluctuating and chaotic thermal RIG. This disordered grating disrupts the phase-matching condition required for coherent energy transfer from the FM to HOMs. Real-time tracking of the spatial evolution of both the MIP and the thermally induced RIG reveals an asymmetric coupling dynamic: intermodal energy transfer is suppressed near power peaks and enhanced during power valleys. This behavior provides a clear physical explanation for the experimentally observed TMI characteristics under temporal modulation. Guided by this insight, we systematically examine the influence of key modulation parameters, including the duty ratio, frequency, waveform shape and depth, on the TMI threshold and establish optimal regimes for effective mitigation. From the perspective of fiber design, the impact of geometric parameters, such as fiber length, core diameter and V-number, is quantitatively evaluated. The TMI suppression efficacy remains largely independent of fiber length, improves with reduced V-number and shifts toward higher optimal modulation frequencies for smaller core diameters. These findings collectively deliver a predictive and design-oriented framework for next-generation high-power fiber laser systems. By leveraging intrinsic nonlinearities through tailored temporal waveforms, this approach enables scalable power scaling with diffraction-limited beam quality, offering a clear and practical pathway to overcome the long-standing TMI bottleneck.
Acknowledgements
This work was supported by the National Key Research and Development Program of China (Grant No. 2022YFB3606000), the National Natural Science Foundation of China (Grant No. 62305390), the Distinguished Young Scholars of Hunan Province (Grant No. 2023JJ10057) and the Training Program for Excellent Young Innovators of Changsha (Grant No. kq2206006).
Supplementary material
To view supplementary material for this article, please visit http://doi.org/10.1017/hpl.2026.10158.




 Open access

