


Epidemiological studies have reported a positive association between the intakes of finfish and other seafoods and a lower risk of several diseases, including CVD and some neurological disorders(Reference Barberger-Gateau, Letenneur and Deschamps1–Reference Shekelle, Missell and Paul10). Fish is a major source of the n-3 fatty acid DHA, which is a precursor of proresolving anti-inflammatory mediators, a ligand for transcription factors that regulate lipid metabolism, and contributes to the regulation of cardiac muscle ion channel activities in addition to other functions(Reference Jump, Botolin and Wang11–Reference Serhan and Chiang13). Furthermore, several studies have reported a positive association between higher intakes of fish during pregnancy and better child neurodevelopment outcome(Reference Boucher, Burden and Muckle14–Reference Oken, Østerdal and Gillman18). However, fish is a source of other nutrients in addition to DHA, raising the possibility that some individuals with low fish intakes may be limiting in other nutrients. Among these nutrients, vitamin D is particularly relevant since fish is one of the few natural food sources of this vitamin. Increased risk of poor vitamin D status has been documented among pregnant women in northern latitudes, with the risk of deficiency modified by season and race, regardless of current food fortification and other vitamin D supplementation strategies(Reference Bodnar and Simhan19–Reference Waiters, Godel and Basu24). Importantly, maternal blood levels of 25-hydroxyvitamin D (25(OH)D) in gestation are positively correlated with blood levels of 25(OH)D in the newborn(Reference Fleischman, Rosen and Cole25), raising the possibility that maternal vitamin D insufficiency might adversely have an impact on child development. In this regard, recent studies have shown that vitamin D, via the vitamin D receptors in the brain, plays key roles in neural development, with functions that include neurite outgrowth, neuro-protective and anti-inflammatory actions, regulation of neuro-trophic factors, and dopaminergic signalling(Reference Eyles, Feron and Cui26–Reference O'Loan, Eyles and Kesby29), all of which are roles in which DHA also functions(Reference Bazan, Musto and Knott30).
Fish is also a rich natural source of choline, which is important in methyl metabolism, membrane phospholipids and sphingolipids, and acetylcholine(Reference Niculescu and Zeisel31, Reference Zeisel and Blusztajn32). Like vitamin D and DHA(Reference Fleischman, Rosen and Cole25, Reference Al, van Houwelingen and Kester33, Reference Elias and Innis34), maternal plasma levels of choline in gestation are positively correlated with plasma choline levels in the newborn(Reference Friesen, Novak and Hasman35). In animals, maternal choline deficiency during critical windows of brain development is known to lead to lasting impairments in neural functioning in offspring(Reference Zeisel and Niculescu36). In the light of the possibility that fish is an important source of several key nutrients important in brain development, the present study assessed whether women in the first half of pregnancy with low compared to higher fish intakes, defined as ≤ 75 g and >150 g fish/week, respectively, have low biomarkers of DHA as well as vitamin D and choline status when assessed using erythrocyte membrane DHA, plasma 25(OH)D and plasma free choline, respectively.
Methods and materials
Subjects
The present study involved 222 healthy pregnant women, 20–40 years of age, with collection of dietary and socio-demographic information and venous blood at 16 weeks of gestation. The subjects and blood samples were derived from baseline measures of pregnant women enrolled in a prospective study designed to assess the possibility that poor maternal DHA status in gestation adversely affects child development. Women following a vegan diet, taking fish oils or other fatty acid supplements, at risk for preterm infant delivery or any complication likely to make an impact on infant growth and development were not included. From the subjects enrolled, only data for pregnant women who subsequently completed a study visit at 36 weeks' gestation were analysed. Thus, this study does not allow for consideration of adverse dietary or other factors sufficient to result in preterm delivery or pregnancy termination before 36 weeks' gestation. The protocol was approved by the Committee for Ethical Review of Research Involving Human Subjects at the University of British Columbia and the British Columbia's Children's and Women's Hospital. All participants provided written informed consent before participation.
Dietary analyses
Information on usual dietary intake over the previous month was collected at 16 weeks' gestation using an interview-administered FFQ which included detailed descriptions of ruminant and non-ruminant meats, fatty and lean fish, shellfish, poultry, dairy products, fats and oils, nuts, seeds, vegetables, grains, processed and other foods(Reference Innis and Elias37, Reference Friesen and Innis38). Information on supplement use was recorded, but no measures for assessing daily intake or use of multiple supplements were included. Thus, supplement data were not used in any of our analyses. Most prenatal vitamins in Canada contain 10 μg vitamin D, while milk is fortified at 1·0–1·3 μg/100 ml, and margarine is fortified at ≥ 1·32 μg/10 g(39). Nutrient intakes from foods were determined for each subject using nutrient data software (FOOD PROCESSOR 10.8.0; Esha Research) with the Canadian nutrient file, updated to include complete data on n-6 and n-3 fatty acids in foods. The intakes of choline from foods were determined as the sum of all water and lipid forms of choline, using the USDA database on choline in foods(40).
Blood samples and analytical methods
Fasting venous blood was collected from each subject in the outpatient laboratory of the British Columbia's Women's and Children's Hospital. The erythrocytes were separated from plasma by centrifugation at 2000 g, 15 min at 4°C, and the buffy coat removed, following which the erythrocytes were washed two times by resuspension in normal saline, and all samples were stored at − 70°C until analysis. For analyses, the erythrocyte total lipids were extracted, then the ethanolamine phospholipids (PE) were separated and the fatty acids analysed by GLC with flame ionisation detection(Reference Innis and Elias37). The proportion of DHA in the erythrocyte PE fatty acids was used as a stable measure of DHA status, since PE is predominantly on the cytosolic surface of the erythrocyte membrane bilayer and is more stable to short-term variations in diet than plasma total lipids or the erythrocyte phosphatidylcholine(Reference Popp-Snijders, Schouten and de Jong41). Plasma free choline was analysed using liquid chromatography–tandem MS as recently described(Reference Innis and Hasman42). Plasma 25(OH)D was analysed with the DiaSorin radioimmunoassay (DiaSorin), which detects 25(OH)D2 and 25(OH)D3 equally.
Statistical analyses
All data were analysed using the SPSS statistical software package for Windows (version 19.0; SPSS, Inc.). The results were checked for normal distributions using the Kolmogorov–Smirnov test. Pearson correlation r and Spearman correlation ρ coefficients, as appropriate, were used to detect significant associations between the intakes of DHA, choline and vitamin D from foods. To address whether fish intake was associated with the intake and biochemical measures of DHA, vitamin D and choline status, we grouped the women by fish (including all finfish and shellfish) as ≤ 75, 76–149 or ≥ 150 g/week. Here, one food guide serving of fish in Canada is 75 g(43). ANOVA followed by Tukey's honest significant difference test was used to detect significant differences in nutrient intakes from foods, and plasma 25(OH)D, plasma free choline, and erythrocyte PE DHA between women grouped by fish intake. Vancouver is at a latitude of 49°16′, with average sunshine of about 64, 56, 60, 85, 134 and 182 h/month for the 6 months of November to April, respectively, and 231, 229, 294, 268, 199 and 125 h/month for the 6 months of May to October, respectively(44). Assuming a half-life of plasma 25(OH)D formed following sunshine exposure of 14 d(Reference Jones45), we defined winter and summer as November–April and May–October, respectively, and then compared plasma 25(OH)D concentrations in blood collected in the two seasons using an independent t test. All P values are based on two-sided tests, with a P< 0·05 considered statistically significant. Values in the text are means unless stated otherwise.
Results
The age of the 222 women in the present study was 32·7 (sd 5·0) years; 73·4 % were Caucasian, 18·5 % of Asian background, 3·1 % of East Indian descent, and the remaining 5·0 % were of other backgrounds. Of these women, nineteen reported that they ate no fish, but did eat meat or poultry, five were lacto-ovo vegetarians and ate no meat, poultry or fish, and one woman ate fish but no meat or poultry. Regardless of the coastal location of Vancouver, 48 % of the women consumed < 150 g/week of fish, and 41 % consumed ≥ 500 ml/d of milk. Dietary intakes, as percentage total energy, were normally distributed for carbohydrate, protein, total fat, saturated fatty acids and MUFA, but were skewed to lower median than mean intakes for total PUFA and the individual fatty acids 18 : 2n-6, 18 : 3n-3, 20 : 4n-6, EPA and DHA (Table 1). The dietary intakes of total choline and vitamin D were normally distributed, with mean intakes of 391 mg/d and 8·0 μg/d, respectively (Table 1). Fish intake was also skewed, with a mean of 196 (sd 164; median 156; interquartile range 73–285; 5th–95th percentile range 0–522) g/week. The contribution of different foods to the total intake of choline is provided in Table S1.
Macronutrient, fatty acid, vitamin D and choline intakes from food for 222 pregnant women at 16 weeks' gestation (Mean values, standard deviations, medians, interquartile ranges and 5th–95th percentiles)

% en, Percentage of energy.
* Skewed distributions (P< 0·05; Kolmogorov–Smirnov test).
We first addressed the concordance between the dietary intakes and biochemical measures of status for the nutrients of interest. The dietary intake of DHA was significantly and positively correlated with erythrocyte PE DHA (ρ 0·31, P< 0·001; Fig. 1(a)). A similar significant positive association was found between the intake of choline and plasma free choline (ρ 0·23, P= 0·001; Fig. 1(b)). The dietary intake of EPA was also significantly correlated with erythrocyte PE EPA (ρ 0·48, P < 0·001, data not shown). We found only a weak trend between the intake of vitamin D from foods and plasma 25(OH)D (ρ 0·11, P= 0·09; Fig. 1(c)), and no significant association in the subset of women studied in the winter months (ρ 0·05, P= 0·61; n 99). However, plasma 25(OH)D was lower in women studied in the winter (54·2 (sd 25·7) nmol/l; n 99) than summer (63·5 (sd 27·3) nmol/l; n 123) (P= 0·009).
Scatter plots to show the relationship between dietary intake and biochemical measures of status: (A) DHA intake and erythrocyte phosphatidylethanolamine (PE) DHA (ρ 0·31, P< 0·001), (B) choline intake and plasma free choline (ρ 0·23, P= 0·001), (C) vitamin D from foods and plasma 25-hydroxyvitamin D (25(OH)D) (ρ 0·11, P= 0·09). The results were analysed for pregnant women at 16 weeks' gestation (n 222) using Spearman's ρ correlation analysis.

Next, we addressed whether fish intake is associated with the intake and biochemical measures of DHA, choline and vitamin D status. Women consuming ≥ 150 g/week fish had significantly higher intakes of DHA and higher erythrocyte PE DHA levels, as well as higher choline intakes and plasma free choline concentrations, and higher intakes of vitamin D from foods and plasma 25(OH)D concentrations than women consuming ≤ 75 g/week fish (P< 0·05; Table 2). Because DHA is present in animal lipids other than fish, and fish vary in DHA, we also grouped women by DHA intake as < 50, 50–200 and >200 mg/d DHA. Women consuming >200 mg/d DHA (n 35) had significantly higher erythrocyte PE DHA, plasma free choline and 25(OH)D levels than women consuming < 50 mg/d DHA (n 63), with erythrocyte PE DHA levels of 6·54 (sd 1·57) and 5·47 (sd 1·31) g/100 g total fatty acid, plasma free choline concentrations of 7·55 (sd 2·31) and 6·61 (sd 1·63) μmol/l, and plasma 25(OH)D concentrations of 64·9 (sd 31·4) and 50·9 (sd 21·0) nmol/l, in the two groups, respectively (P< 0·05; Fig. 2). The erythrocyte PE DHA, plasma free choline and 25(OH)D concentrations among women consuming 50–200 mg/d DHA (n 124) were also higher than those of women consuming < 50 mg/d DHA (P< 0·05; Fig. 2), but not different from those of women consuming >200 mg/d DHA (P>0·05). The dietary patterns among the women in the present study led to significant positive associations between the intakes from foods of DHA and vitamin D (ρ 0·47, P< 0·001; Fig. 3(a)), DHA and choline (ρ 0·32, P< 0·001; Fig. 3(b)), and choline and vitamin D (r 0·57, P< 0·001; Fig. 3(c)), with similar significant associations when adjusted for energy intake (data not shown). There were no significant associations between milk and fish intake; the median fish intake was 140 (interquartile range 67–261) and 156 (interquartile range 62–255) g/week among women who drank < 250 ml (n 64) and >500 ml (n 92) milk/d (P>0·05).
Dietary intakes from foods and biochemical measures of DHA, choline and vitamin D among Canadian pregnant women at 16 weeks' gestation when grouped by fish intake* (Mean values and standard deviations)
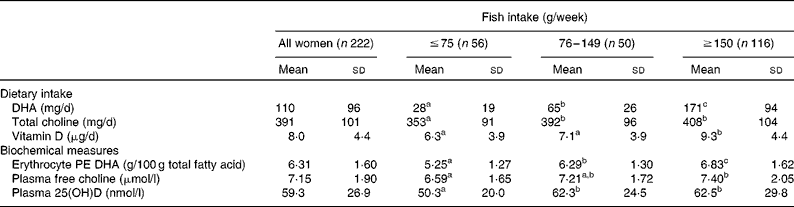
PE, phosphatidylethanolamine; 25(OH)D, 25-hydroxyvitamin D.
a,b,cMean values within a row with unlike superscript letters were significantly different (P< 0·05; ANOVA, post hoc Tukey's honest significant difference test).
* Fish includes all finfish and shellfish.
Differences in dietary intakes (A, C and E) and biochemical measures (B, D and F) of DHA, choline and vitamin D status among pregnant women grouped by DHA intake as < 50 (n 62), 50–200 (n 125), or >200 mg/d (n 35). Values are means, with standard deviations represented by vertical bars. a,b,cMean values with unlike superscript letters were significantly different (P< 0·05; ANOVA, post hoc Tukey's honest significant difference test). PE, phosphatidylethanolamine; 25(OH)D, 25-hydroxyvitamin D.

Scatter plots to show the relationship between the dietary intakes: (A) DHA and vitamin D from foods (ρ 0·47, P< 0·001), (B) DHA and choline (ρ 0·32, P< 0·001), (C) choline and vitamin D from foods (r 0·57, P< 0·001). The results were analysed for pregnant women (n 222) using Spearman's ρ correlation analysis and Pearson correlation analysis.

Discussion
In the present study, we demonstrate that for a group of healthy pregnant women, fish intake is positively related not only to DHA intake, but also to the intakes of choline and vitamin D from foods. More specifically, women who consumed ≤ 75 g/week fish had significantly lower plasma free choline and 25(OH)D, as well as lower erythrocyte PE DHA levels than women consuming ≥ 150 g/week fish (P< 0·05). When considered based on DHA intake, women consuming < 50 mg/d DHA appear to be at increased risk of low plasma 25(OH)D and free choline (Fig. 2). Observational studies have shown that maternal fish intakes during gestation are positively associated with child performance in tests of neurodevelopment, attributing the benefits of higher fish intakes to DHA(Reference Boucher, Burden and Muckle14–Reference Oken, Østerdal and Gillman18). However, intervention studies addressing the possible benefits of maternal DHA supplements on child outcome have yielded mixed results, with several studies finding little evidence of benefit(Reference Campoy, Escolano-Margarit and Ramos46–Reference Tofail, Kabir and Hamadani52). While it is clear that DHA plays critical roles in brain development and function(Reference Bazan, Musto and Knott30, Reference Brenna and Lapillonne53), the present study raises the possibility of confounding nutrient deficiencies by which fish is an important source and necessary for optimal brain development. Whether failure to identify and correct for nutrients other than DHA that may be limiting and constrain child development plays any role in the variable outcomes of studies assessing the benefits of maternal supplementation with DHA during pregnancy is not known. Notably, Helland et al. (Reference Helland, Saugstad and Smith49–Reference Helland, Smith and Blomén51) found higher scores on standard tests of cognitive functioning at 4 and 7 years of age among children of Norwegian women given cod liver oil providing 10 μg vitamin D, 1183 mg DHA and 803 mg EPA/d in pregnancy and lactation when compared to children of women given a corn oil placebo that was balanced to also provide 10 μg/d vitamin D.
An important question is the extent to which the diets of the women in our study are representative of other women following westernised diets. Despite the coastal location of Vancouver, 48 % of the women ate < 150 g/week fish and 83 % consumed < 200 mg/d DHA, which is the intake recommended during pregnancy and lactation in the 2008 FAO/WHO consultation on fats and fatty acids in human nutrition(Reference Brenna and Lapillonne53). The mean intake 110 mg/d DHA among the women in our study is similar to the mean intakes of DHA among pregnant women in other countries following westernised diets(Reference Brenna and Lapillonne53). Relatively little information is as yet available on dietary choline intakes, which in the present study was 391 (sd 101) mg/d and similar to the choline intake of 409 (sd 179) mg/d reported for pregnant women in the USA(Reference Shaw, Carmichael and Yang54). The current adequate intake for choline during pregnancy is 450 mg/d(55), which infers that a considerable proportion of women may be at risk of poor choline status. Further, women in the present study who consumed < 450 (n 157) or ≥ 450 (n 65) mg/d choline had DHA intakes of 95 (sd 94) and 146 (sd 92) mg/d, and vitamin D intakes from foods of 6·7 (sd 3·7) and 11·2 (sd 4·19) μg/d (P< 0·05). However, we note that as yet there is no evidence that maternal plasma choline concentrations in gestation are related to later measures of child intelligence quotient (IQ)(Reference Signore, Ueland and Troendle56).
The present study was not designed to assess vitamin D insufficiency or the efficacy of food fortification or vitamin supplements in maintaining acceptable plasma 25(OH)D concentrations during pregnancy. However, the present study confirms and reinforces the high prevalence of vitamin D insufficiency among Canadian pregnant women, as well as other adults and children(Reference Li, Green and Innis21, Reference Waiters, Godel and Basu24, Reference Baraké, Weiler and Payette57–Reference Vatanparast, Calvo and Green59). Uncertainty over the optimal plasma 25(OH)D during pregnancy remains, with a concentration ≥ 50 nmol/l recommended in the most recent dietary reference intake(60), and ≥ 75 nmol/l considered sufficient for pregnant and lactating women by the Canadian Pediatric Society(61). We found that 88 and 76 % of the women in our study had a plasma 25(OH)D < 75 nmol/l in the winter and summer, respectively, and three women in the winter and one woman in the summer had a plasma 25(OH)D < 25 nmol/l. The apparently high prevalence of 25(OH)D insufficiency occurred despite the high proportion (40 %) of women in our study who consumed >500 ml/d milk, contributing to a theoretical 5·5 μg/d vitamin D. Another recent cross-sectional study found that 72 % of women at 20–27 weeks' gestation in Vancouver had a plasma 25(OH)D < 75 nmol/l(Reference Li, Green and Innis21), while the serum 25(OH)D of non-native pregnant women in the Inuvik zone of the Northwest Territories was 59·8 (sd 29·4) nmol/l(Reference Waiters, Godel and Basu24). As in other studies(Reference Vieth, Cole and Hawker23, Reference Baraké, Weiler and Payette57, Reference Tangpricha, Pearce and Chen62), the significant effect of season on plasma 25(OH)D levels found in our study shows that environmental factors make an impact on vitamin D status, over and above the effect of food fortification or vitamin supplements. Also consistent with other studies(Reference Vieth, Cole and Hawker23, Reference Tangpricha, Pearce and Chen62), we found a lack of association between total vitamin D intake from foods and plasma 25(OH)D. Several reasons could explain this. First, we did not quantify the contribution of vitamin D from vitamin supplements. We also estimated vitamin D intakes from foods with the assumption of a standard, consistent vitamin D fortification in milk, which in practice may be highly variable(Reference Calvo, Whiting and Barton63, Reference Faulkner, Hussein and Foran64). Regardless, our results to show that women consuming >75 g fish/week had higher plasma 25(OH)D concentrations than women with lower fish intakes, suggests that natural food sources of vitamin D may be more effective in promoting higher vitamin D status than supplemental sources of the vitamin. Consistent with this, women in Japan who consumed fish ≥ 4 times/week had a significantly higher plasma 25(OH)D levels than those consuming fish 1–3 times/week(Reference Nakamura, Nashimoto and Hori65).
In summary, the present study has shown that among Canadian pregnant women, those women consuming ≥ 2 servings of fish/week have higher intakes of DHA, as well as choline and vitamin D, and higher biochemical markers of DHA, choline and vitamin D than women consuming ≤ 1 serving fish/week. While fish is well recognised as an important source of DHA, our study highlights the contribution of fish to other nutrients also needed for brain development. This study highlights the possibility that intervention with single nutrients, such as DHA, may achieve null findings of benefit if supplementation is in populations or individuals in whom other key nutrients that make an impact on the outcome of interest are also limiting.
Acknowledgements
The authors would like to acknowledge the financial support from the Canadian Institutes of Health Research (CIHR). S. M. I. designed the research. R. A. D. and D. J. K. conducted the laboratory analyses. B. T. W. analysed the dietary data. S. M. I. and B. T. W. analysed the data and wrote the manuscript. S. M. I. had primary responsibility for the final content. All authors read and approved the final manuscript. There is no conflict of interest for any of the authors.
The supplementary material for this article can be found at http://www.journals.cambridge.org/bjn



