Implications
Genomic selection is attractive for dairy cattle breeding, because it relaxes the need to have phenotypic measurements of close relatives of all selection candidates. Thereby it decreases generation intervals and increases genetic gain per year for all breeding goal traits. We demonstrate here that with a cow reference population of only 2000 records, substantial selection response can be obtained for a new trait at the population level. An important implication when adopting breeding for such new traits in dairy cattle breeding schemes is that the limited accuracy of individual breeding values may prohibit ranking of individual animals meeting the current standards.
Introduction
Genomic selection is revolutionising breeding programs worldwide. This new selection tool is particularly beneficial for dairy cattle breeding programs (Pryce et al., Reference Pryce, Goddard, Raadsma and Hayes2010; de Roos et al., Reference de Roos, Schrooten, Veerkamp and van Arendonk2011), because it allows to significantly reduce generation intervals and cheaply increase selection intensity, and the accuracy of selection is only marginally lower compared with progeny testing schemes. Applications of genomic selection use a reference population to estimate effects for genome-wide single nucleotide polymorphism (SNP) that are used subsequently to predict breeding values for young selection candidates (Meuwissen et al., Reference Meuwissen, Hayes and Goddard2001). Thereby, the requirement of traditional dairy cattle breeding schemes to measure phenotypes from progeny groups for each male selection candidate is relaxed. Next to reducing the generation interval, relaxing the traditional requirement of having to measure phenotypes on progeny holds another important promise, as it allows selection for new traits, which are difficult or expensive to measure in practical circumstances, but may be measured on a small reference population. For traits that have been part of the breeding goal, current reference populations consist of bulls with highly accurate ‘phenotypes’ based on the average phenotype of hundreds of daughters (for reviews see: Hayes et al., Reference Hayes, Bowman, Chamberlain and Goddard2009; Calus, Reference Calus2010), and may contain up to as much as 16 000 bulls (Lund et al., Reference Lund, de Ross, de Vries, Druet, Ducrocq, Fritz, Guillaume, Guldbrandtsen, Liu, Reents, Schrooten, Seefried and Su2011). For new traits, depending on the cost of a single phenotypic measurement, composing reference populations may only be feasible for perhaps a few thousand cows with a single phenotypic measurement. Examples of such new traits are reduction of methane emission (Wall et al., Reference Wall, Simm and Moran2010), energy balance (Verbyla et al., Reference Verbyla, Calus, Mulder, de Haas and Veerkamp2010), progesterone profiles as a proxy for fertility (Berry et al., Reference Berry, Bastiaansen, Veerkamp, Wijga, Wall, Berglund and Calus2012) and susceptibility to paratuberculosis (Johne's disease; Kirkpatrick et al., Reference Kirkpatrick, Shi, Shook and Collins2011). On the basis of such reference populations consisting of 600 to 2000 cows with single phenotypic measurements, accuracy of direct genomic values (DGV) was reported to be in the range of 0.3 to 0.5 (Verbyla et al., Reference Verbyla, Calus, Mulder, de Haas and Veerkamp2010; de Haas et al., Reference de Haas, Windig, Calus, Dijkstra, de Haan, Bannink and Veerkamp2011). Although these accuracies are relatively low compared with accuracies of traditional breeding values of progeny-tested bulls, it is important to establish if sufficient genetic progress for such traits can be achieved, combined with the reduction of generation interval. Another option to select effectively for these new traits might be to find cost-efficient ways to increase the accuracy of DGV, for example, by including an available correlated indicator trait in a multitrait genomic selection procedure (Calus and Veerkamp, Reference Calus and Veerkamp2011). For example, using predictor traits for which large reference populations with daughter proven bulls exist. Important questions are whether such multitrait approach would help to significantly increase the accuracy of genomic selection, and what the response to selection would be for such new traits, even if the accuracy of prediction is low compared with the accuracy of current breeding goal traits.
The objectives of this paper, therefore, were to predict accuracy of and response to genomic selection for a new trait, considering that only a cow reference population of moderate size was available for the new trait, and that selection simultaneously targeted an index and this new trait. For the index, a bull reference population was available. To compare the relative impact of combined selection for the index and the new trait, two alternative breeding goals were considered. One of those breeding goals included only the index, whereas the other one only included the new trait.
Material and methods
Breeding goals
The existing breeding goal in the default scenario is based on a combination of traits that, in our case, is simplified by modelling a single trait with a heritability of 30%. This breeding goal trait is equivalent to a commonly used total merit index. The breeding program is executed using genomic selection, using an accuracy for the DGV of the index predicted with the formula of Daetwyler et al. (Reference Daetwyler, Villanueva and Woolliams2008). In this existing breeding program, a new trait is introduced using genomic selection based on a limited cow reference population. This new trait is considered to have a heritability of 5% or 30%, and its genetic correlation with the existing breeding goal trait and index is −0.5, 0 or 0.5.
Three different breeding goals (H) are considered, that can generally be represented as
 $$H\,{\rm{ = }}\,{{v}_{{\rm{index}}}}{{A}_{{\rm{index}}}}\,{\rm{ + }}\,{{v}_{{\rm{new}}}}{{A}_{{\rm{new}}}}$$
where A index and A new are true breeding values for the index trait and the new trait, with economic values v index and v new, respectively. The overall combined index (I) used as selection criteria for the breeding goal is
 $$I\,{\rm{ = }}\,{{b}_{{\rm{index}}}}{{X}_{{\rm{index}}}}\,{\rm{ + }}\,{{b}_{{\rm{new}}}}{{X}_{{\rm{new}}}}$$
where X index and X new are information sources for the index and the new trait, with index weights b index and b new, respectively. The information sources X index and X new are here the direct genomic breeding values (i.e. DGV), respectively, for the index and the new trait.
The first breeding goal considered included the index only, setting economic values v index to 1 and v new to 0, and only used information from the bulls (I = b indexX index). This reflects the breeding goal before the new trait is introduced. The accuracy of the DGV for the index was varied by increasing the number of bulls in the reference population for the index from 0 to 20 000.
The second breeding goal considered included the new trait only, setting economic values v index to 0 and v new to 1, and used information from the bulls for the index and from the cows for the new trait (I = b indexX index + b newX new). The accuracy of the DGV for the new trait was varied by increasing the number of cows in the reference population for the new trait from 0 to 10 000. The accuracy of the DGV for the index was varied by increasing the number of bulls in the reference population for the index from 0 to 20 000.
The third breeding goal considered included both the new trait and the index. In this breeding program, v index was considered to be 1, and v new was 0.1, 0.5 or 1.0. This breeding goal also used information from the bulls for the index and from the cows for the new trait (I = b indexX index + b newX new). For this breeding goal, the accuracy of the DGV for the new trait was varied by increasing the number of cows in the reference population for the new trait from 0 to 10 000. The accuracy of the DGV of the index was kept constant at 0.8, which corresponds to 6250 bulls in the reference population. A constant value was chosen to avoid having too many dimensions for the results.
Structure breeding program
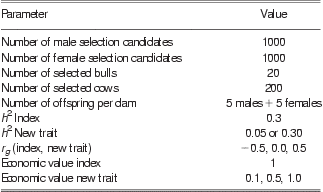
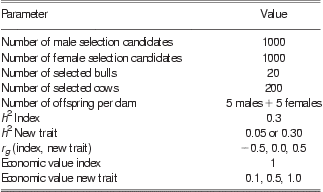
The structure of the breeding program was similar to the study of Schrooten et al. (Reference Schrooten, Bovenhuis, van Arendonk and Bijma2005), with regard to the numbers of cows and bulls included. In each generation, 1000 male and 1000 female selection candidates were available for selection. Then 2% of the males and 20% of the females were selected to be used in the breeding program. This implies that each selected female produced 10 offspring through a multiple ovulation and embryo transfer (MOET) scheme. In our study, for simplicity we adopted single stage genomic selection for the male selection pathways in contrast to the study of Schrooten et al. (Reference Schrooten, Bovenhuis, van Arendonk and Bijma2005) where multistage selection was used. Selection in the female selection pathways was only performed to select dams of bulls, and was considered to be based on DGV that were also available for bulls. Parameters used in the simulations are summarised in Table 1.
Parameters used in the simulation
Genetic responses per generation were calculated from genetic responses per year, by assuming generation intervals of 2 years for selection of sires of bulls and sires of cows, 3.33 years for dams of bulls and 5 years for dams of cows. These numbers were adopted from Pryce et al. (Reference Pryce, Goddard, Raadsma and Hayes2010) to represent a genomic selection breeding scheme where animals are selected at young age based on their DGV. Genetic response for dams of cows was considered to be zero. This follows the assumptions that cows on commercial dairy farms, other than bull dams, were not genotyped, and that the contribution of other within-herd selection for dams of cows to the genetic response was negligible.
Predicting accuracy of and response to genomic selection
Selection is known to reduce genetic variance (Bulmer, Reference Bulmer1971) and thereby reduces both response and accuracy of selection. Ignoring this phenomenon leads to overestimation of both the accuracy of and the response to selection (Reference BijmaBijma, 2012). To account for this so-called Bulmer effect, the reported genetic responses and selection accuracies were calculated for the three breeding goals using the program SelAction (Rutten et al., Reference Rutten, Bijma, Woolliams and van Arendonk2002). This program uses selection index theory, accounting for reduction in variance due to selection (Bulmer, Reference Bulmer1971), and corrects selection intensities for finite population size and for the correlation between index values of family members. These variables are used to calculate genetic response as
 $${\rm{\rDelta }}{\bf G}\,{\mib{ = }}\,{\bf b}^{\prime}{\bf G}i{\rm{/}}{{\sigma }_I}$$
where ΔG is a vector containing selection response for each trait, b′ is a vector with economic weights for both traits, G is a matrix of co-variances between information sources (X) and true breeding values (A) of selection candidates, i is the selection intensity and σI is the standard deviation (s.d.) of the combined index that represents the overall breeding goal.
Required input variables such as phenotypic and genetic (co-)variances were derived using the guidelines defined by Dekkers (Reference Dekkers2007). Following this approach, we defined two predictor traits as information source for the two breeding goal traits (index and new trait), that is, a DGV for the index, and a DGV for the new trait. Both the index and the new trait were considered to have a phenotypic variance of 1. The required phenotypic and genetic co-variances were calculated as outlined by Dekkers (Reference Dekkers2007), using the heritability for both traits, the genetic correlation between the index and the new trait and the accuracies of the DGV. In these calculations, the heritability of the DGV of both the index and the new trait were considered to be 0.999 (Dekkers, Reference Dekkers2007), but the accuracy of the DGV for the index and new trait were based on the assumed heritability of the considered trait and on the size of the bull or cow reference population, respectively. Note that in this approach, the DGV traits act as predictor traits of the traits in the breeding goal, with genetic correlations equal to the DGV accuracies (Dekkers, Reference Dekkers2007). As index weights (b-values) are calculated using the genetic (co-)variance matrix, this ensures that breeding values were both weighted based on their accuracy and the economic values of the traits.
DGV accuracies for both the index and the new trait were predicted using the general formula (Daetwyler et al., Reference Daetwyler, Villanueva and Woolliams2008; Daetwyler, Reference Daetwyler2009)
 $$ {{r}_{g\mathop{\hat g}}}\, = \,q\sqrt {\frac{{\frac{{{{n}_p}}}{{{{n}_G}}}{{h}^2} }}{{\frac{{{{n}_p}}}{{{{n}_G}}}{{h}^2} \, + \,1}}} $$
where q is the square root of the proportion of the total genetic variance captured by the markers, np is the number of phenotypic records used (assuming one record per animal), nG is the number of quantitative trait loci (QTL) or effective chromosome segments, and h 2 is the heritability of the trait. For q we used a value of  $$)(-->$<>\sqrt {0.8}<$>
<!--$$, which is reported for the commonly used 50k SNP chip (Daetwyler, Reference Daetwyler2009). The chosen value for nG was 1000, to reflect the effective number of independent chromosomal segments (Goddard, Reference Goddard2009).
The DGV accuracy for the new trait using cow data was predicted using either a heritability of 0.05 or 0.30. To predict the DGV accuracy for the index trait using bull data, the heritability was derived that reflects average offspring performance such as daughter yield deviations (VanRaden and Wiggans, Reference VanRaden and Wiggans1991) or de-regressed proofs (Sigurdsson and Banos, Reference Sigurdsson and Banos1995). We considered that bulls in the reference population had an estimated breeding value based on 100 daughters with records. Combined with heritabilities of 0.05 and 0.30, accuracies (rIH) 0.75 and 0.94, respectively, were obtained using  $$)(-->$<>\scriptstyle{{r}_{IH}}\, = \,\sqrt {({{\frac{1}{4}n{{h}^2}) /}}({{1\, + \,\frac{1}{4}(n\,{\rm{ - }}\,{\rm{1}}){{h}^2} }}}) <$>
<!--$$ (Mrode, Reference Mrode2005). Those values were squared and then used as heritability for the bull ‘phenotypes’ in the Daetwyler-formula to obtain DGV accuracies.
Results
Selection for the index only
First we considered the breeding goal that only selects for the index  $$)(-->$<> {\rm{(}}H\,{\rm{ = }}\,{{v}_{{\rm{index}}}}{{A}_{{\rm{index}}}}\,{\rm{;}}\,I\,{\rm{ = }}\,{{b}_{{\rm{index}}}}{{X}_{{\rm{index}}}}{\rm{)}} <$>
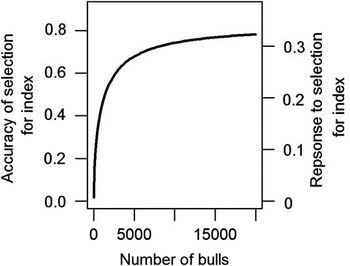
<!--$$. Both the accuracy of and the response to genomic selection, as a function of the number of bulls included in the reference population, are shown in Figure 1. Note that in all presented scenarios the (overall) response to selection is linearly related to the accuracy of selection. These results show that with less than 5000 bulls included in the reference population, adding additional bulls yields a steep increase in selection accuracy and response, although this increase becomes much smaller thereafter.
Accuracy of (left y-axis) and response to selection (right y-axis; genetic standard deviation per year) for the index, as a function of the number of bulls in the reference population.

Selection for the new trait only
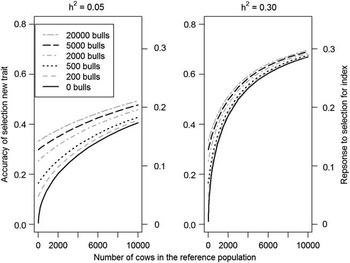
The second evaluated breeding goal only aims for the new trait (H = v newA new), and uses information from the bulls for the index and from the cows for the new trait (I = b indexX index + b newX new). Both the accuracy of and the response to genomic selection, as a function of the number of cows included in the reference population, are shown in Figure 2, assuming a heritability of 0.05 or 0.30. In both graphs, the lowest line represents a scenario with the cow reference population only, or a scenario with a genetic correlation between the index and the new trait of zero. With a heritability of 0.05 the accuracy with 10 000 cows is 0.41, and with a heritability of 0.30 this is 0.67. Both the accuracy of and response to genomic selection are improved when the genetic correlation between the index and the new trait is 0.5 (or −0.5), and when an increasing number of bulls with known index and genotypes is added (Figure 2). This reflects a situation where a large bull reference population is available for a correlated trait. For example, with a reference population of 1000 cows, adding information on the index from 5000 bulls increases the accuracy (response) of genomic selection for the new trait from 0.15 (0.07) to 0.33 (0.16) for a heritability of 0.05, and from 0.33 (0.16) to 0.43 (0.20) for a heritability of 0.30 (Figure 2). The same increases could be achieved by increasing the number of cows in the reference population to ∼5800 or ∼1800, for heritability levels of the new trait of 0.05 and 0.30, respectively. The results in Figure 2 indicate that the marginal benefit of adding the bull information decreases with increasing number of cows included in the reference population and with increasing heritability of the new trait. The marginal contribution of additional bulls decreases quickly when the number of already included bulls increases, as was expected based on the decreasing contribution of additional bulls to the accuracy of the index (Figure 1).
Accuracy of (left y-axis) and response to selection (right y-axis; genetic standard deviation per year) for the breeding goal that only includes the new trait, depending on the number of cows (0 to 10 000) in the reference population for the new trait and the number of bulls (0 to 20 000) included in the reference population for the index. The genetic correlation between the new trait and the index is 0.5 (or −0.5).

Selection for the index and the new trait simultaneously
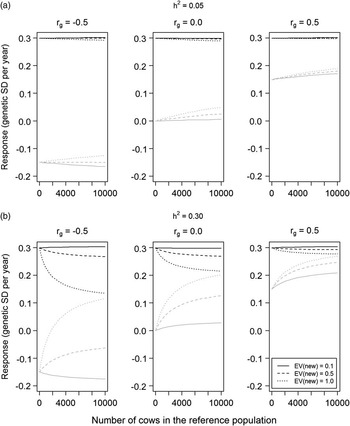
The third evaluated breeding goal selects both for the index and the new trait (H = v indexA index + v newA new), and uses information from the bulls for the index and from the cows for the new trait (I = b indexX index + b newX new). Predicted selection response for the index and the new trait is shown in Figure 3. The selection response for the index is hardly affected when the new trait is added to the breeding goal with an economic value of 0.1, or when the new trait has a heritability of 0.05. When the heritability is 0.05, the selection response for the new trait is almost completely due to a correlated response from selection on the index, and only slightly affected by the size of the cow reference population. In this scenario, a reference population of 10 000 cows, compared with having no information for the new trait, only increased the response to selection at most by 0.05 genetic s.d. per year.
Response to selection for the index and the new trait, considering a breeding goal including the index (black lines) and the new trait (grey lines). The new trait had a heritability of 0.05 (a) or 0.30 (b), variable economic values (0.1, 0.5 and 1; see legend), and was based on a reference population with 0 to 10 000 cows. The index always had an economic value of 1.0, and was based on a direct genomic breeding value accuracy of 0.8, which corresponds to a reference population of 6250 bulls.

For the scenario with a new trait with a heritability of 0.30 and an economic value of 0.5 or 1.0, the response to selection for the new trait can be dramatically increased using the information from the cow reference population (Figure 3). For instance, with an economic value of 1.0 and a genetic correlation with the index of −0.5, using a cow reference population of ∼1750 cows is sufficient to stop the negative genetic trend for the new trait. With a reference population of 10 000 cows, the responses for the index and the new trait were almost the same for all values of the genetic correlation. This results from the fact that the DGV accuracy of the new trait based on 10 000 cows (0.77) is close to the DGV accuracy of the index based on 6250 bulls (0.8).
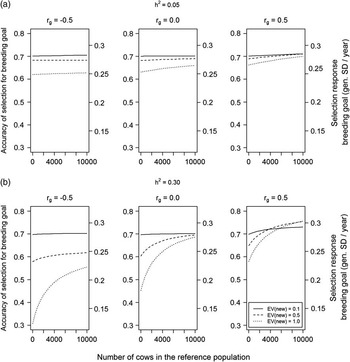
The selection accuracy and response across different scenarios for the total breeding goal are shown in Figure 4. When the new trait had a heritability of 0.05, the selection accuracy and response were hardly affected, unless the economic value of the new trait was 1.0, or the genetic correlation between the index and the new trait was 0.5. This reduction in selection accuracy and response results from the fact that a relatively large part of the selection pressure is put on a trait with information that has low accuracy compared with the index. Similar trends are observed when the new trait has a heritability of 0.30, although in this scenario the effect on selection accuracy and response is much larger. For a large economic value of the new trait, and a negative genetic correlation between the index and the new trait, cow reference populations of 10 000 cows are not sufficient to achieve a selection accuracy and response equal to the breeding goal that only includes the index.
Accuracy of selection for the breeding goal that includes the index and the new trait. The new trait had a heritability of 0.05 (a) or 0.30 (b), variable economic values (0.1, 0.5 and 1; see legend), and was based on a reference population with 0 to 10 000 cows. The index always had an economic value of 1.0, and was based on a direct genomic breeding value accuracy of 0.8, which corresponds to a reference population of 6250 bulls.

Discussion
The objective of this paper was to predict accuracy of and response to genomic selection for a new trait, considering that only a cow reference population of moderate size was available for the new trait, and that selection simultaneously targeted an index and this new trait. This was achieved using software based on selection index theory to evaluate different breeding programs. Obtained genetic response in the standard breeding goal in our study was at most 0.32 genetic s.d. per year. In our predictions, the so-called Bulmer effect was accounted for. Ignoring this phenomenon generally leads to an overestimation of the selection response. Considering this, the selection responses in our study are in line with results of other studies, either based on stochastic (de Roos et al., Reference de Roos, Schrooten, Veerkamp and van Arendonk2011; Lillehammer et al., Reference Lillehammer, Meuwissen and Sonesson2011) or deterministic simulations (Pryce et al., Reference Pryce, Goddard, Raadsma and Hayes2010; Buch et al., Reference Buch, Sørensen, Berg, Pedersen and Sørensen2012). Our results show that response to genomic selection for new traits based on only limited cow reference populations can be substantial, despite the low level of reliability of individual DGV. Considering a reference population of 2000 cows, the used DGV reliabilities (i.e. squared accuracies) for the new trait were 0.07 and 0.30 for heritability levels of 0.05 and 0.30, respectively (results not shown). Because it is not common in dairy cattle genetic evaluations to publish breeding values for a trait with such low accuracy, implementing genomic selection for new traits based on only such limited cow reference populations is unlikely to happen in dairy cattle breeding programs in the near future.
Genomic selection using indicator traits
In the second breeding goal, that only targeted the new trait, the index DGV contributed to the accuracy of selection for the new trait when the genetic correlation was non-zero. In terms of genetic response, this contribution can be quantified as an increase in selection response for the new trait compared with the scenario where the genetic correlation was zero. The increase in accuracy of selection for the new trait when using the information on the index trait can be seen as the increase in accuracy due to multitrait genomic evaluation of the index and the new trait, compared with a situation where DGV for the new trait are calculated in a single trait evaluation (Calus and Veerkamp, Reference Calus and Veerkamp2011). Our results for the breeding goal that only targeted the new trait indicate that in genomic evaluations, indicator traits are particularly useful for traits with low DGV accuracy, which might result from the fact that the heritability of the trait is low, or because the cow reference population for the trait is small.
Accuracies
The accuracies used for the DGV, predicted separately for the new trait and the index, reflect a situation with no (strong) pedigree relationships between evaluated animals and the reference population (Daetwyler et al., Reference Daetwyler, Villanueva and Woolliams2008). It has, however, been shown that genomic predictions are substantially more accurate for evaluated animals that are related to the reference population (Habier et al., Reference Habier, Fernando and Dekkers2007; Habier et al., Reference Habier, Tetens, Seefried, Lichtner and Thaller2010; Pérez-Cabal et al., Reference Pérez-Cabal, Vazquez, Gianola, Rosa and Weigel2012; Pszczola et al., Reference Pszczola, Strabel, Mulder and Calus2012), whereas at the same time minimising the relationship among animals in the reference population leads to the highest average accuracy for evaluated animals (Pszczola et al., Reference Pszczola, Strabel, Mulder and Calus2012). This implies that the reference population ideally should be composed such that it is closely related to the potential selection candidates. Whether this is achievable may depend on practical circumstances. When measurements are taken with specialised and expensive equipment, then it may be more important to limit the number of herds included and just phenotype as many animals as possible in each considered herd.
Instead of creating relationships between the evaluated animals and the reference population, an alternative strategy could be to ensure that genomic predictions rely as much as possible on SNP–QTL linkage disequilibrium (LD). It has for instance been shown that some genomic prediction models tend to put more emphasis on SNP–QTL LD than others (Zhong et al., Reference Zhong, Dekkers, Fernando and Jannink2009). In simulation studies, it has been shown that the accuracy of LD-based predictions persists longer across generations than predictions mainly based on relationships between evaluated animals and the reference population (Habier et al., Reference Habier, Fernando and Dekkers2007). When the accuracy of the predictions persists across generations, the frequency of re-estimating SNP effects may be reduced, as well as in this case the frequency to phenotype additional animals. Regardless of the relationship with the reference population, however, the accuracy of initial genomic predictions always drops across generations, with the largest drop typically in the first generation after the reference population. This suggests that the accuracy of genomic predictions can only be kept at an acceptable level across generations, by continuously phenotyping and genotyping new animals to be added to the reference population every generation, to allow updating of SNP effects. An important unanswered question is how many animals should be added in next generations to achieve this, given known values for parameters such as the heritability and the number of animals that already is included in the reference population.
The design of the reference population could perhaps also be optimised to put as much emphasis as possible on SNP–QTL LD in the genomic predictions. Furthermore, it has been suggested that multi-breed reference populations are particularly useful to achieve this (de Roos et al., Reference de Roos, Hayes and Goddard2009). To date, there is, however, little information available from studies based on real data to proof that any of those approaches indeed lead to genomic predictions that are highly persistent across generations.
Selection for new traits
The considered breeding scheme generated 10 offspring per selected female, thereby mimicking a MOET scheme. As demonstrated by Pedersen et al. (Reference Pedersen, Kargo, Berg, Voergaard, Buch and Sørensen2012), applying MOET can lead to an increase of ∼15% to 25% in annual genetic gain of a genomic selection breeding scheme, mainly due to an increase in selection intensity for the bull dam selection path. This implies that expected rates of genetic gain are considerably lower for a comparable breeding scheme without MOET. Nevertheless, our results also apply to different breeding schemes, which achieve similar selection intensities, regardless of whether MOET is applied or not.
An important unanswered question is at what cost of phenotyping, genomic selection for new traits based on a cow reference population becomes an interesting alternative. Considering that the generation interval of our simulated scheme is up to three times shorter than a progeny testing scheme, the results of Van Grevenhof (Reference Van Grevenhof2011) indicate that the annual response to genomic selection, based on a reference population of ∼1500 animals, for a trait with a heritability of 0.3 is similar to the response of a progeny-based breeding scheme with 10 offspring per candidate. For a heritability of 0.1, then a reference population of ∼2000 animals is required to achieve the same response as with 10 phenotyped offspring per selection candidate (Van Grevenhof, Reference Van Grevenhof2011). These figures suggest that for a selection scheme with more than 200 selection candidates, the initial cost of phenotyping for genomic selection is less expensive than the phenotyping cost for 1 year of progeny testing. Although continuous phenotyping will be required to maintain the accuracy at a constant level in a genomic selection approach, the required number of additional phenotypes in later years is expected to be much smaller than the required number of phenotypes per year in a progeny testing scheme.
In order to start selecting for a new trait, regardless of whether genomic or progeny-based selection is practiced, first the characteristics of the trait need to be known. These include the economic value and the genetic parameters, that is, the genetic variance, the heritability and the genetic correlation with all breeding goal traits. To achieve this, perhaps at least a few thousand records are needed when the records are obtained from animals that also have measures for all other breeding goal traits. In our study, we targeted a trait that is expensive or difficult to measure. In a scenario where phenotyping an individual animal is much more expensive than genotyping an individual, the most cost-effective approach is to obtain one phenotype per animal and genotype all measured animals (Van Grevenhof, Reference Van Grevenhof2011). Considering a trait like feed efficiency or methane emission in dairy cattle, selection may be targeted to increase efficiency and decrease mitigation in lactating animals. In such a scenario, it is important to measure the trait on lactating animals. Milk yield traits would also be measured on the same animals, allowing straightforward computation of the genetic correlations with those traits. For other important breeding goal traits such as survival, perhaps the closest relatives with reliable information may be the bulls of the cows that are included in the reference population for the new trait. The minimum number of observations required to estimate reliable genetic correlations with all breeding goal traits may therefore be an additional limiting factor to determine the size of the initial reference population for the new trait, next to the desired minimum level of the accuracy for the new trait.
When introducing a new trait in the breeding goal, the effect on the response for the overall breeding goal is depending on the heritability and economic value of the new trait and the genetic correlation with the current breeding goal. The results in Figure 4 clearly show that a new trait with a low heritability and a low economic value will hardly affect overall response. The impact of the economic value of the new trait can be considerably amplified both by a higher heritability of the new trait and by a lower genetic correlation with the index (Figure 4). Examples of new traits that are gaining attention rapidly are for instance methane emission and energy balance. Predicted methane emission was shown to have a heritability of 0.35 and has a genetic correlation with fat and protein corrected milk of 0.31 (de Haas et al., Reference de Haas, Windig, Calus, Dijkstra, de Haan, Bannink and Veerkamp2011). Energy balance has an estimated heritability of 0.33, and a genetic correlation ranging from −0.13 to −0.3 with milk, fat and protein yield (Veerkamp et al., Reference Veerkamp, Oldenbroek, Van Der Gaast and Van Der Werf2000). Considering that the breeding goal aims to increase milk yield, while it is desirable to increase energy balance and to decrease methane emission, both methane emission and energy balance are equivalent to a new trait with a positive economic value but a negative genetic correlation with the current breeding goal. Both traits are perhaps in between our scenarios with genetic correlations of −0.5 and 0.0 with the index trait, and may have relatively low economic values compared with the other traits in the current breeding goal. Our results in Figure 4b suggest that the effect of including such new traits in the breeding goal on the overall selection response may be substantial. Increasing the reference population may alleviate this effect somewhat, although perhaps more than 10 000 cows should be included to reach acceptable genetic response at the level of the whole breeding goal. This indicates that for new traits such as methane emission and energy balance that may be included in future breeding goals, it is very important to estimate their economic value, next to the genetic parameters, to determine the required reference population size and the impact on genetic response of the breeding goal.
Conclusion
Our results indicate that accuracy of and response to genomic selection for new traits based on limited cow reference populations can be substantial, even when the reliability of individual genomic breeding values is much lower than currently accepted in dairy cattle breeding programs. The potential genetic response of such new traits, and the impact on the genetic response in the whole breeding goal, is heavily affected by the genetic correlation to the index and the economic value of the new trait. For new traits with a very small or positive genetic correlation with the index, and a high positive economic value, considerable genetic response can already be made with genomic selection based on a cow reference population with only 2000 records. New traits may, however, generally be equivalent to the presented scenario with negative genetic correlation with the index and a small positive economic value. For such traits, introduction in the breeding goal may decrease the overall selection response when the reference population is limited in size, especially when the new trait has a high heritability. To achieve acceptable levels of genetic response for the new trait and at the level of the whole breeding goal, cow reference populations of at least 10 000 cows may be required for new traits with a negative genetic correlation with the breeding goal.
Acknowledgements
Piter Bijma is acknowledged for helpful discussions on the calculations of the accuracy of selection and selection response. The authors acknowledge funding for the study from the Dutch Dairy Board (PZ; Zoetermeer, The Netherlands) and AgentschapNL (The Hague, The Netherlands). The RobustMilk project is also acknowledged for financial support. The RobustMilk project is financially supported by the European Commission under the Seventh Research Framework Programme, Grant Agreement KBBE-211708. Marcin Pszczola gratefully acknowledges financial support of the Koepon Stichting (Leusden, The Netherlands) and GreenHouseMilk. The GreenHouseMilk project is financially supported by the European Commission under the Seventh Research Framework Programme, Grant Agreement KBBE-238562. The content of this paper is the sole responsibility of the authors, and it does not necessarily represent the views of the Commission or its services.