People differ with respect to how fluently they speak. Some speak faster than others, some use more filled pauses such as uhs and uhms than others, some use more silent pauses than others, and some use longer silent pauses than others (e.g., Clark & Fox Tree, Reference Clark and Fox Tree2002; Goldman-Eisler, Reference Goldman-Eisler1968; Shriberg, Reference Shriberg1994). These individual differences exist for nonnative speakers and they also exist for native speakers. This raises the question to what extent aspects of fluency in nonnative speech can be considered indicators of second language (L2) proficiency rather than indicators of nonlinguistic factors such as personality characteristics. In this study, we will explore which aspects of L2 fluency relate to L2 linguistic knowledge and processing skills, and to what extent.
The term fluency, usually restricted for describing L2 speech, can be used in at least two ways. Lennon (Reference Lennon1990) distinguishes a broad definition and a narrow definition. In the broad definition, fluency can be seen as overall (speaking) proficiency, whereas fluency in the narrow definition pertains to smoothness and ease of oral linguistic delivery. In this paper, we will use the term fluency in its narrow sense.
COGNITIVE FLUENCY, UTTERANCE FLUENCY, AND PERCEIVED FLUENCY
Segalowitz (Reference Segalowitz2010) proposes that a distinction be made between the following three notions of fluency: cognitive fluency, utterance fluency, and perceived fluency. Cognitive fluency can be defined as the fluency that characterizes a speaker and has to do with the speaker's abilities to efficiently plan and execute his speech.
Utterance fluency is the fluency that can be measured in a sample of speech. One can define utterance fluency objectively by measuring (temporal) aspects of the speech sample. Skehan (Reference Skehan2003) and Tavakoli and Skehan (Reference Tavakoli, Skehan and Ellis2005) noted that utterance fluency is a construct with several aspects. They distinguish between breakdown fluency, speed fluency, and repair fluency. Breakdown fluency has to do with the ongoing flow of speech and can be measured by counting the number and length of filled and unfilled pauses. Speed fluency has to do with the speed with which speech is delivered and can be measured by calculating speech rate such as number of syllables per second. Repair fluency has to do with how often speakers use false starts, make corrections, or produce repetitions. Most studies investigating fluency have confounded some of these aspects of utterance fluency. For instance, speech rate is usually calculated as words or syllables per total time (including pauses). With this measure, breakdown fluency and speed fluency are taken together into one measure that encompasses aspects of pausing as well as speed of delivery.
In addition to cognitive fluency and utterance fluency, the third notion of fluency is perceived fluency, which can be defined as the impression that listeners have of the fluency of a certain speech sample (or of a certain speaker, based on a sample).
RELATING UTTERANCE FLUENCY TO PERCEIVED FLUENCY
As Lennon (Reference Lennon1990, p. 391) puts it, fluency “is an impression on the listener's part that the psycholinguistic processes of speech planning and speech production are functioning easily and efficiently.” In identifying which performance qualities (measures of utterance fluency) relate to the listener's impression of fluency (perceived fluency), several studies have examined the relationship between subjective ratings on L2 speech samples and objectively measured aspects of utterance fluency. In these studies, different types of raters have been asked to judge speech samples, including L2 teachers, expert judges such as phoneticians and speech therapists, and untrained judges. In what follows, we will briefly describe these studies.
Lennon (Reference Lennon1990) asked 10 teachers of English to rate four German advanced learners of English at the beginning and end of a 6-month period of residence in Britain. He found that perceived improvements in fluency (as apparent in the ratings by the teachers) were related to an increase in speech rate and mean length of run (mean number of syllables uninterrupted by pauses) as well as to a reduction in silent pause time, number of filled pauses, and repetitions. Riggenbach (Reference Riggenbach1991) investigated spontaneous speech in dialogues of six learners of English as an L2. She related ratings by L2 English instructors to temporal measures of the speaking performances and found that the ratings were related primarily to speech rate and silent pauses. In a larger scale study, Cucchiarini, Strik, and Boves (Reference Cucchiarini, Strik and Boves2002) compared ratings on samples of read speech and spontaneous speech (for the study on read speech, see also Cucchiarini, Strik, & Boves, Reference Cucchiarini, Strik and Boves2000). The spontaneous speech tasks were eight tasks taken from a test in which participants had 15 s (beginner level) to 30 s (intermediate level) to perform each speaking task. For the spontaneous speech samples, 10 teachers of Dutch as an L2 rated fluency for 30 beginner level learners and 30 intermediate level learners of Dutch as a second language. The investigators related the ratings of fluency to objective measures of fluency and found that for beginning learners articulation rate (measured as number of phonemes per second) was the best predictor of perceived fluency, whereas for the intermediate learners the mean length of run was the best predictor.
Two studies asked untrained judges to rate speech samples on fluency (Derwing, Rossiter, Munro, & Thomson, Reference Derwing, Rossiter, Munro and Thomson2004; Rossiter, Reference Rossiter2009). Derwing et al. (Reference Derwing, Rossiter, Munro and Thomson2004) collected speech samples from 20 beginner Mandarin learners of English. Twenty-eight untrained judges rated fluency of the speech samples and it was found that pausing and pruned speech rate (speech rate excluding filled pauses and hesitations) were strongly related to these fluency ratings. Rossiter (Reference Rossiter2009) explicitly aimed at comparing ratings of different groups of judges. She asked experts (L2 teachers and linguistics students), nonexperts, and advanced nonnative speakers to judge 24 English L2 learners with various L1 backgrounds. For all groups of judges, number of pauses per second and pruned speech rate turned out to be very good predictors of perceived fluency.
In sum, irrespective of type of rater (L2 teacher, expert, untrained rater, or nonnative speaker), strong associations between utterance fluency and perceived fluency have been found. Although the measures investigated differed across these studies, all studies found some measure of pausing and some measure of speech rate to be related to the perception of fluency. In addition, some studies have reported that other aspects are also related to ratings on fluency. For instance, Freed (Reference Freed and Freed1995) reports that raters have the impression that, in addition to aspects of fluency, they take grammatical accuracy, vocabulary use, and accent into account. Kormos and Dénes (Reference Kormos and Dénes2004) found that perceptions of fluency are related to linguistic measures such as accuracy and lexical diversity. In their study, three native and three nonnative English teachers judged the English speaking performances of 16 Hungarian speakers on fluency. They found that for native and nonnative judges speech rate, mean length of utterance, phonation time ratio, and the number of stressed words per minute were the best predictors of the fluency scores. In addition, the raters differed regarding the importance they attributed to accuracy, lexical diversity, and mean duration of pauses, as shown by varying correlations between ratings on fluency and these measures. However, with variables that are strongly interrelated and with such a small number of participants, it is difficult to interpret the results of the Kormos and Dénes study. Rossiter (Reference Rossiter2009), however, also showed that listeners’ impression on fluency might be affected by pronunciation, grammar, and vocabulary.
From a methodological perspective, fluency as perceived by listeners, or raters, is dependent on the instructions that the raters receive, and on the definitions and notions the listeners or raters have of the construct of fluency prior to the rating instructions. For this reason, studies that relate listeners’ perception to objective measures of fluency run the risk of being circular. If one instructs raters to pay attention to speech rate and pausing, it is likely that the resulting ratings will be related to the objective measures speech rate and pausing. When no instructions are given prior to the rating, raters will use their own definition of what constitutes fluency to judge the speaking samples. For instance, Kormos and Dénes (Reference Kormos and Dénes2004) and Cucchiarini et al. (Reference Cucchiarini, Strik and Boves2002) gave no specific instructions, whereas Derwing et al. (Reference Derwing, Rossiter, Munro and Thomson2004) as well as Rossiter (Reference Rossiter2009) specifically instructed their raters to pay attention to temporal aspects of speech such as filled and unfilled pauses, false starts, and self-repetitions. It is therefore questionable whether defining fluency as a listener construct will result in the best notion of fluency, especially when it is used as a component of speaking proficiency, as is the case in current oral proficiency assessment. Indeed, a relationship between a subjective rating of speech and an aspect of speech that is objectively measured is no guarantee that differences in the aspect objectively measured are also related to differences in L2 proficiency. It may be the case that the measured aspect of speech is related to other causes of individual differences, such as personality characteristics (e.g., extraversion: see, e.g., Dewaele & Furnham, Reference Dewaele and Furnham1999, Reference Dewaele and Furnham2000; Eysenck, Reference Eysenck1974; Ramsay, Reference Ramsay1968) or personal speaking style.
RELATING UTTERANCE FLUENCY TO COGNITIVE FLUENCY
The studies reviewed above mainly investigated how perceived fluency and utterance fluency are related. Investigating this relation can be important to gain insight into how listeners arrive at judgments, and what aspects of speech are taken into account when judging fluency. Research into the relation between utterance fluency and perceived fluency is important to investigate what constitutes fluency from the point of view from the listener; perception fluency, however, might be irrelevant for determining which aspects of utterance fluency are indicators of ease and efficiency of L2 speaking (cognitive fluency), from the point of view of the speaker.
In order to discover reliable indicators of utterance fluency reflecting how efficiently a speaker can plan and execute his speech, it is important to relate L2 utterance fluency to L2 cognitive fluency. Calculating aspects of utterance fluency such as speech rate and pausing in L2 utterances allows researchers to measure (aspects of) L2 utterance fluency. However, how should one measure aspects of L2 cognitive fluency? If cognitive fluency entails the abilities that a speaker possesses to efficiently plan and execute speech, which abilities should one include, and how should one measure these aspects?
There are two possible routes researchers have taken to investigate the relation between utterance fluency and L2 cognitive fluency. The first is to investigate within speakers, how utterance fluency develops over time. If learners progress with respect to a specific measure of utterance fluency over time, one can assume that this development can be traced to a development of L2 cognitive fluency. If a certain aspect of utterance fluency does not develop over time, while at the same time overall L2 proficiency has developed, one can assume that this aspect of fluency bears no relation to specific L2 cognitive fluency, but possibly is related to general cognitive abilities, or to personal speaking style (assuming that the general cognitive abilities and personal speaking style have not developed over time). The second possibility for relating L2 cognitive fluency to utterance fluency is to do so directly. In what follows, we will briefly describe studies that investigated fluency gains, as well as a study that investigated the relation directly (Segalowitz & Freed, Reference Segalowitz and Freed2004).
O'Brien, Segalowitz, Freed, and Collentine (Reference O'Brien, Segalowitz, Freed and Collentine2007) investigated gain in fluency for 43 learners of Spanish. The students sat a Spanish Oral Profiency Interview at the beginning and end of a semester. For students who had studied abroad, significant gain was found in speech rate, mean length of run without fillers, but not in mean length of run without silent pauses. These results replicated the results of Segalowitz and Freed (Reference Segalowitz and Freed2004), who had also found gains in these fluency measures for students studying abroad. In a study investigating fluency gains over a longer period of time, Towell, Hawkins, and Bazergui (Reference Towell, Hawkins and Bazergui1996) and Towell (Reference Towell2002) followed 12 learners of French over a period of 3 years. They found gains in fluency with respect to mean length of run, speaking rate, but not with respect to mean duration of silent pause. Towell et al. (Reference Towell, Hawkins and Bazergui1996) explain these results as evidence that these learners had internalized procedural knowledge of L2 linguistic features. In terms of Segalowitz's (2010) distinction, these learners had gained L2 cognitive fluency.
Instead of using a longitudinal approach to track development of fluency, Riazantseva (Reference Riazantseva2001) adopted a cross-sectional approach, in which she compared 14 intermediate and 16 advanced learners of English with L1 Russian. A control group of 20 English native speakers performed the same tasks in English. In addition, the Russian participants performed similar tasks in their L1. Riazantseva (Reference Riazantseva2001) compared three measures of breakdown fluency: pause duration, pause frequency, and pause distribution. For all pausing measures, the highly proficient learners outperformed the intermediate learners. For pausing duration, a cross-linguistic difference was found, in that the pause durations in L1 Russian were on average longer than in L1 English. Riazantseva concluded that pausing duration is a language-specific feature, and that with increased proficiency in the L2, initial transfer of these language specific pausing patterns can be overcome. Derwing, Munro, Thomson, and Rossiter (Reference Rossiter2009), in a study comparing Mandarin and Slavic speakers, did not replicate this finding. However, it may be difficult to directly compare the results of these two studies because first, in the study by Derwing et al. (Reference Derwing, Munro, Thomson and Rossiter2009) the participants had lower proficiency, and second, in Derwing et al. (Reference Derwing, Munro, Thomson and Rossiter2009) only pauses longer than 400 ms were considered, which is much higher than Riazantseva's (Reference Riazantseva2001) cutoff of 100 ms.
The study by Segalowitz and Freed (Reference Segalowitz and Freed2004) is, to our knowledge, the only study that directly related utterance fluency to cognitive fluency. The researchers established gain in aspects of fluency, and related this progress to measures of (linguistic) skills. Utterance fluency was measured by analyzing excerpts from Oral Proficiency Interviews, and cognitive skills were measured by using a semantic classification task and an attention control test (repeat and shift task). From both tasks they measured both speed, operationalized by reaction time, and efficiency, operationalized by the coefficient of variation. The coefficient of variation (CV) of the reaction time (RT) is the standard deviation of an individual's RT divided by that person's mean RT and is claimed to be related to automatization of processes (Segalowitz & Segalowitz, Reference Segalowitz and Segalowitz1993). Both tasks were measured in L1 and L2 and subsequently L1 measures of speed (RTs) and efficiency (CVs) were partialed out to calculate residualized scores that reflect performance in L2 compared to L1. They found significant correlations between mean length of run without fillers and lexical access speed (r = .375)Footnote 1 and lexical access efficiency (r = .377). They also found an unexpected negative relation between speech rate and attention control efficiency (r = −.476).
THE CURRENT STUDY
In the current large-scale study, we will also investigate which aspects of L2 utterance fluency are indicators of L2 cognitive fluency and explore to what extent objectively measured aspects of fluency (aspects of utterance fluency) can be explained by measures of L2 linguistic skills (aspects that underlie L2 cognitive fluency). To measure utterance fluency, we administered eight monologue speaking tasks. To measure aspects of L2 cognitive fluency, we constructed a range of tasks tapping L2 linguistic knowledge and processing skills. We have taken a slightly different approach from the one taken by Segalowitz and Freed (Reference Segalowitz and Freed2004). In their study, performance on L2 cognitive skills was measured by partialing out performance on L1 cognitive skills. In this way, they measured aspects of L2 cognitive skills that are unrelated to performance in L1. In the present study, we measure L2 performance on linguistic knowledge and skills without partialing out performance on similar L1 tasks. Note that in this way, we acknowledge that part of the variance of our measures for L2 linguistic skills must be language-independent. For instance, in L2 reaction time tasks, learners who are faster may be faster because they are faster due to general cognitive abilities. In addition, they may be faster due to specific L2 cognitive abilities. Furthermore, it is important to realize that in this study we investigate L2 linguistic knowledge and skills only, while fully acknowledging the fact that cognitive fluency includes nonlinguistic features such as working memory capacity and conceptualizing skills.
On the basis of theories on language production, we constructed tasks to measure L2 cognitive abilities. Producing an utterance involves three main processing stages (e.g., Dell, Reference Dell1986; Dell & O'Seaghdha, Reference Dell and O'Seaghdha1992; Levelt, Reference Levelt1989; Levelt, Roelofs, & Meyer, Reference Levelt, Roelofs and Meyer1999). The first process in speech production is to create the preverbal communicative intention. Second, the message has to be formulated linguistically. During formulation, abstract word representations (lemmas) are selected, grammatical encoding takes place, and corresponding sounds are retrieved (Kempen & Huijbers, Reference Kempen and Huijbers1983). In the third step, the resulting phonological plan is converted into a motor program for the articulators. In addition to these three main processes, speakers monitor their speech to check for errors and for appropriateness of their messages (Levelt, Reference Levelt1983; Postma, Reference Postma2000). Because De Bot (Reference De Bot1992) and Kormos (Reference Kormos2006) maintained the basic distinctions and processes of Levelt's model of speech production in their adaptations of the model for L2 learners, we also use the same distinctions and processes to arrive at tasks tapping L2 cognitive fluency.
To tap knowledge and processing skills that are needed for planning and executing speech, we constructed three knowledge tests (measuring knowledge of vocabulary, grammar, and pronunciation) and several processing tests, tapping lexical retrieval speed (picture naming), the speed with which morphosyntactic knowledge can be used (sentence completion), and the speed with which speech plans can be articulated (response latency and response duration in a delayed picture-naming task). In the delayed picture-naming task, processes concerned with lexical retrieval and phonetic encoding are supposedly completed, and therefore reaction times reflect articulatory skills, pertaining to the retrieval, unpacking, and execution of the motor program (Eriksen, Pollack, & Montague, Reference Eriksen, Pollack and Montague1970; Sternberg, Knoll, Monsell, & Wright, Reference Sternberg, Knoll, Monsell and Wright1988; Sternberg, Monsell, Knoll, & Wright, Reference Sternberg, Monsell, Knoll, Wright and Stelmach1978). With these tasks, we can tap most aspects of L2 linguistic skills that supposedly underlie L2 cognitive fluency.
The measures of utterance fluency that were used in the current study were chosen such that breakdown fluency, speed fluency, and repair fluency were not confounded. We measured number of silent pauses, mean duration of silent pauses, and number of filled pauses (“uhms” and “uhs”) to measure breakdown fluency. To measure speed fluency, we calculated inverse articulation rate, that is, mean duration of syllables (speaking time divided by total number of syllables). In this way, the measures for pausing and for speed of delivery are not confounded. Finally, to measure repair fluency, we used number of corrections and number of repetitions.
In this study, we will first ascertain how the different measures of utterance fluency that cluster theoretically are related in practice. For instance, for breakdown fluency, we measured number of silent pauses, number of filled pauses, and mean duration of pauses. Are these measures more strongly related among each other, than to the measures that belong to the other aspects of utterance fluency? And are measures that characterize different aspects of fluency (e.g., articulation rate and mean duration of pauses) only weakly related (if at all)? Subsequently, we will ascertain to what extent the measures of utterance fluency can be explained by L2 cognitive fluency, in other words, by L2 linguistic knowledge and processing skills.
RESEARCH QUESTIONS
1. To what extent are different measures for the three aspects of L2 utterance fluency (breakdown fluency, speed fluency, and repair fluency) related?
2. To what extent can various measures of L2 utterance fluency in speech be predicted by L2 cognitive fluency as measured by L2 linguistic knowledge and processing skills?
METHOD
The current study used the same participants and tasks as De Jong, Steinel, Florijn, Schoonen, and Hulstijn (2012). In the following, we briefly describe the materials and procedures of the tasks that are relevant to the current research. All tasks, except for the pronunciation task, were piloted with native and nonnative speakers.
Participants
Data were collected from 208 adult L2 learners of Dutch. Because not all participants were able to complete all tasks, we report here on the data of 179 L2 learners. Almost all of the L2 learners were taking Dutch courses at intermediate or advanced level, to prepare for enrolment at a Dutch University. Participants, who replied to our call for participation on a voluntary basis, were paid €25. None of the participants started learning Dutch before the age of 15. The age of the 179 L2 learners ranged from 20 to 56 (M = 29; SD = 6). Of the L2 learners 72% were female. The L2 learners reported 46 different first languages. The languages most frequently reported were German (n = 23), English (n = 18), Spanish (n = 16), French (n = 15), Polish (n = 11), and Russian (n = 10). Participants' length of residence in The Netherlands ranged from 10 months to 20 years (M = 4 years; SD = 4 years and 2 months).
Speaking tasks
Materials. Participants performed eight computer-administered speaking tasks. The tasks were constructed with contrasts on the following three dimensions, in a 2 × 2 × 2 fashion: complexity (complex vs. simple topic), formality (informal versus formal setting), and discourse type (descriptive vs. persuasive). The task instructions specifically stated that participants should try to imagine that they were addressing an audience in each task and participants were instructed to role play accordingly. For each task, the instruction screens provided a photo picture of the communicative situation and one or several visual–verbal cues concerning the topic. See Appendix A for descriptions of the speaking tasks.
Procedure. Each task started with detailed information of the assignment. Participants had 30 s preparation time and 120 s speaking time per task. Participants were urged to do their best in imagining they actually were in the situation described. As a warm-up, participants carried out a practice task.
Utterance fluency. To compute measures of utterance fluency, we made transcripts of all speaking performances, including information about filled pauses, corrections, and repetitions. From these transcripts, number of filled pauses per 100 words, number of corrections per 100 words, number of repetitions per 100 words, and number of syllables were calculated. Using a script written in PRAAT (Boersma & Weenink, Reference Boersma and Weenink2007), number of silent pauses, total duration of speaking time, and total duration of pausing time were measured. This script was run on the soundfiles (without use of the transcripts). Silences of 250 ms or longer were considered as hesitations or pauses, and thus silences shorter than 250 ms, so-called micropauses (see, e.g., Riggenbach, Reference Riggenbach1991) were discarded. From these measures we calculated mean duration of pauses (total pausing time divided by number of silent pauses). Combining the information from the transcripts with the automatic extraction of speaking time and pausing information, we calculated number of silent pauses per 100 words, and mean duration of syllables. Mean duration of syllables is calculated by dividing speaking time by total number of syllables. This is the inverse of articulation rate (see also Crystal & House, Reference Crystal and House1990; Quené, Reference Quené2008). An advantage of using inverse articulation rate is that, in line with all other measures we calculated, it is a measure of disfluency, in the sense that higher values (longer mean syllable times) mean less fluent speech. Another advantage is that this measure follows a more normal distribution than articulation rate.
Vocabulary knowledge
Materials and procedure. For the assessment of productive vocabulary knowledge, a paper and pencil task was administered, consisting of two parts. Part 1 (90 items) elicited knowledge of single words, Part 2 (26 items) elicited knowledge of multiword units. For Part 1, 9 words were selected from each frequency band of 1000 words between words ranked 1 to 10,000 according to the Corpus of Spoken Dutch (CGN; Oostdijk et al., Reference Oostdijk, Goedertier, Eynde, Boves, Martens and Moortgat2002). We used the format suggested by Laufer and Nation (Reference Laufer and Nation1999): for each item, a meaningful sentence was presented with the target word omitted, except for its first letter(s). For Part 2, the target word (part of a multiword unit) was omitted as a whole.
Scoring. Spelling mistakes, and mistakes in inflectional variants were not counted as errors. For each correct response, 1 point was awarded.
Grammar knowledge
Materials and procedure. The grammar task consisted of 142 items covering a range of grammatical features. Knowledge of the following types of grammatical features was assessed: inflectional variants of adjectives (19 items) and verbs (19 items), word order of main clauses and subclauses (33 items), the place of particles (10 items), use of relative pronouns (15 items), possessive pronouns (5 items), dummy pronouns (26 items), choice of auxiliary verbs (10 items), and construction of passive sentences (5 items). We used several task types to assess these features, such as fill in the blank, multiple choice, and reordering of constituents.
Scoring. For each correct response, one point was awarded. We were lenient toward spelling mistakes, and we scored items as correct if the grammatical form that we intended to elicit was correct.
Pronunciation quality
Materials. Sixty mostly monosyllabic target words were selected, covering a broad range of vowels, diphthongs, and consonants. Thirty-six of these words were selected to be presented in lists of words, and the 24 remaining target words were embedded in 15 sentences. Ten of these sentences were also designated to test the quality of the intonation pattern. Finally, to test word-stress knowledge, 10 words with two to four syllables were added.
Apparatus. The presentation of the stimuli was controlled by the E-prime software system (Schneider, Eschman, & Zuccolotto, Reference Schneider, Eschman and Zuccolotto2002a, Reference Schneider, Eschman and Zuccolotto2002b), and speech was recorded on a flash digital recorder (Edirol) with a microphone (48,000 Hz sampling frequency).
Procedure. Participants were instructed to inspect the items at their leisure (without time constraints) before pronouncing the words or sentences. They were asked to read aloud, after pressing the space bar.
Measures. Three trained judges (undergraduate students in phonetic sciences) received payment to rate the responses. For the 36 individual target words, they were asked to rate per word whether the pronunciation of the designated sound was “correct” or “incorrect.” For the 10 multisyllable words, they were asked to rate whether the stress patterns were correct or incorrect. For the sentences, they were asked to rate the (24) target sounds in words as correct or incorrect. Furthermore, for 10 of these sentences an additional judgement on intonation had to be given (correct or incorrect). We used multiple imputation by chained equations to impute missing data (Van Buuren & Oudshoorn, Reference Van Buuren and Oudshoorn1999). The Fleiss κ value between judges was fair (0.57) and the Cronbach α value between judges was satisfactory (0.79). We therefore counted each item as 1 point and calculated sum scores over the three judges.
Lexical retrieval speed
Materials. From the picture set produced by Snodgrass and Vanderwart (Reference Snodgrass and Vanderwart1980) we selected 28 pictures with 100% naming agreement in Dutch (Severens, van Lommel, Ratinckx, & Hartsuiker, Reference Severens, Van Lommel, Ratinckx and Hartsuiker2005). The names belonged to the 2200 most frequent lemmas in the CGN (Oostdijk et al., Reference Oostdijk, Goedertier, Eynde, Boves, Martens and Moortgat2002).
Apparatus. The apparatus was the same as described for the pronunciation quality measure.
Procedure. Participants were instructed to name the pictures as fast and accurately as possible. A fixation cross was presented in the middle of the screen for 1500 ms. Then the picture appeared, which was presented for 2000 ms. After the picture, a blank screen followed for 500 ms. The pictures were presented in a random order identical for all participants. The experimenter noted wrong answers and other deviations from the intended responses.
Measure. The time between the appearance of the picture and the beginning of the response was measured using a script written in PRAAT (Boersma & Weenink, Reference Boersma and Weenink2007). Incorrect responses and outliers were replaced by missing values. Outliers were defined after inspection of the data as RTs below the minimum of 300 ms and RTs higher than 3 SD above the grand mean. In this way, 11% of all picture-naming RTs was replaced. We used multiple imputation by chained equations to impute these missing data (Van Buuren & Oudshoorn, Reference Van Buuren and Oudshoorn1999).
Speed of articulation: Response latency and response duration
Materials and apparatus. The materials and apparatus were the same as the ones used for the lexical retrieval measure (picture naming).
Procedure. Participants carried out the picture naming task once more. This time, however, they were asked to prepare their response to naming a picture but wait with the actual naming of the picture until a cue was given. A fixation cross was presented in the middle of the screen for 500 ms. Then the picture appeared and remained on the screen for 2000 ms. After 2000 ms, the participant heard a short beep, and a green frame appeared on the screen, around the picture. The beep together with the green frame formed the cue for participants to give their response. The picture (with the green frame) remained on the screen for another 1000 ms, during which the participants responded. The pictures were presented in a random order identical for all participants, but in a different order from the procedure tapping lexical retrieval speed. The experimenter noted wrong answers and other deviations from the intended responses.
Measures. We measured response latency as the latency between the auditory cue and the beginning of the response. We measured response duration as the duration of the response, that is, the latency between the beginning and the end of the response (using a script written in PRAAT). We then computed response duration for all correct responses. Incorrect responses and outliers were replaced by missing values. Minimum response time was defined after inspection of the data (minimum 50 ms for articulation latency and pronunciation duration). For both measures, we set the maximum response time to 3 SD above the grand mean. In this way, 13% and 12% of all articulation latency and articulation duration data, respectively, were replaced by missing values. Missing data were imputed as described for the lexical retrieval task.
Sentence building speed
Materials. Participants performed a sentence completion task, in which the completion of the sentence was an alteration of a given sentence, elicited by a cue. The alteration of the sentences always involved a grammatical change that was induced by the written cue following the original sentence. Grammatical changes required adjectival inflection (10 items), verbal inflection of number (10 items), verbal conjugation changing present tense to past tense (10 items), construction of subclauses from main clauses (10 items), or subject–verb inversion in main clauses (10 items). The original sentences were recorded in a noise-free booth by a trained female speaker.
Apparatus. The apparatus was the same as described for the pronunciation quality measure.
Procedure. Instructions were presented on the computer screen. In each experimental trial, first, a fixation cross was presented near the top-left corner of the screen for 1000 ms. Then participants heard a sentence through the headphones while the same sentence appeared simultaneously (in written form) on the screen. The beginning of the altered sentence was presented (in written form) 500 ms after offset of the auditory stimulus, precisely below the first sentence, which remained on the screen. Both the original sentence and the beginning of the altered sentence stayed on the screen for 5000 ms. Participants were instructed to use the content of the first sentence to correctly complete the altered sentence, beginning with the word or words on the screen. The sentences were presented in a random order identical for all participants. The experimenter noted wrong answers and other deviations from the intended responses.
Measure. We measured the period between the cue and the end of the participants' response. We used a script written in PRAAT (Boersma & Weenink, Reference Boersma and Weenink2007) to determine the latencies. We then measured response times for all correct responses (as noted by the experimenter). Incorrect responses and outliers (minimum 1000 ms, and maximum set to 3 SD above the grand mean) were replaced by missing values. In this way, 22% of all data was replaced as missing value (19% were incorrect responses). Missing data were imputed as described for the lexical retrieval task.
RESULTS
We excluded speaking-task performances with speaking times shorter than 10 seconds and shorter than 10 words (1.4% of all data). For the remaining task performances, mean total speaking duration was 57.5 s (SD = 22.5, range = 10.5–118.7 s) with on average 151 words (SD = 61, range = 20–372). For all participants and all tasks we calculated the following fluency measures: number of silent pauses per 100 words, Mean duration of silent pauses (ms), number of filled pauses per 100 words, number of corrections per 100 words, number of repetitions per 100 words, and mean duration of syllables (ms). Outliers for all utterance fluency variables (above or below 3 SD from the overall mean) were removed (4.6% of all data). For mean pause duration, we first log-transformed the data in order to achieve more normally distributed data. The Shapiro–Wilk test showed that for all variables, normality could reasonably be assumed (Ws > 0.9, except for number of repetitions per 100 words, W = 0.88). Table 1 shows, aggregated over participants and tasks, the range across tasks of the utterance fluency measures. The Cronbach α values show that the intertask reliabilities are satisfactory. The last column of Table 1 shows the means and standard deviations over participants.
Range of the fluency measures across tasks, Cronbach α between tasks, and mean (SD) over participants

Aspects of utterance fluency
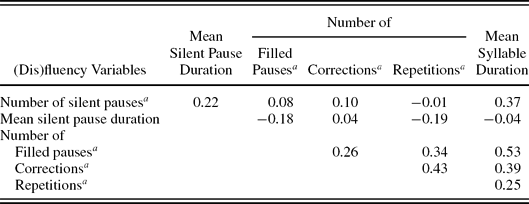
To ascertain how the different measures of utterance fluency are related among each other (RQ1), we computed correlations, with fluency measures aggregated over tasks. In general, the fluency measures were not strongly intercorrelated (Table 2). Most correlations are weak (under 0.3), some are moderate, and only the correlation between mean duration of syllables and number of filled pauses per word is higher than 0.5. It is interesting that the measures that theoretically cluster together did not show higher correlations. This holds for the measures of breakdown fluency (number of silent pauses, mean duration of silent pause, and number of filled pauses) and for the measures of repair fluency (number of corrections and number of repetitions). For breakdown fluency, the Pearson correlations were between r = −.18 and .22. For repair fluency, the relation between number of corrections and number of repairs was somewhat stronger (r = .43). In general, we can conclude that no strong relations between the different measures were found, and that the measures for different aspects of utterance fluency (breakdown fluency and repair fluency) show no stronger correlations amongst each other, than correlations between measures of different aspects.
Correlations between fluency measures, aggregated over eight speaking tasks (N = 179)
aPer 100 words.
Relating measures of utterance fluency to linguistic knowledge and skills
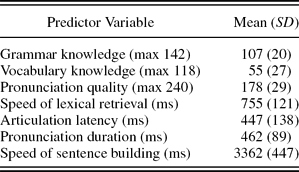
To answer the question to what extent fluency measures can be predicted by linguistic knowledge and processing skills (RQ2), correlations between the fluency measures (aggregated over tasks), and the predictor variables were calculated. As can be gleaned from Table 3, showing the means and standard deviations of all predictor variables, there was considerable variation between participants. This holds for the measures of language knowledge and for the reaction time measures.
Means (standard deviations) of the predictor variables (linguistic knowledge and skills, N = 179)
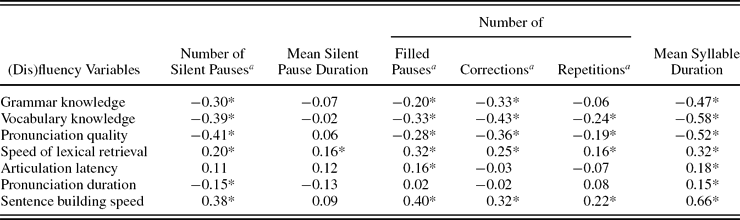
Table 4 shows the bivariate Pearson correlations between all measures of (dis)fluency, and the measures of linguistic knowledge and skills. As can be seen from Table 4, most measures of fluency were significantly related to one or more measures of linguistic knowledge and to one or more measures of speed of processing. The (dis)fluency measure mean silent pause duration, on the other hand, was only (significantly) related to one aspect of linguistic processing skills: speed of lexical retrieval. Regarding the strength of the relations, one can see that for number of pauses per 100 words, number of filled pauses per 100 words, and number of corrections per 100 words, the correlations were weak to moderate (<.45). For the measures mean duration of silent pauses and number of repetitions per 100 words, however, the correlations were all weak (<.25), whereas for the (dis)fluency measure mean syllable duration, some correlations were strong (>.5).
Bivariate Pearson correlations between (dis)fluency variables aggregated over speaking tasks and predictor variables (N = 179)
aPer 100 words.
*p < .05.
Note that we expected that the scores on the language knowledge tasks would be negatively related to the (dis)fluency measures: higher scores on vocabulary, grammar, and pronunciation quality should be related to fewer hesitations and pauses, and a lower mean duration of syllables. At the same time, we expected positive relations between (dis)fluency measures and all language speed measures (speed of lexical retrieval, articulation latency, pronunciation duration, and sentence building speed). Unexpected, therefore, is the significant negative relation between number of silent pauses and pronunciation duration: slower pronunciation of words in the delayed picture naming task is related to fewer silent pauses in a speaking task. An explanation of this finding may be that speakers who tend to pronounce words slowly, use pronunciation times in speaking tasks instead of pausing silently. They are buying time while speaking.
We can conclude from these correlations that most objective measures of fluency are related to both linguistic knowledge and linguistic processing skills. The fluency measure mean duration of pauses is an exception, because it is related significantly (but weakly) to speed of lexical retrieval only.
To assess the predictive power of the combined linguistic knowledge and linguistic skills over each fluency measure, we used regression analyses. To be able to use as much information as possible, we used linear mixed models with task and participant as crossed random effects (Baayen, Davidson, & Bates, Reference Baayen, Davidson and Bates2008) using the lme4 library (Bates & Maechler, Reference Bates and Maechler2010) in R (R Development Core Team, 2010). With linear mixed models we explicitly model the variation between tasks and the variation between participants. In this way, the variation of fluency variables between tasks, as apparent from Table 1, is explicitly modeled and utterance fluency scores were no longer aggregated across tasks. For each fluency variable, we fitted two models: the zero model, only including the random variables participants and tasks, and the alternative model, including the fixed predictor effects. Equations 1 and 2 give the zero and alternative models, where y (ij) represents a fluency measure of individual i (i = 1, 2, . . . , N) on task j (j = 1, 2, . . . , 8); β0 is the intercept for a given fluency variable; and β1 to β7 are the regression weights of the fixed predictor effects: grammar knowledge, vocabulary knowledge, pronunciation quality, lexical retrieval speed, articulation speed, pronunciation speed, and sentence building speed. The random variables are denoted by participants (s) and tasks (t).
 \begin{equation}
y_{(ij)} = \beta _0 + s_i + t_j + \varepsilon _{(ij)} ,
\end{equation}
 \begin{eqnarray}
y_{(ij)} &=& \beta _0 + \beta _1 x_{1i} + \beta _2 x_{2i} + \beta _3 x_{3i} + \beta _4 x_{4i} + \beta _5 x_{5i} \nonumber\\
&& +\, \beta _6 x_{6i} + \beta _7 x_{7i} + s_i + t_j + \varepsilon _{(ij)} .
\end{eqnarray}
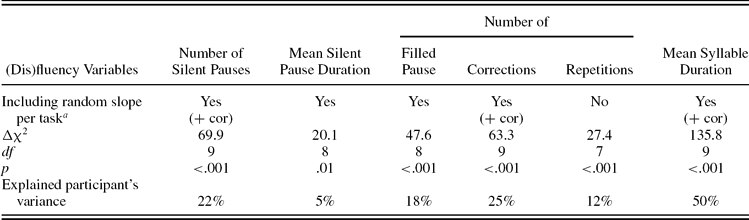
For all dependent variables, the alternative models fitted the data better than the zero models, as measured by changes in log-likelihood. For most fluency measures, adding a random slope per task to the predictor effects slightly improved the model (in terms of Equation 2, this means adding subscripts j to the β weights). For number of silent pauses and number of filled pauses, a random slope for vocabulary knowledge significantly improved the model. Apparently for some tasks, the vocabulary knowledge of the participant had slightly more predictive power for the number of silent pauses and for the number of filled pauses than for other tasks. For the fluency measures number of corrections and mean duration of syllables, a random slope for grammatical knowledge improved the overall model. Finally, for the measure mean duration of silent pauses, a random slope for articulation latency improved the model. Table 5 shows the statistics for the comparisons between the zero and the alternative model for each fluency variable. The first row indicates whether adding a random slope per task significantly improved the alternative model. Furthermore, the first row indicates whether, in that case, adding the corresponding correlation between the intercepts and slopes per task significantly improved the model. For the dependent variables number of silent pauses, number of filled pauses, and mean duration of syllables, this was indeed the case. There was a negative relation between the intercepts of the tasks and the slopes per task. To exemplify this for the dependent variable number of silent pauses, for those tasks that induced in general more silent pauses (i.e., were modeled with larger intercepts), the relation between number of silent pauses and vocabulary knowledge is more strongly negative (i.e., have larger negative coefficients) than for those tasks that induced fewer pauses in general.
Statistics for comparisons between zero and alternative models
Note: Zero models only include means for tasks and participants as predictors; alternative models also include linguistic skills as predictors. Random slopes per task (and a correlation between the intercepts and varying slopes of tasks) are added to the alternative model if these significantly improved the model (as established by significant changes in log-likelihood).
aThis row indicates whether including a random slope improved the model, and if so, whether including the correlation between slope and intercept further improved the model. See the text for details.
The second to fourth rows of Table 5 show that indeed for all dependent variables, the alternative models fitted the data better than the zero models in terms of changes in log-likelihood, showing the chi-square statistic, degrees of freedom, and p values for each comparison. Note that the number of degrees of freedom is 7 for comparisons between the alternative and zero model if no random slopes are added to the model, 8 for comparisons between alternative and zero models if a random slope per task was added for a particular variable, and 9 if the corresponding correlation between random slope per task and intercept was added.
To compare how well the combined L2 linguistic knowledge and skills predict the measures of utterance fluency (RQ2), we need to calculate explained variance. In the linear mixed models, we can do this by comparing the amount of variance between participants in the zero models, with amount of variance between participants in the alternative models (thus comparing the variances of s in the Equations 1 and 2). In the zero models, all the variance between participants is captured by the random effect for participants s. In the alternative models, the predictor effects (the linguistic skills variables) have explained some of this variance, and thereby diminished the variance between participants in the random effect for participants. In other words, by calculating the portion of variance of the random effect for participants in the alternative models compared to the zero models, we compute the amount of explained variance as explained by linguistic knowledge and processing skills (see Van der Slik, Reference Van der Slik2010, for a comparable approach to calculating explained variance in mixed models). The bottom row of Table 5 shows the percentages of explained variance computed in this way for all fluency variables. As can be seen from Table 5, the amount of variance explained ranges between as low as 5% (for mean duration of pauses) to as much as 50% (for mean duration of syllables).
For breakdown fluency, this means that mean silent pause duration can hardly be predicted by L2 linguistic skills. Number of silent pauses and Number of filled pauses are much better predicted (22% and 18%, respectively). For repair fluency, number of repetitions is predicted less well (12%) than number of corrections (25%). Finally, the variable that represents speed fluency, Mean syllable duration (i.e., inversed articulation rate), could be predicted for 50% of the variance and is therefore the variable that is most strongly related to L2 linguistic skills.
DISCUSSION
In L2 research on speaking fluency, most studies begin with defining fluency. For instance, Lennon (Reference Lennon and Riggenbach2000, p. 26) defines fluency as “the rapid, smooth, accurate, lucid, and efficient translation of thought or communicative intention into language under the temporal constraints of on-line processing.” In addition to agreeing on a definition, researchers have strived to agree on aspects and measures of fluency. Previous research on measures of speaking fluency often focused on the relation between perceptions of fluency in ratings to objective measures of fluency (e.g., Riggenbach, Reference Riggenbach1991; Rossiter, Reference Rossiter2009). Such an approach will lead to an agreement on measures of fluency that describe what listeners perceive as important in fluent speech. Note that in this way, the underlying definition of fluency must come from the descriptors and instructions given to the raters in these studies, or, if these are not given, from the individual beliefs and notions the raters have of fluency. This type of research has led to consensus on several objective measures of fluency such as speech rate, number of silent and filled pauses, and other hesitations such as repetitions and repairs. From these studies we can conclude, therefore, that speech rate, number of silent and filled pauses, number of repetitions and repairs are related to the listener's impression of fluency. It is unclear, however, which measures of fluency are actually related to linguistic knowledge and ease and efficiency of linguistic processes. Segalowitz (Reference Segalowitz2010) urges researchers to distinguish between utterance fluency, cognitive fluency, and perceived fluency. In our study, we have endeavored to identify measures of utterance fluency that are indicators of L2 cognitive fluency, by investigating to what extent individual differences in measures of utterance fluency can be explained by individual differences in L2 linguistic knowledge and skills that underlie L2 cognitive fluency (RQ2).
To investigate RQ2, 179 speakers of Dutch L2 performed eight speaking tasks, allowing us to measure the three facets of utterance fluency, as defined by Tavakoli and Skehan (Reference Tavakoli, Skehan and Ellis2005). Breakdown fluency was measured by calculating number of silent pauses, mean silent pause duration, and number of filled pauses in each speaking task. Repair fluency was calculated as number of corrections and number of repairs. Speed fluency, finally, was calculated as mean syllable duration (inverse articulation rate).
To measure L2 cognitive fluency, participants performed a range of specific tasks tapping aspects of L2 cognitive fluency. We used a paper and pencil vocabulary task and a paper and pencil grammar task to gauge the amount of declarative knowledge of their L2, and a pronunciation task to measure their knowledge and skill of pronunciation. To measure processing skills, participants performed a number of timed tasks: a picture-naming task tapping lexical selection speed, a delayed picture-naming task tapping articulation and pronunciation speed, and a sentence completion task tapping the speed of morphosyntactic processes.
With respect to the measures of utterance fluency, we found that the different measures were in general not strongly related among each other (RQ1). Moreover, for the aspects breakdown and repair fluency, for which more than one measure was available, these separate measures were not strongly related among each other (e.g., for the aspect breakdown fluency: number of silent pauses, number of filled pauses, and duration of silent pauses). Apparently, even though theoretically these measures cluster together, they are not strongly related. This finding does not question that the three separate aspects of fluency are indeed distinct aspects. For breakdown fluency, for instance, it may be the case that filled pauses and silent pauses are, in terms of cognitive explanations, caused by the same problems in the speech planning process, but that where some speakers use silent pauses when they encounter a specific problem in their speech planning process, others will use filled pauses to stall for time when encountering that same problem.
With respect to the second research question, we did find that all measures of utterance fluency were related to one or more measures underlying cognitive fluency (linguistic knowledge and processing skills). Linear mixed models were used to gauge the strength of the relations between the combined linguistic knowledge and skills on the one hand, and the measures of fluency on the other hand. The amount of explained variance ranged between as little as 5% and as much as 50%. The measure that could best be explained by linguistic knowledge and skills was mean syllable duration (50%). The measure mean silent pause duration was only explained for 5% of the variance.
Previous research on fluency gains over time corroborates these findings. We studied directly how aspects of utterance fluency are related to abilities of L2 cognitive fluency, but one can also study which aspects of fluency develop over time. Towell et al. (Reference Towell, Hawkins and Bazergui1996) and Towell (Reference Towell2002) did not find evidence that L2 speakers, after studying abroad, diminished duration of silent pauses. Furthermore, previous studies did find fluency gains with respect to speech rate (comparable to duration of syllables in the present study), where L2 speakers had a faster delivery of speech over time (Segalowitz & Freed, Reference Segalowitz and Freed2004; Towell et al., Reference Towell, Hawkins and Bazergui1996). On the basis of Segalowitz's (Reference Segalowitz2010) fluency typology, we assume that such developments over time must be related to development of specific L2 cognitive fluency as opposed to other general cognitive abilities, or personal speaking style.
Our study differs from most studies investigating measures of fluency in that it disaggregated separate facets of utterance fluency. Most studies have looked at a measure that incorporates both pausing as well as speed of speech, namely, speech rate calculated as number of syllables divided by total time. The present study, on the other hand, looked at pausing and speed separately, by measuring mean syllable duration (inverse articulation rate excluding pauses). We found that this measure, mean syllable duration, was most strongly related to linguistic knowledge and skills. Cucchiarini et al. (Reference Cucchiarini, Strik and Boves2002) investigated whether articulation rate or speaking rate was related to perception of fluency, and observed that for spontaneous speech, speaking rate (number of phonemes divided by total time) was related to perception of fluency (r = .57 for 28 beginner level students, r = .37 for 29 intermediate level students), whereas articulation rate was not (r = .07 and .05, respectively). Using the data of the present study, we can compare the relation between speaking rate and articulation rate on the one hand, and the measures of linguistic knowledge and skills that underlie L2 cognitive fluency on the other hand. If we compute speaking rate (by including pauses), we find that the explained variance is much lower: 35% compared to 50% for inverse articulation rate. Apparently, whereas speaking rate (including pauses) is an indicator of perceived fluency, inverse articulation rate (excluding pauses) is a stronger indicator of L2 cognitive fluency.
CONCLUSION
We agree with Segalowitz (Reference Segalowitz2010) that it is important to distinguish between cognitive fluency, utterance fluency, and perceived fluency. To investigate from the speaker viewpoint which aspects of utterance fluency are the result of ease and efficiency of processing, one should relate utterance fluency to cognitive fluency rather than to perceived fluency. In our study, we have done so by relating L2 utterance fluency to measures that underlie L2 cognitive fluency, such as knowledge of vocabulary and grammar and the speed with which this knowledge can be used. General cognitive abilities, personal speaking style, and cross-linguistic differences in hesitation behaviour (e.g., Riazantseva, Reference Riazantseva2001) are aspects of cognitive fluency that will also impact (L2) utterance fluency. It is interesting to note that for native speakers, disfluencies are seen as solutions to problems rather than problems, because they are signals used by the speakers to inform their interlocutors of upcoming delays (e.g., Clark, Reference Clark2002; Clark & Wasow, Reference Clark and Wasow1998). A limitation of the current study is that L1 fluency behavior as well as L1 base measures for linguistic skills (e.g., for the reaction time measures) were not controlled for. However, with our approach we were able to relate L2 cognitive fluency to L2 utterance fluency and by doing so we have found that some measures of utterance fluency cannot be seen as indicators of L2 cognitive fluency, whereas others are quite good indicators of L2 cognitive fluency. Mean duration of silent pause, for instance, is not a good indicator for L2 cognitive fluency. We may speculate that this measure is related to personal speaking style or to personality characteristics. If this were indeed the case, we can expect that this measure would transfer from speakers’ L1 speaking style to their L2. Future research should further investigate the skills, both linguistic and nonlinguistic, that constitute L2 cognitive fluency and make further efforts to relate utterance fluency to cognitive fluency. Language testing practice stands to benefit from this research because instructions to raters on how to rate fluency may include information concerning which aspects of utterance fluency are in fact related to ease and smoothness of L2 linguistic processing.
APPENDIX A: DESCRIPTION OF SPEAKING TASKS
Practice task: Participant is talking to a friend who may also want to participate in the research project. The participant explains the friend what he knows about participating, and how to get to the University from the Central Station.
Task 1 (simple, informal, descriptive): Participant speaks on the phone to a friend, describing the apartment of friends who have recently moved house. The participant uses a picture on the screen to describe the apartment.
Task 2 (simple, formal, descriptive): Participant, who witnessed a road accident some time ago, is in a courtroom, describing to the judge what had happened. Four pictures in a row show the accident that happened: a woman on a bicycle getting hit by a car.
Task 3 (simple, informal, argumentative): Participant advises his/her sister on how to choose between (or combine) child care, further education, and paid work.
Task 4 (simple, formal, argumentative): Participant is present at a neighborhood meeting in which an official has just proposed building a school playground, separated by a road from the school building. Participant gets up to speak, takes the floor, and argues against the planned location of the playground. A picture on the screen shows the setting of the meeting including a map of the school, road, a park, and the proposed playground.
Task 5 (complex, informal, descriptive): Participant tells a friend about the development of unemployment among women and men over the last 10 years. The screen shows a graph with time on the x axis and unemployment figures on the y axis. Two lines (one for men and one for women) are plotted in the graph.
Task 6 (complex, informal, argumentative): Participant discusses the pros and cons of three means of transportation (public transportation, bicycle, automobile) with regard to solving the problem of traffic congestions.
Task 7 (complex, formal, descriptive): Participant works at the employment office of a hospital and tells a candidate for a nurse position what the main tasks in the vacant position are. The screen shows a pie chart with pictures of the different main tasks for the nurse position.
Task 8 (complex, formal, argumentative): Participant, who is the manager of a supermarket, addresses a neighborhood meeting and argues which one of three alternative plans for building a car park he/she prefers. A table describes the pros and cons of the three alternative plans.
ACKNOWLEDGMENTS
This research was funded by the Netherlands Organisation for Scientific Research NWO Grant 254-70-030 (to J.H.H. and R.S.). We thank our research assistants Renske Berns, Andrea Friedrich, and Kimberley Mulder. We thank Ton Wempe and Rob van Son for their technical support and advice and Jelle Goeman for his advice on statistics. Finally, we thank three anonymous reviewers for their helpful comments on an earlier version of this article.