Introduction
Trichinosis is a globally food-borne zoonotic disease (Abuelenain et al. Reference Abuelenain, Fahmy, Elshennawy, Fahmy, Ali, Hammam and Abdel-Aziz2021) caused primarily by Trichinella spiralis (T. spiralis), the most dangerous human species (Sarhan et al. Reference Sarhan, Etewa, Al-Hoot, Arafa, Shokir, Moawad and Mohammad2021) and ranked among the top ten food-borne parasites worldwide (Abd-elrahman et al. Reference Abd-Elrahman, Dyab, Mahmoud, Mostafa and Elossily2020). It is estimated that approximately 10,000 cases occur (Gottstein et al. Reference Gottstein, Pozio and Nockler2009) annually, with a 0.2% mortality rate (Etewa et al. Reference Etewa, Mohammad, Saleh, Abdelbary and Mostafa2020). Most human infections are caused by accidental ingestion (Yadav & Temjenmongla Reference Yadav and Temjenmongla2012) of viable infective encysted T. spiralis larvae in raw or undercooked pork and pork products (Gottstein et al. Reference Gottstein, Pozio and Nockler2009). In humans, the disease is usually associated with varied symptoms (Ashour et al. Reference Ashour, Abou Rayia, Saad and El-Bakary2016), and severe complications can seriously jeopardize human health depending on the number of larvae ingested (Ibrahim et al. Reference Ibrahim, Sarhan, Farag and Mohamed2019).
Trichinosis has two phases: an intestinal phase and a muscular phase (Sarhan et al. Reference Sarhan, Etewa, Al-Hoot, Arafa, Shokir, Moawad and Mohammad2021). Trichinella has the distinct ability to undergo intracellular growth in muscle cells, which constitute a protective nurse cell for the parasite (Elgendy et al. Reference Elgendy, Othman, Hasby Saad, Soliman and Mwafy2020). T. spiralis larvae can survive successfully in these nurse cells due to their ability to support angiogenesis for nutrition (Allam et al. Reference Allam, Mostafa, Lotfy, Farag, Fathi, Moneer and Shehab2021). Chronic trichinosis results in a strong interaction with the host immune system that leads to inflammation of the affected muscles (Elgendy et al. Reference Elgendy, Othman, Hasby Saad, Soliman and Mwafy2020).
During infection, trichinosis is characterized by an inflammatory response that occurs in different tissues and organs (Sarhan et al. Reference Sarhan, Etewa, Al-Hoot, Arafa, Shokir, Moawad and Mohammad2021), which aims to destroy the parasite but also poses a threat to the host (Muñoz-Carrillo et al. Reference Muñoz-Carrillo, Muñoz-López, Muñoz-Escobedo, Maldonado-Tapia, Gutiérrez-Coronado, Contreras-Cordero and Moreno-García2017). Therefore, anti-inflammatory drugs are expected to help protect hosts (Kazemzadeh et al. Reference Kazemzadeh, Mohammad and Mohammad2014). However, the widely prescribed steroidal or non-steroidal anti-inflammatory drugs have several adverse effects that limit their use (Elgendy et al. Reference Elgendy, Othman, Hasby Saad, Soliman and Mwafy2020). Accordingly, there is a desperate need to search for new and safe compounds with potent anti-inflammatory and anti-parasitic effects against both the intestinal and muscular stages of trichinosis (Shalaby et al. Reference Shalaby, Moghazy, Shalaby and Nasr2010).
Olibanum (OL) is a natural oleo gum resin extracted from Boswellia plants (Al-Ghandour et al. Reference Al-Ghandour, Ahmed, Salem, Tealeb, Mohamed and Yousef2020). The Ebers Papyrus is the earliest written record of OL as a medication (Ammon Reference Ammon2016). Accumulated data indicate that OL possesses several mechanisms of action. It has a predominant anti-inflammatory effect that is mediated through inhibition of inflammatory molecules such as prostaglandin E, cyclooxygenase 2, inducible nitric oxide synthetase, and 5-lipoxygenase, leading to inhibition of leukotriene generation (Efferth & Oesch Reference Effertha and Oesch2020). The anti-inflammatory effect of OL is related to its content of anti-inflammatory compounds such as boswellic acids (Ammon, Reference Ammon2016). Furthermore, Borrelli et al. (Reference Borrelli, Capasso, Capasso, Ascione, Aviello, Longo and Izzo2006) observed that the predominant anti-inflammatory activity of OL reduced functional problems in the gut by enhancing motility, inhibiting diarrhea without constipation, inhibiting contraction of intestinal smooth muscles, and controlling acetylcholine and barium chloride-induced diarrhea.
Another mechanism of action added to its anti-inflammatory effect is that it down-regulates pro-inflammatory cytokines (TNFα, IL-1β, IL-2, INFγ, IL-6, and IL-12) and up-regulates anti-inflammatory cytokines (IL-4, IL-10), suggesting that it has an immunomodulatory effect (Efferth & Oesch Reference Effertha and Oesch2020). The oil has also shown immunostimulating activity by stimulating the innate and adaptive immune response due to its content of novel polysaccharides, which encourages its use in several immune disorders as an important immunotherapy as well as vaccination purposes (Hosain et al. Reference Hosain, Ghosh, Bryant, Arivett, Farone and Kline2019). In addition, the physiological maintenance of the integrity and function of the enterocytes is mediated by its antioxidant activity (Al-Ghandour et al. Reference Al-Ghandour, Ahmed, Salem, Tealeb, Mohamed and Yousef2020).
Based on the previous data the present study was conducted to determine whether OL extract has any promising therapeutic effects on the intestinal and muscular stages of experimental trichinosis.
Materials and methods
Sample size calculation
The sample size was calculated based on the study’s design and objectives. This experimental study evaluated and compared the therapeutic effects of OL extract and ABZ on the intestinal and muscular stages of experimental trichinosis. The sample size was 130 with a 95% confidence interval and 80% statistical power.
Experimental animals
A total of 130 laboratory-bred pathogen-free, Swiss- male albino mice, 6–8 weeks old, weighing 20–25 g each, were acquired from Theodor Bilharz Research Institute’s (TBRI) Biology Supply Center (Giza, Egypt). They were kept in the TBRI animal houses, which were maintained at a constant room temperature of (22 ± 2 ○C). The animals had free access to the usual food and water.
Parasite and mice infection
The isolate of T. spiralis was initially acquired from the diaphragms of diseased pigs slaughtered at a slaughterhouse in Cairo (Cairo, Egypt). By digesting the muscles of infected pigs, infective larvae were recovered (Basyoni & El-Sabaa Reference Basyoni and El-Sabaa2013), collected by sedimentation, and repeatedly washed in 0.85% physiological saline (Sarhan et al. Reference Sarhan, Etewa, Al-Hoot, Arafa, Shokir, Moawad and Mohammad2021). The larvae were routinely stored in the TBRI laboratory by successive passage through mice according to the method outlined by (Gamble, Reference Gamble1996).
The mice were orally infected with T. spiralis larvae, as described by Dunn & Wright (Reference Dunn and Wright1985). Each mouse’s inoculum was adjusted to contain approximately 300 larvae (Attia et al. Reference Attia, Mahmoud, Farrag, Makboul, Mohamed and Ibraheim2015).
Drugs
Reference drug
Albendazole suspension (ABZ) was procured from Pharma Cure Pharmaceuticals Company in Cairo, Egypt (Albendazole 400 mg/10 mL). ABZ was administered orally via gastric tube with an aqueous solution at a dose of 50 mg/kg for three consecutive days in the monotherapy group and at a dose of 25 mg/kg for three consecutive days in the groups that received combined treatment. The importance of the combination lies in reducing the side effects produced by ABZ by reducing its dosage and replacing it with a safer herbal drug (Attia et al. Reference Attia, Mahmoud, Farrag, Makboul, Mohamed and Ibraheim2015).
Preparation of OL extract
Olibanum was purchased as solid, white-colored masses from the website (iHerb.com). The chemical identification was performed in accordance with Abdallah et al. (Reference Abdalla, Ramadan, Mohamed, El-Deeb, Al-Khadrawy and Badawy2011). First, OL gum was finely ground, and then 50 gm of the powder was dissolved in 200 mL of 70% ethanol for two days. After centrifuging the solution, the supernatant was evaporated to produce a sticky component. Subsequently, the crude extracts were recovered using a rotary evaporator. Finally, the extract was dissolved in dimethyl sulfoxide, an organic solvent, and stored at 4 °C (Jebelli et al. Reference Jebelli, Khalaj-Kondori, Bonyadi, Hosseinpour-Feizi and Rahmati-Yamchi2019). The extract was administered orally through a gastric tube at doses of 25 and 50 mg/kg/d according to Ammon (Reference Ammon2010), who reported that oral doses to mice of 50 mg/kg and less were stimulatory while higher doses tended to show the opposite.
Experimental design
The experimental mice were divided into seven main groups as follows: (1) GI (healthy control, 10 mice)—healthy, uninfected, untreated mice; (2) GII (infected control, 20 mice)—infected untreated group; (3) GIII (OL25, 20 mice)—infected and treated with OL at a dose of 25mg/kg; (4) GIV (OL50, 20 mice)—infected and treated with OL at a dose of 50 mg/kg; (5) GV (ABZ 50, 20 mice)—infected and treated with ABZ at a dose of 50 mg/kg; (6) GVI (OL25+ ABZ 25, 20 mice)—infected and treated with OL at a dose of 25 mg/kg in addition to ABZ at a dose of 25 mg/kg; (7) GVII (OL50+ ABZ 25, 20 mice)—infected and treated with 50 mg/kg of OL and ABZ at a dose of 25 mg/kg.
Each of these seven groups was divided into two subgroups according to the euthanizing day: subgroup A [(mice were euthanizedon the 6th day post infection (d.p.i.) (Intestinal phase)] and subgroup B [(mice were euthanized on the 35th d.p.i.) (Muscular phase)] (Shoheib et al. Reference Shoheib, Shamloula, Abdin and El-Segai2006). Treatment against the adult stage was initiated on the second d.p.i and on day 30 p.i against encysted larvae.
Euthanizing animals and sample collection
On days 6 and 35 p.i., mice were euthanized through cervical dislocation. Previously, the animals had been anesthetized using isoflurane (Etewa et al. Reference Etewa, Mohammad, Saleh, Abdelbary and Mostafa2020). The effects of the drugs on adult worms were evaluated using the small intestines of mice sacrificed on day 6 p.i (Intestinal phase). Approximately 1 cm of the mid-intestinal area was preserved in 10% formalin for histopathological analysis. The remaining intestine was utilized to count adult worms of T. spiralis. On day 35 p.i. muscle samples were obtained from mice sacrificed to evaluate the effects of the drugs on larvae (Muscular phase). Parasitological, histopathological, and immunohistochemical (IHC) analyses were performed on intestinal and muscular samples.
Serial blood samples were acquired by the technique of retro-orbital sinus blood extraction using a capillary at 6, 14, 21, and 35 d.p.i. and collected in 2 mL Eppendorf tubes without anticoagulant. The sample was then centrifuged at 103 rpm for 10 min. The collected sera were stored at -20 °C until biochemical analysis (Muñoz-Carrillo et al. Reference Muñoz-Carrillo, Gutiérrez-Coronado, Muñoz-Escobedo, Contreras-Cordero, Maldonado-Tapia and Moreno-García2021).
Parasitological assessment
Isolation and counting of adult worms in intestines
The small intestines were separated, longitudinally opened, and washed with physiological saline. They were cut into 1-cm pieces and incubated at 37 °C in 10 mL physiological saline for 2 h (Elgendy et al. Reference Elgendy, Othman, Hasby Saad, Soliman and Mwafy2020) to permit adult worms to migrate from the intestine to the container (Basyoni & El-Sabaa Reference Basyoni and El-Sabaa2013). Three washes were performed using physiological saline. The fluid was collected and centrifuged at 2000 rpm for 3 min (Elgendy et al. Reference Elgendy, Othman, Hasby Saad, Soliman and Mwafy2020). The supernatant was decanted and the sediment was examined in a few drops of saline under a dissecting microscope to count adult worms (Basyoni & El-Sabaa Reference Basyoni and El-Sabaa2013). The worm reduction rate was calculated using the following formula:
 $$ {\displaystyle \begin{array}{l}\underline {\mathrm{Worm}\ \mathrm{reduction}\ \mathrm{rate}}=\left[\right(\mathrm{average}\ \mathrm{number}\ \mathrm{of}\ \mathrm{parasites}\ \mathrm{in}\ \mathrm{the}\ \mathrm{control}\ \mathrm{group}\\ \hbox{--} \mathrm{average}\ \mathrm{number}\ \mathrm{in}\ \mathrm{the} \mathrm{treatment}\ \mathrm{group}\left)/\mathrm{average}\ \mathrm{number}\ \mathrm{of}\ \mathrm{parasites}\\ \mathrm{in}\ \mathrm{the}\ \mathrm{control}\ \mathrm{group}\right]\;\mathrm{x}\;100\%\;\left(\mathrm{Huang}\ \mathrm{et}\hskip0.35em \mathrm{al}.\hskip0.35em 2020\right).\end{array}} $$
Counting the number of encysted larvae in muscles
On day 35 p.i. mice were euthanized, and their muscles were extracted and cut into pieces. For digestion, these muscles were incubated at 37 °C for 1 h in a solution of 1% HCL, 1% pepsin, and 200 mL distilled water with continuous stirring (Elgendy et al. Reference Elgendy, Othman, Hasby Saad, Soliman and Mwafy2020). Next, using a 50- mesh/inch sieve, the digested muscles were filtered to remove large particles. The larvae were collected with a 200-mesh/inch sieve. The T. spiralis larvae were recovered and washed twice with distilled water before being suspended in 150 mL of tap water (Ashour et al. Reference Ashour, Abou Rayia, Saad and El-Bakary2016). Under an inverted microscope, the number of sedimented larvae was determined (Esmat et al. Reference Esmat, Abdel-Aal, Shalaby, Fahmy, Badawi, Elmallawany, Magdy, Afife and Shafi2021).
Biochemical assay
Biochemical assay of liver enzymes
The hepatic enzymes, aspartate transferase (AST) and alanine transferase (ALT), were measured using blood sera. In accordance with the test kit manufacturer’s recommendations, the enzyme activity was represented as U/L (Adicon Clinical Laboratories, Shanghai, China).
Measurement of IL-10 in serum samples
Using a sandwich enzyme-linked immunosorbent assay (ELISA), IL-10 was found in serum samples from mice (ab108870-IL-10 mouse ELISA kit, UK). The amounts of IL-10 in serum samples were measured as directed by the manufacturer and expressed as pg/mL.
Histopathological examinations
At 6 d.p.i., intestinal specimens from each mouse (1 cm from the junction of the proximal 1/3 and distal 2/3) were dissected (Nassef et al. Reference Nassef, El Sobky and Afifi2010). At 35 d.p.i., several sections were cut from diaphragm, thorax, tongue, heart, and leg muscles of each mouse (Attia et al. Reference Attia, Mahmoud, Farrag, Makboul, Mohamed and Ibraheim2015). All specimens were fixed in 10% formalin, dehydrated, and subsequently embedded in paraffin blocks. Formalin-fixed, paraffin-embedded sections (4 μm thickness) were prepared and stained with hematoxylin and eosin for routine histopathological examination.
At both the intestinal and muscular phases, the degree of inflammation was graded as follows: 0 (complete absence of inflammatory cells), 1 (mild inflammation), 2 (moderate inflammation), and 3 (severe inflammation) (Shalaby et al. Reference Shalaby, Moghazy, Shalaby and Nasr2010). For statistical purposes, scores 0 and 1 were pooled together as low inflammatory scores while scores 2 and 3 were pooled together as high inflammatory scores.
CD8+ IHC staining
Several sections were cut from the paraffin-embedded blocks, followed by deparaffinization in xylene and rehydration in a graded series of alcohol. Antigen retrieval consisted of boiling 10 mL of citrate buffer (pH 6.0) for 20 min, followed by cooling to room temperature. The slides were incubated with a purified rabbit monoclonal antibody to CD8 at room temperature for one night (cat no. ab209775, Cambridge, United Kingdom). Subsequently, using phosphate-buffered saline (PBS), the optimal dilution was 1:2000. All slides were deparaffinized with xylene and then rehydrated in ethanol solutions of decreasing concentration. Antigen retrieval was performed using microwave heating (20 min; 10 mmol/citrate buffer, pH 6.0) after inhibition of endogenous peroxidase activity (15 min of hydrogen peroxidase). After applying the primary antibody to the slides, they were rinsed with PBS overnight at room temperature in a humidity chamber. They were then incubated with the secondary antibody for 15 min before being washed again with PBS. Finally, a modified labelled avidin-biotin reagent was used for 20 min to detect the bound antibody, followed by a PBS rinse. The diaminobenzidine solution 0.1% was utilised as a chromogen for 5 min, and 5–10 min was spent counterstaining the slides with Mayer’s haematoxylin. Omission of the primary antibody served as a negative control (Attia et al. Reference Attia, Mahmoud, Farrag, Makboul, Mohamed and Ibraheim2015).
Interpretation of IHC results for CD8+ T lymphocytic cells
The presence of a brown membranous stain in inflammatory T cells was considered positive in different studied groups (Etewa et al. Reference Etewa, Mohammad, Saleh, Abdelbary and Mostafa2020). CD8+ T cells were quantified per 10 High Power Field and expressed as mean ± standard deviation (SD). Furthermore, CD8+ marker expression was evaluated for: (1) Expression percentage: at 200X magnification, positive cells were counted and assigned a percentage exceeding 200 cells (Bahnassy et al. Reference Bahnassy, Zekri, El-Houssini, El-Shehaby, Mahmoud, Abdallah and El-Serafi2004); (2) Intensity of the stain: graded as mild (+), moderate (++) or strong (+++); (3) Histo-score (H score). The following formula was utilised to calculate the H score for all positive specimens. H score = 1 X % of cells with mild staining + 2 X % of cells with moderate staining + 3 X % of cells with strong staining; then a score of 0–300 was assigned (Aeffner et al. Reference Aeffner, Wilson, Martin, Black, CLL, Bolon, Rudmann, Gianani, Koegler, Krueger and Young2017).
Statistical analysis
All data were analyzed with SPSS version 22 (SPSS Inc., Chicago, IL, USA). All data sets were subjected to Shapiro–Wilk tests to ensure normal distribution. This study included both quantitative and qualitative data. Quantitative data are expressed as mean ± standard deviation (SD). The Kruskal–Wallis test was used to estimate the difference between means of quantitative variables. Qualitative data were expressed as number and percent (%). The chi-square test was used for comparison between qualitative data. The significance of differences between groups was determined by one-way analysis of variance (ANOVA) followed by Tukey’s post-hoc test. A P value <0.05 was considered statistically significant.
Results
Parasitological assessment results
Parasitological assessment results at 6 d.p.i
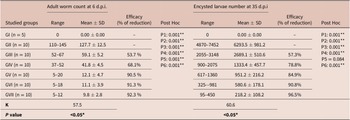
The average number of adult worms declined significantly (P < 0.05) across all treated groups. The mean adult count in GIIA was 127.7 ± 12.5. Compared to GIIA, administration of OL50 mg in GIVA significantly reduced the mean number of adult worms (40.7 ± 2.9), with an acceptable drug efficacy of 68.1% (P < 0.05). The lowest number of adult worms (9.4 ± 3.1) with the highest drug efficacy of 92.6% was detected in GVIIA, whereas the least reduction was observed in GIIIA with a drug efficacy of 53.7 % (Table 1).
Comparison between different studied groups regarding adult worm count at 6 d.p.i. and encysted larvae number at 35 d.p.i.

n, number of infected mice; SD, standard deviation; K, Kruskal-Wallis test; *, statistically significant; **: Statistically highly significant
P1: Comparison between group II and Group III P2: Comparison between group II and Group IV P3: Comparison between group II and Group V
P4: Comparison between group II and Group VII P5: Comparison between group IV and Group V P6: Comparison between group IV and Group VII
Parasitological assessment results at 35 d.p.i
The average number of larvae in GIIB was 1428.3 ± 177.2. OL 50 mg administration in GIVB resulted in a statistically significant reduction in the mean number of encysted larvae (324 ± 27.2) compared to GIIB (P < 0.05), with an acceptable drug efficacy of 77.3%. The most effective treatment with significant reduction in the average number of T. spiralis larvae was in GVIIB (72.7 ± 21.4), with 94.9% efficacy (P < 0.05). The least reduction was detected in GIIIB, with an efficacy of 57.6% (Table 1).
Biochemical results
Liver enzymes measurement results
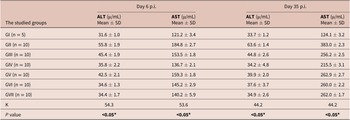
Throughout the experiment, a significant rise in ALT and AST levels was detected in GII. The administration of OL in GIII & GIV and ABZ in GV on days 6 and 35 p.i. significantly decreased (P < 0.05) the abnormal levels of ALT and AST in infected mice. The greatest reduction was realized in GIV (Table 2).
Comparison between different studied groups regarding concentrations of serum liver enzymes (ALT & AST) at 6 and 35 d.p.i.

n, number of infected mice; ALT, alanine transferase enzyme; AST, aspartate transferase enzyme; SD, standard deviation; K, Kruskal-Wallis; *, statistically significant.
IL10 detection results
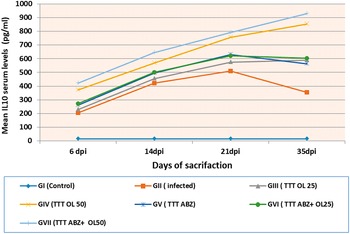
In GI, the mean serum concentration of IL-10 was extremely low (15.8 ± 1.2 pg/mL). IL-10 level was augmented starting at 6 d.p.i in all infected and treated groups. In GII, IL-10 was elevated on day 6 (205.1 ± 29.8 pg/mL), gradually increased until it reached a peak on day 21 (511.4 ± 27.5 pg/mL), and then decreased at the end of the study on day 35 (354.7 ± 30.6 pg/mL). In GIV, the mean IL-10 level at 6 d.p.i was 372.8 ± 27.3 pg/mL, and it increased until the end of the experiment at 35 d.p.i. (851.8 ± 24.9 pg/mL). Throughout the experiment, IL-10 levels rose significantly (P < 0.05) compared to GII. GV demonstrated elevated levels of IL-10 on day 6 (261.1 ± 23.2 pg/mL), day 14 (494.7 ± 23.1 pg/mL), day 21 (630.1 ± 28.4 pg/mL), and then declined at day 35 (562.6 ± 36.4 pg/mL). Throughout the study, these levels were significantly lower than those detected in GIV mice (P < 0.05) but significantly higher than in GII mice. Combined treatment with OL50 mg and ABZ 25mg in GVII showed a significant increase in IL-10 production when compared with all the studied groups (P < 0.05). Therefore, the administration of OL led to both a significant increase in IL-10 levels and a change in the pattern of sustained increase throughout the experiment (Figure 1).
IL-10 serum levels of mice in all studied groups at different times throughout the study. The results are represented by the mean ± SD per each group.

Histopathological results
Histopathological results at 6 d.p.i
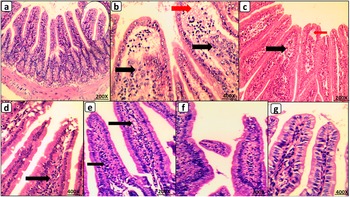
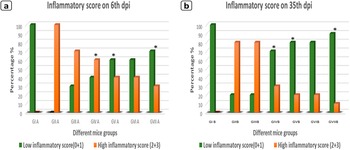
The histopathological examination of GIA revealed no pathological changes and normal architecture of villi. In the lamina propria and submucosa, GIIA evaluation revealed a dense chronic lymphoplasmacytic inflammatory infiltrate with few eosinophils, and all mice in this group had a high inflammatory score. A total of 40% of the mice had a low inflammatory score (P < 0.05) following administration of OL50 mg in GIVA. Compared to GII A, GVA demonstrated marked improvement and a significant reduction in the inflammatory score (P < 0.05). Compared to GIIA, GVIIA treated with OL 50 mg and ABZ exhibited significant tissue improvement, with an appearance similar to GIA and a significant reduction in the inflammatory score (P < 0.05) (Figure 2 & Figure 4a).
Intestinal phase of T. spiralis infected mice at 6 d.p.i. stained by H & E. (a) GI A with normal histology, the inset showed normal villous architecture; (b) GII A showing flattening of villi with widening of its core by oedema (red arrow) and dense chronic lymphoplasmacytic inflammatory infiltrate (black arrow); (c) GIII A with slight histological improvement with widening of core of many villi by oedema (red arrow) and chronic inflammatory infiltrate (black arrow); (d) GIV A exhibiting normal villous architecture with reduced number of inflammatory cells in villous core compared to infected group (black arrow); (e) GV A demonstrated marked improvement and a significant reduction in inflammatory infiltrate (black arrow); (f) GVI A with nearly similar morphology to GV A; (g) GVII A with normal villous architecture and marked reduction of lamina propria inflammatory infiltrate, (200X for A, C, E, & F and 400X for inset of A, B, D, & G).

Histopathological results at 35 d.p.i
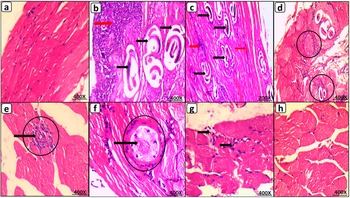
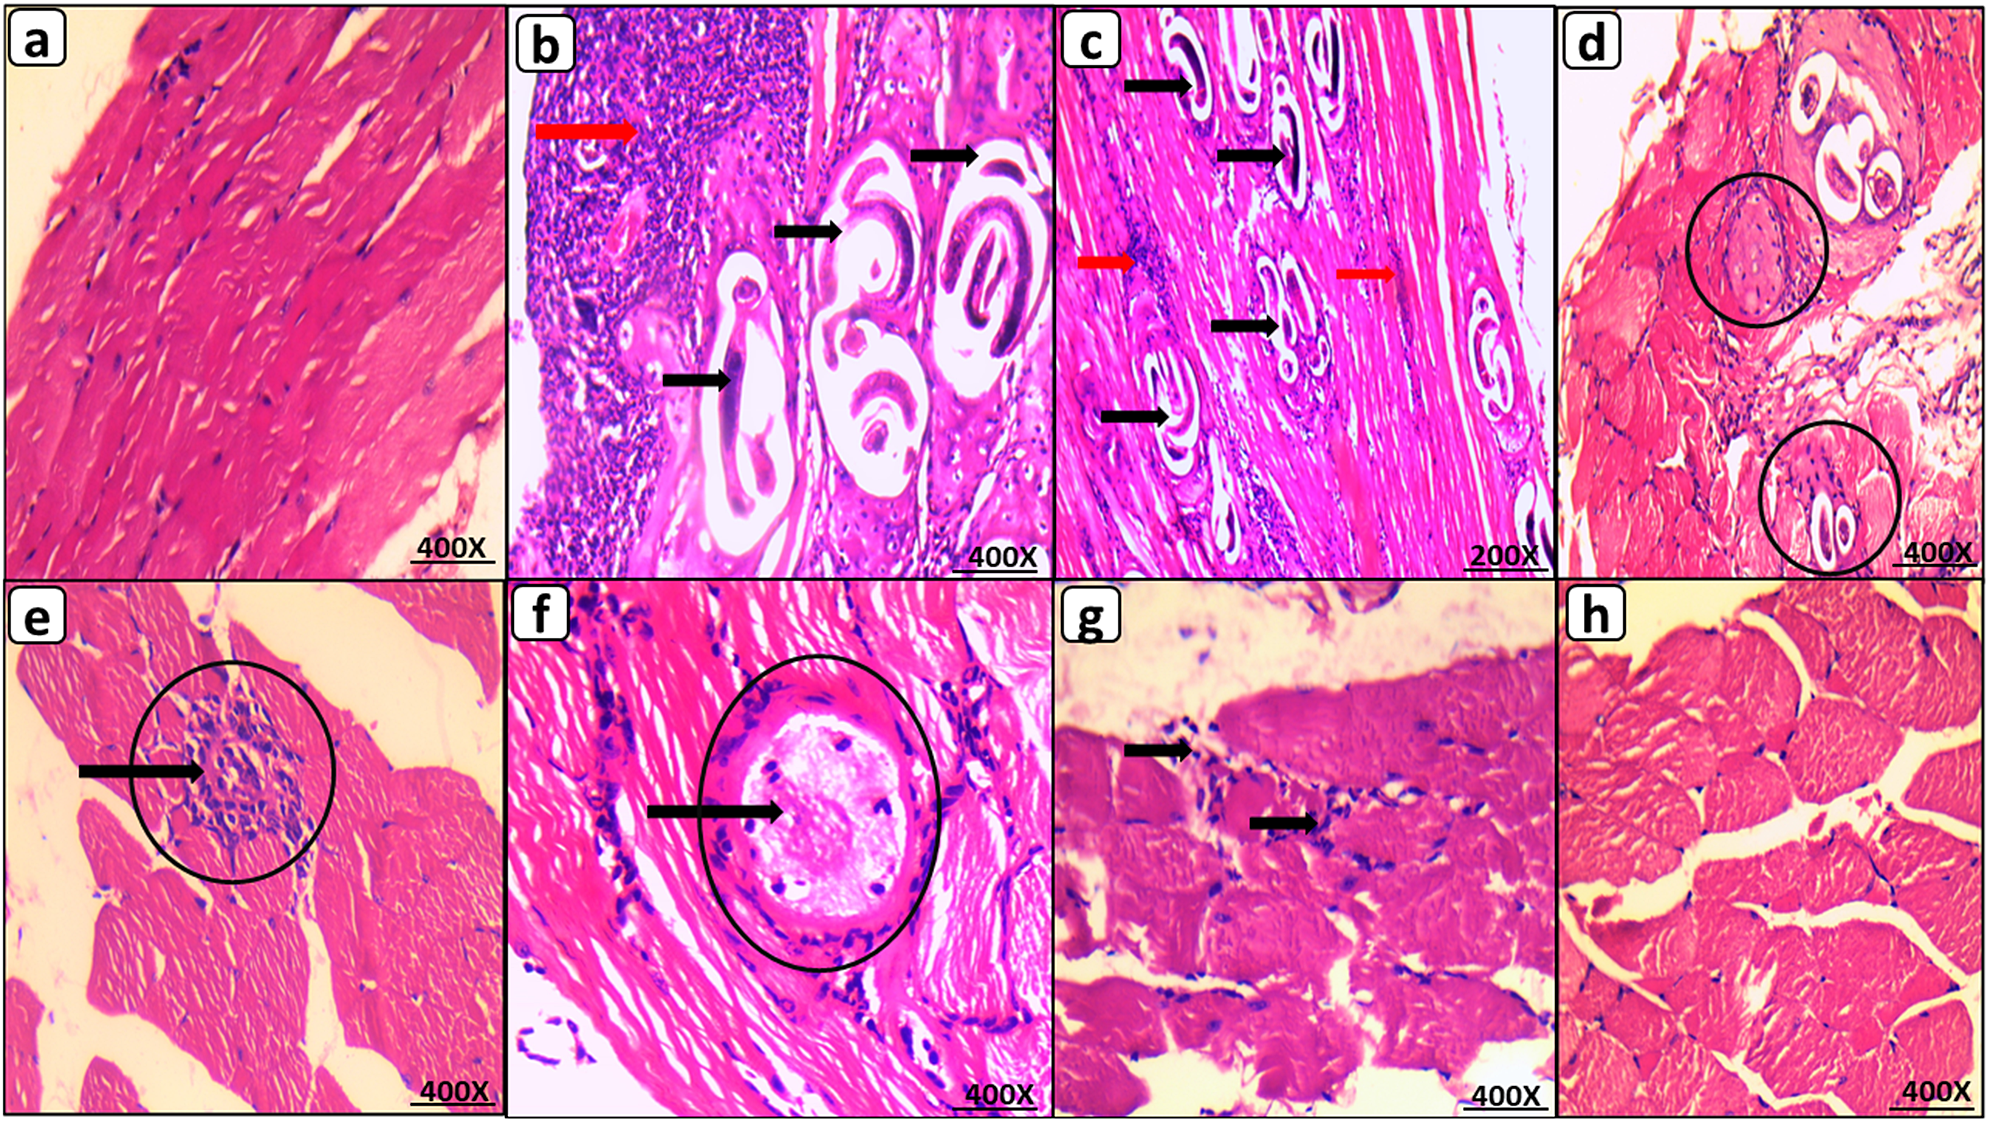
The histopathological examination of GIB muscle tissues revealed normal muscle tissue. Whereas GIIB revealed many encysted T. spiralis larvae diffusely located in the sarcoplasm of muscle bundles and surrounded by a large number of chronic inflammatory cells comprising lymphocytes, plasma cells, eosinophils, and histiocytes. Moreover, 80% of the GIIB mice had a high inflammatory score. Mice administered 50 mg of OL had fewer encysted larvae than mice in GIIB. The majority of these larvae exhibited degenerative changes, including areas of capsule thinning and splitting into thin layers, areas of breakdown, vacuolization, and inflammatory cell infiltration. Compared to GIIB, this group’s inflammatory score improved significantly (70% of mice had a low inflammatory score, P < 0.05). In contrast, encysted larvae were virtually nonexistent in GVIIB. Furthermore, significant improvement in the inflammatory score was observed compared to GIIB (90% of mice had a low inflammatory score, P <.05). (Figure 3 & Figure 4b).
Muscular phase of T. spiralis infected mice on 35 d.p.i. stained by H&E. (a) GI B with normal muscle histology; (b) GII B showing multiple encysted T. spiralis larvae diffusely present in muscles sarcoplasm (black arrow) surrounded by many chronic inflammatory cells (red arrow); (c) GIII B showing similar histological picture to GII B with many encysted T. spiralis larvae (black arrow) surrounded by chronic inflammatory infiltrate (red arrow); (d) & (e) GIV B with reduced number of degenerated larvae (black circles) invaded by inflammatory cells (black arrow); (f) GV B with improved morphology showing markedly degenerated larvae (black circles) invaded by inflammatory cells (black arrow); (g) GVI B with nearly similar picture to GV B showing chronic inflammatory infiltrate within degenerated muscle bundles; (h) GVII B with restoration of near normal muscle histology and complete absence of larvae, (200X for C and 400X for A, B, D, E, F, G, & H).
(a) Comparison between the studied groups regarding inflammatory score at 6 d.p.i. *P < 0.05 vs GII A; (b) Comparison between the studied groups regarding inflammatory score at 35 d.p.i. Data were expressed as percentage (n = 5 in GI B and 10 in all other groups). Post hoc test was used to make group comparison, *P < 0.05 vs GII B.

CD8+ IHC results
CD8+ IHC results at 6 d.p.i
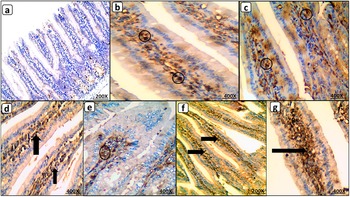
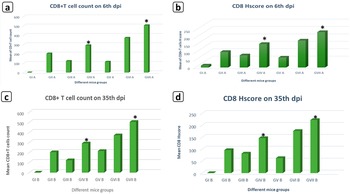
GIA revealed a very low density of infiltrating CD8+ T cells. GIIA revealed a low CD8+ T cell infiltration density, with a mean ± SD of 220.8 ± 23.8 positive cells and a mean ± SD of 105.0 ± 14.1 for the CD8+ H score. GIVA demonstrated a significantly higher density of CD8+ T cells than GIIA. The density of CD8+ infiltration was significantly higher in GVIIA than in GIIA, with a mean ± SD of 522.2 ± 29.3 positive cells (P < 0.05) and a mean ± SD of 239.0 ± 16.4 for the CD8+ H score. The administration of ABZ alone resulted in a significant decrease in CD8+ infiltration density in GVA compared to GIIA (Figure 5 & Figure 7a,b).
CD8+ IHC in intestinal phase. (a) GI A negative for CD8+ IHC; (b) GII A with low density of CD8+ T cells (black circles); (c) GIII A with few CD8+ T cells (black circles); (d) GIV A with high density of CD8+ T cells (black arrow); (e) GV A with low density of CD8+ T cells (black circles); (f) GVI A with increased CD8+ T cells (black arrow); (g) GVII A with dramatic increase of CD8+ T cells (black arrow), (IHC 200X for A & F and 400X for B, C, D, E, & G).

CD8+ IHC results at 35 d.p.i
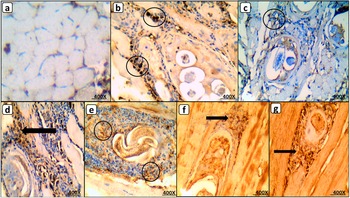
GIB was completely negative for CD8+ IHC. GIIB revealed a low CD8+ infiltration density. GIVB demonstrated a significantly higher density of CD8+ infiltration than GIIB, with a mean ± SD of 291 ± 33.1 positive cells and a mean ± SD of 147 ± 23.5 for the CD8+ H score. Compared to GIIB, the density of CD8+ infiltration increased dramatically and significantly in GVIIB, where the mean ± SD of positive cells was 505 ± 23.6, and the CD8+ H score was 223 ± 25.7. The administration of ABZ alone resulted in a significant decrease in CD8+ infiltration density in GVB compared to GIIB (Figure 6 & Figure 7c,d).
CD8+ IHC in muscular phase. (a) GI B negative for CD8+ IHC; (b) GII B with low density of CD8+T cells (black circles); (c) GIII B with few CD8+ T cells (black circle); (d) GIV B with high density of CD8+T cells (black arrow); (e) GV B with low density of CD8+ T cells (black circles); (f) GVI B with increased CD8+ T cells (black arrow); (g) GVII B with marked increase of CD8+T cells (black arrow), (IHC 400X for all).

(a) Comparison between the studied groups regarding CD8+ T cells count at 6 d.p.i.; (b) Comparison between the studied groups regarding CD8+ H score at 6 d.p.i. *P < 0.05 vs GII A; (c) Comparison between the studied groups regarding CD8+T cells count at 35 d.p.i.; (d) Comparison between the studied groups regarding CD8+ H score at 35 d.p.i. Data were expressed as mean ± SD (n = 5 in GI B and 10 in all other groups). Post hoc test was used to make group comparison. *P < 0.05 vs GII B.

Discussion
The standardization of trichinosis treatment has not yet occurred, and the curative efficacy of anti-parasitic drugs has not been convincingly demonstrated (Sun et al. Reference Sun, Li, Yuan, Wang, He, Xie, Gao, Cheng, Qian, Jiang, Wang, Zhan, Fang and Yang2019). Trichinosis is typically treated with benzimidazole derivatives, such as mebendazole and ABZ (Basyoni & El-Sabaa Reference Basyoni and El-Sabaa2013). However, several limitations have emerged during its clinical use (Shalaby et al. Reference Shalaby, Moghazy, Shalaby and Nasr2010) such as limited absorption and emerging resistance (Prichard Reference Prichard2007). In addition, severe systemic adverse drug reactions have been reported, while others suspect it to be a carcinogen (Shalaby et al. Reference Shalaby, Moghazy, Shalaby and Nasr2010; Yadav & Temjenmongla Reference Yadav and Temjenmongla2012).
Several studies have advocated using natural products (Yadav & Temjenmongla Reference Yadav and Temjenmongla2012), particularly those derived from well-tolerated herbal sources with minimal side effects (Gilleard & Beech Reference Gilleard and Beech2007). One such product is OL, which has been used since antiquity as a treatment for many inflammatory conditions such as arthritis, asthma, and inflammatory bowel disease (Ammon Reference Ammon2016). In addition, it has antiparasitic activities against many protozoa, such as Trypanosoma brucei rhodesiense (East African Human Trypanosomiasis, sleeping sickness), Plasmodium falciparum (Tropical Malaria) (Schmidt et al. Reference Schmidt, Kaiser and Brun2011), and Giardia lamblia trophozoites (Al-Ghandour et al. Reference Al-Ghandour, Ahmed, Salem, Tealeb, Mohamed and Yousef2020). Nevertheless, very little is known about its anthelminthic activities. As far as we know and after a comprehensive review of literature, the effect of OL on T. spiralis has not been clarified. In the present study, the in vivo anti-parasitic and anti-inflammatory effects of OL alone or in combination with ABZ at different graded concentrations, 25 and 50 mg during both the intestinal and intramuscular phases of T. spiralis infection, was investigated.
A significant reduction in the parasite burden in intestinal and muscle tissues was observed in treated mice compared to infected-control mice. The highest efficacy of the drug with the lowest burden of adult worms and muscle larvae was observed in the group that received the combination of OL 50 mg and ABZ 25 mg. OL administration significantly reduced the number of adult worms and muscle larvae with higher efficacy in the muscular phase than the intestinal phase. In addition, stronger findings for OL 50 mg relative to OL 25 mg strongly suggests that OL has dose-dependent anti-trichogenic effects. In addition, the group treated with ABZ 50 mg also resulted in a significant decrease in the number of adult intestinal worms and the number of muscular larvae. Interestingly, the efficacy of the OL extract was more prominent in the muscular phase than in the intestinal phase, in contrast to ABZ, which showed a more prominent effect in the intestinal phase than in the intramuscular phase.
Prior literature from other disease models is consistent with our findings. Al-Ghandour et al. (Reference Al-Ghandour, Ahmed, Salem, Tealeb, Mohamed and Yousef2020) reported that the mean count of Giardia trophozoites in the intestinal wash of the OL-treated group was significantly less than the control-infected group. Abdallah et al. (2011) discovered that OL doses of 10, 15, and 20 mg/kg/day inhibited the multiplication of G. lamblia in vivo in a dose-dependent manner. In addition, Schmidt et al. (Reference Schmidt, Kaiser and Brun2011) reported that serratol (Oleoresin of B. serrata) has in vitro antiprotozoal activity against Trypanosoma brucei rhodesiense (East African Human Trypanosomiasis, sleeping sickness) and Plasmodium falciparum (Tropical Malaria).
Regarding liver function tests, the current research revealed that T. spiralis infection led to a significant elevation of ALT and AST levels throughout the course of the experiment. Elevated ALT and AST indicate liver damage, and this may be a consequence larval migration (Gamble et al. Reference Gamble, Wisnewski and Wasson1997) or detoxification of the drug and metabolites of the parasite stages (Abuelenain et al. Reference Abuelenain, Fahmy, Elshennawy, Fahmy, Ali, Hammam and Abdel-Aziz2021). Similar results were reported by Basyoni & El-Sabaa (Reference Basyoni and El-Sabaa2013) and Abuelenain et al. (Reference Abuelenain, Fahmy, Elshennawy, Fahmy, Ali, Hammam and Abdel-Aziz2021).
A significant reduction in ALT and AST levels was observed in treated mice compared to infected-control mice. However, slightly different results were recorded by Abuelenain et al. (Reference Abuelenain, Fahmy, Elshennawy, Fahmy, Ali, Hammam and Abdel-Aziz2021), who found that ALT was decreased in ABZ-treated mice, while AST was still elevated when compared to control-infected mice. In contrast, Arise & Malomo (Reference Arise and Malomo2009) noted that ALT and AST activities were significantly elevated in ABZ-treated animals and hypothesized that repeated administration of ABZ might impair hepatocyte integrity and affect their normal functions.
Notably, a greater decrease in the abnormal activities of ALT and AST was observed in mice treated with OL 50 mg than the decrease obtained by ABZ monotherapy. These results indicate that OL was less irritating to hepatocytes than ABZ, and this is inconsistent with Eltahir et al. (Reference Eltahir, Fawzy, Mohamed, Alrehany, Shehata and Abouzied2020), who reported that Boswellia serrate (BS) may have hepatoprotective properties.
Histopathological examination revealed marked inflammation in intestinal and muscular tissues caused by T. spiralis infection. Several previous studies have reported similar results (Abou Rayia et al. Reference Abou Rayia, Saad, Ashour and Oreiby2017; Elguindy et al. Reference Elguindy, Ashour, Shamloula and Aboul Assad2019; Etewa et al. Reference Etewa, Mohammad, Saleh, Abdelbary and Mostafa2020; Nassef et al. Reference Nassef, Moharm, Atia, Brakat, Abou Hussien and Mohamed2018; Shalaby et al. Reference Shalaby, Moghazy, Shalaby and Nasr2010). The present study revealed an improvement in histopathological changes with both treatments in both phases of trichinosis as evidenced by a significant decrease in the number of inflammatory cells, a low inflammatory score, and normal villous architecture at the level of the intestine and a reduced number of degenerated larvae with their surrounding cellular infiltrates and increased regenerative muscles at the muscular phase. The most significant improvement was observed in mice treated with a combination of OL 50 mg and ABZ 25 mg, whose appearance was comparable to that of the non-infected control group in both phases. Of note, OL 50 mg had a superior effect to OL 25 mg. Interestingly, the efficacy of OL was greater in the muscular phase than in the intestinal phase, in contrast to ABZ, which demonstrated a greater effect in the intestinal phase than in the muscular phase, as demonstrated by previous ABZ studies (Caner et al. Reference Caner, Döşkaya, Değirmenci, Can, Baykan, Uner, Başdemir, Zeybek and Gürüz2008; Prichard Reference Prichard2007).
Previous studies are consistent with our findings in other disease models. Al-Ghandour et al. (Reference Al-Ghandour, Ahmed, Salem, Tealeb, Mohamed and Yousef2020) reported that the histopathological changes caused by Giardia infection in the duodenum and jejunum improved in the OL-treated group. Liu et al. (Reference Liu, Wu, Chen, Büchele, Bian, Dong, Huang, Ren, Zhang, Hou, Simmet and Shen2014) reported that a boswellic acid-containing extract reversed the S. japonicum egg-induced hepatic granulomatous inflammatory reaction and fibrosis in treated mice. Likewise, other authors have demonstrated that boswellic acid extracts mitigate pulmonary and colonic fibrosis in rats (Ali & Mansour Reference Ali and Mansour2011; Latella et al. Reference Latella, Sferra, Vetuschi, Zanninelli, D’angelo, Catitti, Caprilli and Gaudio2008).
Notably, besides the anti-inflammatory effect of OL (Ammon Reference Ammon2016), another mechanism of action has been reported in that OL downregulates T helper1 (TH1, CD4+ T cells) and the secretion of pro-inflammatory cytokines (IL2, IFN-γ), while T helper2 (TH2, CD8+ T cells, also known as cytotoxic T cells) and the secretion of anti-inflammatory cytokines (IL-4, IL-10) are upregulated (Huang et al. Reference Huang, Chen, Liang, Xu, Jiang, Liu and Zhou2022). The primary function of CD8+ T cells is believed to be the prevention of immunopathology during infection (Stäger & Rafati Reference Stäger and Rafati2012). In addition, its secretory anti-inflammatory cytokine, IL-10, is required for an effective intestinal immune response as well as the reduction of local and regional inflammation during the early stages of muscle infection (Beiting et al. Reference Beiting, Bliss, Schlafer, Roberts and Appleton2004).
For IL-10 serum level, measurements were taken on days 6, 14, 21, and 35 p.i. The present study demonstrated that post-infection IL-10 rose on day 6, gradually increased until it reached a peak on day 21, and then decreased on day 35 p.i. Similar results were observed by other authors who reported a significant increase in IL10 serum levels during early phase of T. spiralis infection (Bakir et al. Reference Bakir, Attia, Mahmoud and Ibraheim2017; Muñoz-Carrillo et al. Reference Muñoz-Carrillo, Gutiérrez-Coronado, Muñoz-Escobedo, Contreras-Cordero, Maldonado-Tapia and Moreno-García2021; Song et al. Reference Song, Xu, Wang, Yang, Bai, Pang, Wang, Yu, Liu, Liu and Sun2019). These observations contradict those of Dvorožňáková et al. (Reference Dvorožňáková, Hurníková and Kołodziej-Sobocińska2011), who discovered that the production of IL-10 cytokine was moderately inhibited during the intestinal phase of Trichinella infections from day 5 to day 10 p.i. This disparity may be because IL-10 was measured in vitro using splenocytes from mice infected with a low dose of larval infection (ten larvae of T. spiralis).
Administration of OL 50 mg significantly altered serum levels of IL-10 in the form of a significant increase that persisted until the end of the experiment. This pattern differed from that observed in the infected group. On the other hand, the ABZ-treated group also exhibited a significant increase in serum IL-10 levels, but these levels were significantly lower than those detected in OL-treated mice throughout the study and showed a similar pattern to those detected in the infected group. In contrast, the group that received a combination of OL 50 mg and ABZ 25 mg had the highest serum concentration of IL-10 in a similar pattern to the OL 50 mg monotherapy group.
Our findings of an increase in serum IL-10 levels in OL treated mice were supported by additional research. Marefati et al. (Reference Marefati, Beheshti, Memarpour, Bayat, Shafei, Sadeghnia, Ghazavi and Hosseini2020) demonstrated that pre-treatment with AKBA, one of the active ingredients in Boswellia serrata resin (OL), improved hippocampal IL-10 levels. Chevrier et al. (Reference Chevrier, Ryan, Lee, Zhongze, Wu-Yan and Via2005) stated that the delivery of the resin extract dissolved in sesame oil displays immunomodulatory characteristics in vitro and encourages a change from a TH1 response to a TH2 response in the cytokine production profile by murine splenocytes.
For CD8+ T cells IHC results, T. spiralis infection resulted in increase in CD8+ T cells expression in the infected tissues (intestine and muscle) compared to the healthy control mice. Likewise, Karmansaka et al. (Reference Karmansaka, Houszka, Mista and Stefaniak1994) showed that numerous CD8+ T cells were observed in the intestines of mice infected with T. spiralis. Additionally, Gomez-Morales et al. (Reference Gomez-Morales, Mele, Sanchez, Sacchini, De Giacomo and Pozio2002) observed in vitro increase in CD8+ T cell expression during the muscular phase of trichinosis in humans. However, Dvorožňáková et al. (Reference Dvorožňáková, Hurníková and Kołodziej-Sobocińska2011) reported that the number of splenic CD8+ T cells in T. spiralis infected mice significantly elevated until day 10 p.i., i.e., during the intestinal phase, while the increase at the muscle phase did not occur until day 60 p.i.
Olibanum 50 mg administration either alone or in combination with ABZ 25 mg, significantly increased the mean number of CD8+ T cells in the affected tissues (intestine and muscle). However, this increase was greater during the muscular phase than during the intestinal phase. In contrast, ABZ monotherapy significantly reduced the density of CD8+ T cell infiltration compared to the infected group. This finding cannot be explained and warrants further study. According to Gomez-Morales et al. (Reference Gomez-Morales, Mele, Sanchez, Sacchini, De Giacomo and Pozio2002), an increase in the number of CD8+ T cells is accompanied by an increase in the number of memory cells. Therefore, these findings could indicate that OL may have a protective effect against T. spiralis infection, a possibility which needs more research.
Conclusion and recommendations
Olibanum’s anti-inflammatory and immunomodulatory properties make it an effective anti-parasitic agent against T. spiralis infection. OL is more effective at the muscular phase than the intestinal phase. OL has dose-dependent anti-trichogenic effects; as such, it may be considered a promising future therapy for T. spiralis infection. Therefore, additional research is required to standardize the dosage for an optimal anti-trichogenic effect. Also, OL induced an increase in CD8+ T cells and production of the anti-inflammatory cytokine IL-10. Thus, we suggest it may have an immunomodulatory effect in trichinosis, which warrants further investigation.
Acknowledgments
The authors wish to thank the Faculty of Medicine and National Liver Institute, Menoufia University, for providing most of the required facilities.
Financial support
This research did not receive any specific grant from funding agencies in the public, commercial, or not-for-profit sectors, and all costs were paid by the authors.
Competing interest
The authors declare none. All authors have approved the submission of this manuscript. The results have not been previously published and are not being considered for publication in another journal.
Ethical standard
Following the approval of TBRI’s institutional ethical committee, all animal care and procedures were conducted per the National Research Council’s Guide for the Care and Use of Laboratory Animals. IRB No. 5/2022PATH8 was granted on behalf of the Ethics Committee for Scientific Research at the Faculty of Medicine, Menoufia University, Egypt.