The term hypoplastic left heart syndrome describes a group of cardiac malformations in which there is hypoplasia or atresia of the aortic valve along with hypoplasia or virtual absence of the left ventricle and hypoplasia of the ascending aorta. Also found is mitral stenosis, hypoplasia, or atresia. Approximately one-sixth of patients with significant hypoplasia of the left ventricle have an atrioventricular septal defect, with the common atrioventricular valve committed predominantly to the dominant right ventricle. My task is to address the assessment of the tricuspid valve in all these patients with hypoplastic left heart syndrome.
Anatomy
The tricuspid valve normally has three leaflets, positioned antero-septally, inferiorly, and septally, with three commissures located in anteroseptal, antero-inferior and infero-septal locations, the leaflets being supported by anterior, inferior and medial papillary muscles. The morphology of the valve is variable in hypoplastic left heart syndrome. Stamm5 and his colleagues looked at 82 pathologic specimens from patients having classical hypoplasia of the left ventricle. Overall, one-eighth of these tricuspid valves had only two identifiable leaflets. One-third were moderately dysplastic, having thickened, less mobile leaflets with nodular free edges, shortened tendinous chords and obliterated interchordal spaces. In two of the valves, there was an accessory orifice, and one showed Ebstein's malformation.
The majority of abnormalities were found in hearts with patent but stenotic mitral valves. These hearts with hypoplastic left heart syndrome and mitral stenosis tended to have a shallow supraventricular crest, an abnormal subvalvar tricuspid tension apparatus with abnormal papillary muscles, and dysplasia of the tricuspid valvar leaflets. Their study5 also revealed that the support of the free edge of the septal leaflet was related to the morphology of the ventricular septum. In four-fifths of hearts with combined mitral and aortic valve atresia, the septal surface was concave to the right ventricular cavity (Fig. 1). The septal leaflet was then supported by many additional muscles arising from the septal surface. The septal surface was concave to the right ventricular cavity in one-fifth of the hearts with mitral stenosis and aortic atresia, and in one-quarter of the hearts with aortic atresia or combined mitral and aortic stenosis. In the majority of these hearts, the septum was either straight or convex, as seen with normal hearts (Fig. 1). The number of direct cords arising from the septum was higher in these hearts. In hearts with a minute left ventricle, the septum becomes functionally part of the free wall of the right ventricle, giving the cavity an almost circular shape, with a concave septal surface. In hearts with a more pronounced ventricular septum, the usual structure of the septal part of the tricuspid valve is preserved, but the overall arrangement of the valve and its function are more problematic.
Figure 1.
Contours of the septum in hearts from patients with hypoplastic left heart syndrome. Reproduced with permission from Stamm et al.5
Echocardiographic assessment of the tricuspid valve in hypoplastic left heart syndrome
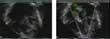
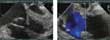
The assessment of the tricuspid valve in patients with hypoplastic left heart syndrome, both preoperatively and postoperatively, is now largely in the hands of the echocardiographer. Transthoracic and transesophageal echocardiography have both been helpful (Figs 2 and 3), but 3-dimensional echocardiography will contribute to assessment in the very near future, as probes are further developed for use in children.
Figure 2.
A transthoracic echocardiogram of the tricuspid valve in a patients with hypoplastic left heart syndrome.
Figure 3.
Another transesophageal echocardiogram of the tricuspid valve in the setting of hypoplastic left heart syndrome.
Using echocardiography, Rydberg et al.6 found abnormalities of the tricuspid valve in one-quarter of patients with co-existing mitral atresia. The indexed diameter of the tricuspid valve was larger than 95% of the predicted value in almost three-fifths of the patients. Valvar regurgitation was found in two-fifths, being mild in most, but moderate in a small proportion. The size of the right ventricle was also increased, probably secondary to alterations in the patterns of flow in fetal life when compared to normal hearts. Barber et al.7 reviewed the echocardiographic findings in 114 patients with hypoplastic left heart syndrome seen at Children's Hospital of Philadelphia. They found tricuspid regurgitation in just over half of their patients. It was mild in 37%, moderate in 33% and severe in 3%. At 2 years, they found no significant change in the amount of tricuspid regurgitation.
Such tricuspid regurgitation may be caused by a morphologic abnormality of the valve itself, involving the leaflets, the annulus, or the subvalvar tension apparatus (Fig. 4). Other factors contributing to the development of tricuspid regurgitation include incremental volume load, aortopulmonary shunting, neoaortic regurgitation, and right ventricular dysfunction with annular dilation. The pressure load that comes with obstruction of the aortic arch can also be a cause of tricuspid regurgitation (Fig. 5).
Figure 4.
The morphology of tricuspid regurgitation.
Figure 5.
Obstruction of the neoaortic (N-Ao) arch. Abbreviations: DAo: descending aorta; RV: right ventricle; LV: left ventricle; S: superior; A: anterior. Reproduced with permission from Snider et al.9
Semiquantitative methods of assessment of tricuspid regurgitation
Trying to quantify tricuspid regurgitation in hypoplastic left heart syndrome is not without its challenge. Semiquantitative methods are simple, and quick to use, but there are pitfalls regarding accuracy. Such methods include comparison of the diameter of the colour jet of tricuspid regurgitation to the diameter of the right atrium, assessment of the jet seen on colour flow on a scale of +1 to +4, assessment of the width of the jet at its origin, and assessment of associated findings. Findings include increased right atrial size, increased right ventricular size, systolic reversal of flow in the inferior caval vein and/or hepatic veins, and associated changes seen in the cross-sectional anatomic images. Spatial mapping is subjective, and depends on the settings of the machine (Fig. 6). It is possible to measure the area, length and diameter of the jet. One useful tip is to set the Nyquist limit at between 50 and 60.8
Figure 6.
Semiquantitative methods of assessment of valvar regurgitation, shown here in the setting of the mitral valve. Reproduced with permission from Hayes.12
Quantitative methods of assessment of tricuspid regurgitation
More precise quantitative methods are available, such as the time velocity integral, the width of the “vena contracta” of the mitral regurgitant jet, and calculations of the proximal isovelocity surface area, the so-called “PISA”. It is hard to be sure of the application of these methods in the setting of the tricuspid valve in the functionally dominant right ventricle of the hypoplastic left heart, as opposed to the mitral valve in the setting of two normal ventricles.
The time velocity interval and the regurgitant fraction
One approach to quantitative assessment is to determine the time velocity interval so as to calculate the regurgitant fraction.9 The interval is equivalent to the area under the Doppler velocity curve over time. It is possible to calculate the orificial area of the valve. The stroke volume is the product of the time velocity interval and the orificial area. In other words, the time velocity integral in centimeters, multiplied by the orificial area in cubed centimeters, is equal to the stroke volume. The regurgitant volume is the tricuspid stroke volume minus the pulmonary stroke volume, while the regurgitant fraction is the regurgitant volume divided by the tricuspid stroke volume. This value is considered normal to trivial when less than 20%, with values of 20–30% representing mild regurgitation, 30–50% being equivalent to moderate regurgitation, and values greater than 50% showing severe regurgitation.
The “vena contracta”
The width of the “vena contracta” of the regurgitant jet has been used to quantitate regurgitation across the mitral valve.10 The “vena contracta” is considered the nearest region of the jet as it emerges through the area of coaptation of the leaflets. The width is taken at the level of the proximal part of the jet closest to the valve. This width can be measured using transthoracic echocardiography, utilizing for example a long axis cut, but it is probably best to use multi-plane transesophageal echocardiography (Fig. 7). The measurement is less valid, however, when the jet is eccentric. For the mitral valve, if the width is greater than 6 mm, then regurgitation is probably severe. With a width of less than 6 mm, regurgitation is usually mild. It is hard to know the accuracy of this technique when trying to assess tricuspid regurgitation in patients with hypoplastic left heart syndrome.
Figure 7.
Quantitative assessment of tricuspid regurgitation – the “vena contracta”. Reproduced with permission from Heinle et al.10
The calculation of proximal isovelocity surface areas
These areas are zones of acceleration proximal to the regurgitant valve. As stated above, they are generally described using the acronym “PISA”. They are seen on color Doppler examination as areas of aliasing, or reversal of colour flow, proximal to the restrictive orifice. According to the principle of the conservation of mass, fluid converges uniformly in such radial streamlines.9, 11 The proximal isovelocity surface area is also used to calculate the regurgitant volume and the effective regurgitant orifice. To make these calculations, one must first establish the baseline shift. This is done by optimizing the region of convergency of the color flow, and shifting the baseline of the color flow downward. Thereafter, the effective regurgitant orifice can be calculated12 in mm2, and the regurgitant volume in cm3 (Figs 8 and 9). First, it is necessary to optimize the cross-sectional images showing the orifice of the tricuspid valve. Then the region of convergence of the color flow must be optimized. The next step is to shift the baseline of colour flow downward. Having noted the velocity of aliasing, the distance is measured from the aliased region to the valvar orifice. It is then possible to measure the extent of tricuspid regurgitation, and the peak velocity of the regurgitant colour wave jet. These calculations permit the degree of regurgitation to be estimated at Grades 1 through 4 (Table 1). It is important to note again, however, that the calculations designed for biventricular circulations may not apply to tricuspid regurgitation as seen in patients with hypoplastic left heart syndrome.
Figure 8.
Quantitative assessment of valvar regurgitation based on calculation of the proximal isovelocity surface area (“PISA”). The calculation is shown here in the setting of the mitral valve, but it is applicable for the tricuspid valve. Reproduced with permission from Hayes.12
Figure 9.
Colour flow images showing how the proximal isovelocity surface area can be measured in the tricuspid valve.
Table 1.
The calculation and gradings of the proximal isovelocity surface area (“PISA”). See text for discussion.
Assessment of right ventricular function
In patients with hypoplastic left heart syndrome, it is important to assess right ventricular function. When the regurgitant jet has a velocity of 3 m/s or greater, it can be utilized to calculate the dP/dt, which is an indirect measure of myocardial contractility.9 This calculation assumes that the velocity of the regurgitant jet reflects the instantaneous pressure gradient from right ventricle to right atrium, and also assumes that the atriums are compliant. This measurement is dependent on preload, but independent of afterload. The normal value is from 1000 to 1200 mmHg/s (Fig. 10).
Figure 10.
The calculation of dP/dT.
Fractional change in right ventricular area
The right ventricular function may also be quantitated by calculating the fractional change in right ventricular area, as described by Schenk et al.13 The equation is the end-diastolic area of the right ventricle minus the end-systolic area, divided by the end-diastolic area. Border detection, or tracings, can be used to calculate the diastolic and systolic areas. Values of approximately 40% are considered normal for the fractional change. The calculations can be achieved using either a subcostal or an apical four-chamber view.
The index of myocardial performance
The pattern of inflow through the tricuspid valve, and the ejection time as obtained by pulsed wave Doppler, can be used to calculate the index of myocardial performance, now known as the Tei index.14 The index correlates well with other measures of left ventricular and right ventricular function in normal adults and children, and in patients with myocardial dysfunction. The index measures the ratio of total time spent in isovolemic contraction and isovolemic relaxation time, and divides this sum by the time spent in ventricular ejection (Fig. 11).15 The index represents global ventricular function, since it includes parameters of systolic and diastolic performance. It is independent of ventricular geometry.
Figure 11.
Calculation of the index of myocardial performance. Reproduced with permission from Eidem et al.15
Long term implications
Mild tricuspid regurgitation is well tolerated in patients with hypoplastic left heart syndrome. In contrast, moderate to severe regurgitation reduces cardiac output, volume loads the right ventricle, dilates the tricuspid valvar annulus, elevates the pulmonary venous resistance, and decreases the flow of blood to the lungs. Barber et al.7 studied the long term effects of moderate and severe tricuspid regurgitation, and found that patients with these complications had a significant reduction in their survival. (Fig. 12)
Figure 12.
Survival with tricuspid regurgitation in patients with hypoplastic left heart syndrome. Reproduced with permission from Barber et al.7
Management of patients with tricuspid regurgitation can be medical in the short term, but is probably surgical in the long term. Patients with moderate, and certainly those with severe, regurgitation either need repair, usually at the second stage of palliation, or transplantation, depending on right ventricular function. The role of echocardiography is to identify abnormalities of tricuspid valve, such as annular dilation as opposed to structural abnormalities, and to guide the surgeon when choosing the appropriate techniques for repair.