





Diet is complex presenting challenges to researchers in relation to understanding both the composition of foods and nutrients consumed. Tools used in large epidemiological studies often claim to be valid. Pooled data from 5 large validation studies conducted in the US explored this by comparing recovery nutrient biomarkers, against FFQ and 24-h recalls. Even in this study, analysis was based only on total energy plus a single nutrient, protein and protein density. Correlations were low and results would not necessarily generalise to other nutrients(Reference Freedman, Commins and Moler1). These results cast doubt on the accuracy of previous FFQ data, a method used throughout epidemiological studies. What tools can we use now to get potentially more reliable, detailed food intake information? This review describes the need for better measures of diet and includes limitations of nutritional assessment methods used in the past. An overview of newer technologies is provided, including online tool myfood24.
Smartphone use globally has increased dramatically over the past 20 years. In October 2025, 6.04 billion people around the world were using the internet, equivalent to 73% of the total world population https://datareportal.com/global-digital-overview. In the UK 95% of the adult population have a mobile phone and 95% have access to the internet at home https://www.finder.com/uk/banking/mobile-internet-statistics.
This positions smartphones as an ideal tool for real-time dietary assessment. A major challenge in the use of mobile technology in research and clinical practise is app selection. Consumer apps may not provide the accuracy required for research. The exact number of diet tracking apps is unknown because app stores do not categorise apps narrowly enough, instead they are included within the larger health and fitness categories. New consumer facing diet and nutrition apps appear frequently whilst others are discontinued making the total number dynamic. The real number of diet‑tracking apps is almost certainly in the hundreds, though only apps with the largest numbers of users get reviewed in the academic literature(Reference Doulah, McCrory and Higgins2–Reference Zhang, Misir and Boshuizen4).
A review of 25 studies in diverse populations using smartphone apps found that just over half (52%) encouraged healthier eating habits; although the impact was inconsistently reported(Reference Seid, Fufa and Bitew5). The apps varied widely and related to a range of nutritional behaviours including reducing sugar, fat, salt and increasing fruit and vegetables. A Canadian smartphone application and messaging service, called SmartAPPetite, using behaviour change techniques and a behavioural economic approach to nudge users into healthy dietary behaviours found that people who were more engaged with the app had more positive changes in healthy food consumption(Reference Gilliland, Sadler and Clark6). A study of our previous smartphone app, MyMealMate, found that those who regularly used the app had more weight loss(Reference Carter, Burley and Nykjaer7). Since the app is always in your pocket it provides more opportunity for engagement, learning and behaviour change than traditional interventions with face-to-face education.
Dietary measurement should form an important component of many research studies. A recent review of weight regain after cessation of medication for weight management does not comment on whether diet was measured at all. Some of the trials in the review included advice about calorie or fat reduction. Whether intakes were measured is not recorded in the review(Reference West, Scragg and Aveyard8). Healthy dietary behaviours should remain the foundation for obesity treatment and management(Reference Sun9), however if intake is not being measured our ability to support patients is limited. New dietary assessment tools could be used alongside these new weight loss drugs. Offering patient and healthcare professional the opportunity for real time tracking of food intake with accurate automated nutrient calculations. Research participants report a preference for digital dietary assessment methods over traditional paper‑based approaches, with higher acceptability among both adolescents and adults(Reference Cade10).
There is a pressing need to integrate use of research level dietary assessment apps at all levels of research; for consumers; and in clinical treatment.
Evolving public health needs
Life expectancy in Europe slowed down from around 2011 reported by the Global Burden of Disease team. This is mainly because of changes in exposure to non-communicable disease risk factors including high body mass index and poor diets. The countries that best maintained improvement in life expectancy after 2011 were Norway, Iceland, Belgium, Denmark and Sweden. Some of this has been attributable to government policies including promotion of healthier diets(11).
The Global Burden of Disease study compiles dietary intake estimates from around the world using national diet surveys and food supply data including food balance sheets. For example, over a third of WHO European countries, mainly central and eastern Europe have no identifiable national diet survey(Reference Rippin, Hutchinson and Jewell12). The quality of the data used therefore varies considerably. For national and regional public health impact this data is not suitable for population intake assessment.
Accurate and real-time nutritional data is needed both nationally and regionally for effective interventions and strategy evaluation. The UK National Diet and Nutrition Survey (NDNS) moved away from paper based food diaries to online dietary data collection in Year 12 (2019). The online tool used, Intake24 includes mainly generic options of foods with a limited food list, aiming to make selection of foods consumed easier for participants. The move to Intake24, was accompanied by collecting data on non- consecutive days with less fieldworker involvement in the assessment. However, this resulted in a higher proportion of participants completing fewer than four recalls, and 20% completed only one or two recalls(Reference Swan13). In addition, there is no regular, routine measurement of food and nutrient intake regionally in the UK. We have tested use of our online tool myfood24 in Yorkshire and Humberside, using social media to recruit participants(Reference Rycroft, Beer and Corrigan14). We recruited a large sample in a short timeframe, and participants used the online tool without support from the research team to report food intake.
Policies designed to address diet inequality in the UK have historically had minimal impact on population diet and health; potentially widening existing inequalities(Reference Crabtree, Hunter and Jenneson15). Whilst supermarket transaction records have been evaluated for dietary monitoring, agreement between purchases and intakes was highly variable(Reference Jenneson, Greenwood and Clarke16). A healthy checkout initiative in Tesco Express convenience stores showed a small reduction in sales of less healthy foods(Reference Fildes, Lally and Morris17). This does not however, show whether intakes of these items reduced since they could be purchased elsewhere.
Having standard intake measurement tools to evaluate interventions such as salt reduction policies or sugar tax at a national/regional level would provide understanding of policy impact for an individual. Public health teams need more focussed data at a population level to explore food and nutrient intakes. This will assist in policy evaluation and design of more effective interventions.
Limitations of traditional methods
Problems associated with paper-based dietary assessment methods have been well versed(Reference Cade10,Reference Ravelli and Schoeller18) . Paper-based methods require detailed recording leading to low compliance and incomplete data. Covert observation of adults comparing actual v. estimated intakes from food records and recalls found that overall weights of food and drinks reported were lower than actual consumption. However, ‘healthy’ foods were not overreported and ‘unhealthy’ foods were not consistently underreported. The under-reporting error appeared to be due to participants forgetting foods rather than inaccurate weights and portion sizes described(Reference Garden, Clark and Whybrow19).
Traditional self-reported dietary assessment has been challenged suggesting that participants under-report intakes compared to independent measures from doubly-labelled water (DLW)(Reference Ravelli and Schoeller18). DLW remain the gold standard for total energy expenditure. Energy requirements for adults have been informed by DLW studies. In the UK, this is 2,000 kcal/day for adult women and 2,500 kcal/day for adult men. These are population averages and assume typical activity levels, average body size and average metabolic efficiency. A review of energy expenditure studies using DLW found that energy expenditure (metabolism) was stable from ages of 20 to 60 years – even during pregnancy. After 60 energy expenditure begins to fall. However, energy intake was not reported(Reference Pontzer, Yamada and Sagayama20). Many people see their weight increase as they get older, despite metabolism staying relatively the same throughout their life. This suggests that weight gain isn’t a result of a slowing metabolism. Rather, it’s more likely to be due to eating more food (energy) than our body uses. Therefore, using EAR as a proxy for total energy expenditure and calculation of under-reporting can be misleading. This is important for new technologies aiming to personalise individual diets to appropriate intake levels.
Food composition databases were limited in the past to mainly generic items. Even though the UK has its own well regarded standard food composition tables(21). These only contain a few thousand foods compared to the ∼150 thousand foods available through stores and online delivery in the UK. Using generic food composition data to generate nutrient information for FFQ with their limited list of foods or even for 24-recalls or food records inevitably results in measurement error. The myfood24 database was used to compare branded versus generic nutrients for a range of food groups(Reference Williams, Cade and Beer22). Results found significant differences in nutrient values for several food groups including cereals, chocolate, dried fruit, fish and ready meals. The generic database was limited in scope and had a considerable amount of missing nutrients. Use of generic tables may misestimate nutrients if branded foods differ. Up-to-date branded food composition databases may help improve accuracy of data collected with new tools.
Portion size estimation is a particular challenge in dietary assessment. Whilst there are a limited number of validation studies in this area, food image based portion size estimation elements appear to be more accurate than using food models or household utensils(Reference Amoutzopoulos, Page and Roberts23). A systematic review of error in self-reported intakes found that the most frequently reported contributors to error were omissions and portion size misestimations(Reference Whitton, Ramos-Garcia and Kirkpatrick24). Food image recognition in new tools could support users describing their portions.
The lack of cultural adaptability of traditional methods of recording diet has also been identified as limiting. For example, national survey data in Sweden has 73% non-response from migrant groups. Suggesting they may have difficulties in assessing eating habits using existing tools(Reference Lentjes, Lonnstrom and Lobenius Palmer25).
Epidemiological methods of dietary assessment in the past
FFQ were developed out of necessity to create a simplified, self-administered and inexpensive form of diet history(Reference Kristal, Peters and Potter26). All of the large cohort studies conducted in the last 50 years have used FFQs to collect estimated intake information. Researchers at that time had no alternative for collecting data at scale, despite being aware of method limitations. Costs would have been prohibitive to use alternatives. For example, in the Women’s Health Initiative costs of collecting and processing paper based 3-day food records/recalls for 160 000 women were estimated to be $24 m. This large US cohort used a 122-item FFQ. Only a subset of participants also completed food records and 24 h recalls with and without biomarker calibration. However, more biomarker variation was explained by food records than by FFQs for absolute macronutrient intake, with 24-h recalls being intermediate(Reference Prentice, Pettinger and Neuhouser27).
Other paper based methods including 24-h recalls and food diaries (weighed or unweighed portions) were generally used in smaller scale studies than FFQ. This was due to the large administrative burden, cost of delivery and coding time taken(Reference Eldridge, Piernas and Illner28). New tools such as myfood24 and Intake24 have taken these methods and deliver them online. Hybrid methods, such as combining FFQ and a 24-h recall have also been developed, including the Oxford WebQ(Reference Cade10).
Correlations between FFQs and other methods are generally low. A review of 130 studies comparing FFQs against recalls and records found the median correlation between methods for different nutrients was 0.4 for recalls and 0.3 for records. The conclusion in this paper was that FFQs were suitable to assess overall dietary intakes in epidemiology(Reference Cui, Xia and Wu29). This view needs to be challenged. Whilst correlations are widely used, they are not appropriate to assess adequacy of FFQs because they measure association not agreement. A correlation of 0.4 means that the FFQ only explains 16% of the variance and in epidemiology, that level of error creates massive attenuation and misclassification. Relative risk estimates are reduced towards the null, meaning a moderate effect may become undetectable.
Twenty years ago, researchers stated ‘It is clear to us that it is well past the time to abandon the FFQ for future studies of diet and cancer risk and to implement dietary assessment methods that capture data on foods actually consumed’(Reference Kristal, Peters and Potter26).
We need to improve our methods to reduce measurement error and improve accuracy. Allowing us to answer research questions, evaluate interventions and provide personalised advice.
Technology assisted methods
Real time tracking tools provide a step change to traditional paper-based methods and FFQs. Mobile apps and wearables enable immediate logging of food intake which is scalable to large samples over long periods for reasonable costs.
Sensor technologies
Wearable sensors are being used to monitor eating habits since they could reduce reliance on self-reported data. Sensors can measure timing of eating; duration and microstructure of food intake episodes; rate of ingestion; amount of food eaten. Different wearables have been developed to monitor facial movements, hand motions, analyse saliva with mouthguards or tooth sensors; and sound measures. However, these sensors are still under development; often untested in free living situations and may be uncomfortable to wear(Reference Hassannejad, Matrella and Ciampolini30,Reference Hossain, Thomas and McCrory31) .
Automated food recognition
Food photography and computer vision can now analyse meal images to estimate portion sizes and nutritional content automatically. AI algorithms can recognise food items from images, estimate portion sizes and calculate nutrient intake with high accuracy. These capabilities reduce the need for manual data entry and minimise errors associated with self-reporting.
A systematic review of evidence relating to validity and accuracy of AI-based dietary intake assessment methods included 13 studies comparing AI generated nutrient estimates compared to traditional methods. High correlations (>0.7) were found for calorie and macronutrient estimates in 6 studies. Recognition was accurate in favourable conditions such as simple foods or single-dish images. Performance dropped with mixed or cultural dishes, concluding that systems are maturing but require further validation across varied foods and populations(Reference Cofre, Sanchez and Quezada-Figueroa32).
Popular apps were evaluated from Australia’s Apple App and Google Play stores. Seven apps had AI-enabled food image recognition features. MyFitnessPal and Fastic had the highest accuracy (97 and 92%, respectively) out of seven AI-enabled food image recognition apps. Apps with more AI integration demonstrated better functionality, but automatic energy estimations from AI-enabled food image recognition were less accurate(Reference Li, Yin and Choi3). For example, an image of ‘Eggs on toast with butter’ lead to 35% underestimation of energy by MyFitnessPal (version no. 24.10.0) due to omitting butter; Foodvisor (version no. 5.15.0–1) underestimated it by 73%. For other mixed dishes, the image recognition was not able to identify all of the components of the meals. Photo logging has recently been introduced into the Zoe app. In-house evaluation of 10 000 meals from 2,124 participants found that the technology works very well for some items (tea/coffee, vegetables, baked beans) but less well for others (plant milk, soup, hot chocolate). Estimates of macronutrients from the photos was also good(Reference Newman and Amati33).
Predictive dietary modelling
Personalised dietary recommendations, which are tailored to individual factors such as age, sex, activity level and medical history, could result in better health outcomes compared to generalised dietary guidelines. However, without the use of new technologies personalised dietary support is limited requiring staff time, individual assessments and multidisciplinary expertise. Over recent years the development of Large Language Models (LLM) such as Chat Generative Pre-Trained Transformer (ChatGPT) can generate natural, human-like responses. These technologies could provide broader access to dietary guidance as a cost effective, scalable alternative to traditional consultations(Reference Guo, Liu and Xiang34).
A systematic review of 23 studies using ChatGPT to personalise meal planning and provide recommendations was carried out. Most reported that ChatGPT advice was accurate, often indistinguishable from human dietitians. One study reported that ChatGPT outperformed humans. Although concerns were raised about lack of real world implementation and safety issues(Reference Guo, Liu and Xiang34). A review by the British Dietetic Association of AI tools (ChatGPT and Google’s AI summary) found them to be helpful for quick reminders of general healthy eating principles, providing simple explanations and could answer basic nutrition questions. However, context was important and there were concerns if a patient had a specific medical condition or emotional, behavioural or psychological factors. For example, asking ‘which diet is best for weight loss?’ there was no discussion of the downsides of certain diets and ChatGPT was felt to be too optimistic about restrictive approaches(Reference Ludlam-Raine35).
In addition to food intake, machine learning has been used to accurately predict glucose values at 15- and 60-min intervals based on continuous glucose monitoring data alone in people with normal glucose, pre-diabetes or type 2 diabetes. This could support maintenance of healthy plasma glucose levels, preventing diabetes related complications(Reference van Doorn, Foreman and Schaper36).
Food logging consumer apps
A plethora of consumer-facing food logging apps exist, however their reliability and accuracy is unclear. A systematic review of 11 commercial apps found that they were effective self-monitoring tools, and that their use resulted in positive effects on measured nutritional outcomes in chronic diseases, especially weight loss(Reference Fakih El Khoury, Karavetian and Halfens37). Another study screened the top 200 free and paid nutrition-related apps from Australia’s Apple App and Google Play stores (n = 800). Manual food logging and AI-enabled food-image recognition apps were compared with food records for 3 different diet patterns: Western, Asian and Recommended. From 16 manual food-logging apps, energy was overestimated for Western (mean: 1040 kJ) but underestimated for Asian (mean: −1520 kJ) diets(Reference Li, Yin and Choi3). The most popular commercial nutrition weight loss app, MyFitnessPal, was tested in a real world setting. Adults who had not previously regularly used the app recorded their food intake for 4 d. They omitted 18% of food items, especially energy dense and nutrient poor foods. Users found the food database and portion size estimation particularly challenging(Reference Chen, Berkman and Bardouh38).
The development of tools using new technologies requires understanding of the user experience. Visual design is important with a consistent look and navigation style. However, consumer facing apps may not be suitable for research. They may not allow researchers to customise the system with project specific text and invitations or to download and analyse user input(Reference Cade10).
In addition, the underlying food composition databases of food logging apps is often unspecified or may include user entered data with errors or limited information. Tools typically include combinations of food databases; they may include generic UK or USDA food tables; with proprietary and crowd sourced data. MyFitnessPal uses a large crowdsourced database which may not be reliable, particularly underestimating micronutrients(Reference Evenepoel, Clevers and Deroover39).
myfood24 – research grade food logging app
It is clear that accurate, online food tracking tools suitable for research purposes are required. myfood24 (measure your food on one day) was developed with UK Medical Research Council funding (2012–2016). The tool aimed to fill a research gap to allow collection of detailed food and nutrient information in large-scale epidemiological studies. A spin out company, Dietary Assessment Ltd, was established in 2017 to support the ongoing growth and development of the tool and respond to a range of customer requirements. The company’s vision is to help reduce diet-related disease globally through supporting researchers, teachers and healthcare professionals to better track, monitor and analyse nutritional intake. Providing personalised dietary assessment, support and advice through a single, easy to use platform. For use by healthcare professionals, patients, researchers and consumers taking into account users’ diet, preferences, culture, lifestyle, budget and health.
What is myfood24?
At its core, myfood24 functions as a comprehensive food diary, allowing users to log and track their daily food and beverage consumption. Unlike traditional paper-based diaries, myfood24 eliminates the hassle of manual paper recording and then coding every meal and snack. Users can search for specific foods, select portion sizes and add custom recipes.
myfood24 is designed to simplify food intake tracking and analysing nutrition. It has been optimised for accurate search, food selection and analysis. Based on the logged food entries, the platform automatically calculates the macro and micronutrient composition of the user’s diet. This information is presented in an easily understandable format, enabling individuals to gain insights into their nutrient intake patterns. Users can assess their consumption of calories, protein, carbohydrates, fats, vitamins, minerals and other essential nutrients, helping them make informed decisions about their dietary choices.
Synonyms and misspellings are included, improving food search. Accurate analysis is enabled by registered nutritionists routinely quality checking and updating food composition data. Prompts for food items commonly consumed alongside others ensures more accurate recall. Portion images aid users with portion size selection. Bar code scanning functionality is also included.
myfood24 is available for research, teaching and in healthcare settings. Over 250 000 research participants have used myfood24. For healthcare professionals (HCP) there is a portal for the HCP to add patients and apps for the patients to use to track their diet. We already have >200 HCPs using the healthcare version.
In addition, myfood24 uses an API-driven architecture, meaning that all functionality visible to the user is also usable for integrations with other applications and systems using a RESTful API. Teams can integrate into their own systems using a Software Development Kit option using a React Native framework.
Privacy and data security are key when using online platforms. The platform adheres to strict data protection regulations and ensures that personal information and dietary data are encrypted and stored securely. Users have control over their data and can choose to contribute their anonymised information to research projects voluntarily.
Validation and usability studies using myfood24
During the development of myfood24 a validation study was conducted. Over 200 metabolically stable adults completed myfood24, an interviewer-based multiple pass recall and a suite of reference measures. Longer-term dietary intake was estimated from up to 3 × 24-h recalls taken 2 weeks apart. Estimated intakes of protein, potassium and sodium were compared with urinary biomarker concentrations. Estimated total sugar intake was compared with a predictive biomarker and estimated energy intake compared with energy expenditure measured by accelerometry and calorimetry. Nutrient intakes were also compared to those derived from an interviewer-administered multiple-pass 24-h recall. Results using the app were broadly similar to the more administratively burdensome interview. Nutrient values were similar to the National Diet and Nutrition Survey (UK). However, findings from both reporting methods were attenuated compared to biomarkers(Reference Wark, Hardie and Frost40).
The German version of myfood24 was also validated by comparison with the more costly and time-consuming weighed diet record and biomarkers. myfood24-Germany provided estimates for energy and a range of nutrients comparable to the weighed record. Both methods showed a similar extent of measurement error compared to biomarkers(Reference Koch, Conrad and Cade41).
The French version of myfood24 was evaluated with a focus on food photographs and their angle of view. Over 3,000 French foods were in the database, and portion sizes were adapted to French dietary habits. Overall, aerial photographs allowed a slightly better perception of portion sizes; however, the differences with angled photos were not big enough to be statistically significant. myfood24-France had a ‘good’ system usability. Since the first version evaluated in this work, more than 10,000 items and 60 traditional regional recipes have been added to myfood24 France’s databases as well as 12 new portion picture series. myfood24-France can be used for nutritional assessment at the individual and population level(Reference Hasenbohler, Denes and Blanstier42).
Other country versions of myfood24 have also explored usability of the tool. The West African tool included ∼1,000 foods. The mean SUS score of 74 (95% CI: 68, 79) indicated good usability. The feedback showed that the tool was user-friendly, educational and included a variety of local foods(Reference Uzokwe, Nkwoala and Ebenso43).
myfood24 databases
Currently, there are ∼500,000 food and drink items representing over 35 UK and international food composition databases available for myfood24 users. Unlike some other apps, none of the data is crowd sourced. The myfood24 databases and platform are checked daily by nutritionists in the database team for the purposes of maintenance and validation of data. These daily checks involve data review such as portion sizes, categorisation, nutrient data and application functionality. Additional to this, all data that is added to the dataset undergoes a rigorous internal quality check process before being available to use by customers to ensure data accuracy.
myfood24 provides detailed information on macronutrients and micronutrients for up to 225 nutrients. Mapping populates micronutrients where other systems only have information on 8 back-of-pack macronutrients. A rigorous overstamping and mapping process is used. Overstamping infills missing nutrient values to enhance the nutrient data available. These processes enable myfood24 to deliver a more complete picture of overall nutrient intakes not available through other apps.
myfood24 is applicable to diverse populations and the World Foods Database which includes over 11,000 items from all over the world facilitates populations from different backgrounds to choose their own foods. New foods are added regularly and new international versions created with local academic collaborators. This means that the databases are as reflective and appropriate as possible for the population they’re being used in. For example, an Arabic Food Composition Database was created for a Middle Eastern version of myfood24. Using a 6-step approach: food identification, cleaning, mapping, translation, allocating portion sizes and quality checking over 2,000 foods were added to the database(Reference Bawajeeh, Kalendar and Scarpa44). A database for an indigenous population in Southwest Uganda was also created. Locally relevant food databases are sparse for African Indigenous communities(Reference Scarpa, Berrang-Ford and Bawajeeh45) making tools such as myfood24 important for researching under-represented groups.
Other database features include sustainability metrics: greenhouse gas, land, water use for the UK; 17 metrics from Agribalyse for France and also metrics for Denmark. In a survey of adults living in Yorkshire and Humberside who used myfood24 to record their food intake for one day found mean greenhouse gas emissions (GHGE) were 5.9kg CO2 eq/day (95% CI 5.6, 6.1); land use 9.0 m2year/day (95% CI 7.6, 10.3) and water use 582 l/day (95% CI 551, 611). Regression analysis showed that for each additional 100kcal consumed there was a significant increase in GHGE of 0.9 kg CO2 eq/day (95% CI 0.8, 1.1). Land and water use were also significantly increased with increasing energy intake(Reference Williams, Hasenböhler and Hamilton46).
Also, for the UK databases there are High Fat, Salt and Sugar (HFSS) and NOVA scores. Whilst the definition of HFSS is clear and could be applied directly to the database the NOVA score creation was more challenging. This was due to some ingredient list gaps and ambiguity of the source, the UK branded database contains over 126 000 foods, some of which required assumptions when the source did not allow for a definite score. Where there was need for interpretation of the score, the nutritionists in the myfood24 database team were able to make informed assumptions, noted in internal documentation for future reference. Due to the somewhat subjective nature of the NOVA score, since the first implementation of the score, the myfood24 team has carried out an internal review and updates were made to improve the accuracy and consistency of the NOVA data.
HFSS and NOVA4 (ultra processed) both tended to classify foods with high energy density. But some non- HFSS food categories, with very differing nutritional compositions were classified as NOVA4, such as canned foods, some fish products, fruit juices/smoothies, nuts/seeds and pulses. The myfood24 NOVA score was applied using the NDNS source (NOVA classification of the National Diet and Nutrition Survey, waves 1 to 11 (2008/09 to 2018/19)). The source data was used to allocate a NOVA score to each food and drink item in our UK Generic and Branded databases via the ingredient deck data in our dataset. Understanding where the differences and similarities lie between the scores can help interpret epidemiological research and develop public health policy to improve the quality of the UK diet(Reference Williams, Clarkson and Hamilton47).
Branded food item data v. generic
The dataset contains extensive nutrient information on both branded and generic items. By including a wide range of branded items, we can explore nutrient intakes more precisely. The myfood24 dataset covers branded food and drink items across different countries. The UK myfood24 Branded database contains 126 000+ food and drink items, of these 7,000+ are from cafés, 8,000 from restaurants, 1,000+ from takeaways, 5,000+ from fast food outlets and 7,000+ from retailers. The majority of these are from larger chains where nutritional data is accessible online. The nutrient data for food and drink items from independent out-of-home outlets is more difficult data to access, often due to the lack of nutritional data available for these sites.
Analysis of the UK database as at December 2021 was undertaken; nutrient values for food groups from different locations: supermarkets, fast food outlets, coffee shops and restaurants, health food shops and food delivery services were compared with generic products. At that time, the myfood24 UK database included 10 of the 11 main supermarkets; 5 of the major coffee shop chains; 9 of the leading fast-food outlets; plus, food delivery services with 79 338 branded food items included and 3,334 generic products. The branded database showed significantly higher values compared to generic tables for energy for cereals, chocolate, dried fruit, fish, fresh fruit, muffins, nuts, sweet bakery products and ready meals and a lower mean energy intake for oils. For example, the branded database contains information on 2,925 chocolate products compared to 19 items in the generic database. Branded chocolates had a mean energy/100g of 518kcal and the generic items only 476 kcal; mean difference 41 kcal (95% CI: 20, 62 kcal). Branded cereals (n = 1275) had a mean energy/100g of 377 kcal and the generic cereals (n = 42) a mean energy/100g of only 320 kcal; mean difference 58kcal (95% CI: 14, 101 kcal). Differences between branded and generic data could lead to error in calculation of nutrient intakes in surveys. New products are appearing all the time, and the myfood24 UK branded database has now over 125 000 items with full nutrient data. Use of retail product information is important in understanding population nutrient intake data(Reference Williams, Cade and Beer22).
Diet optimisation engine
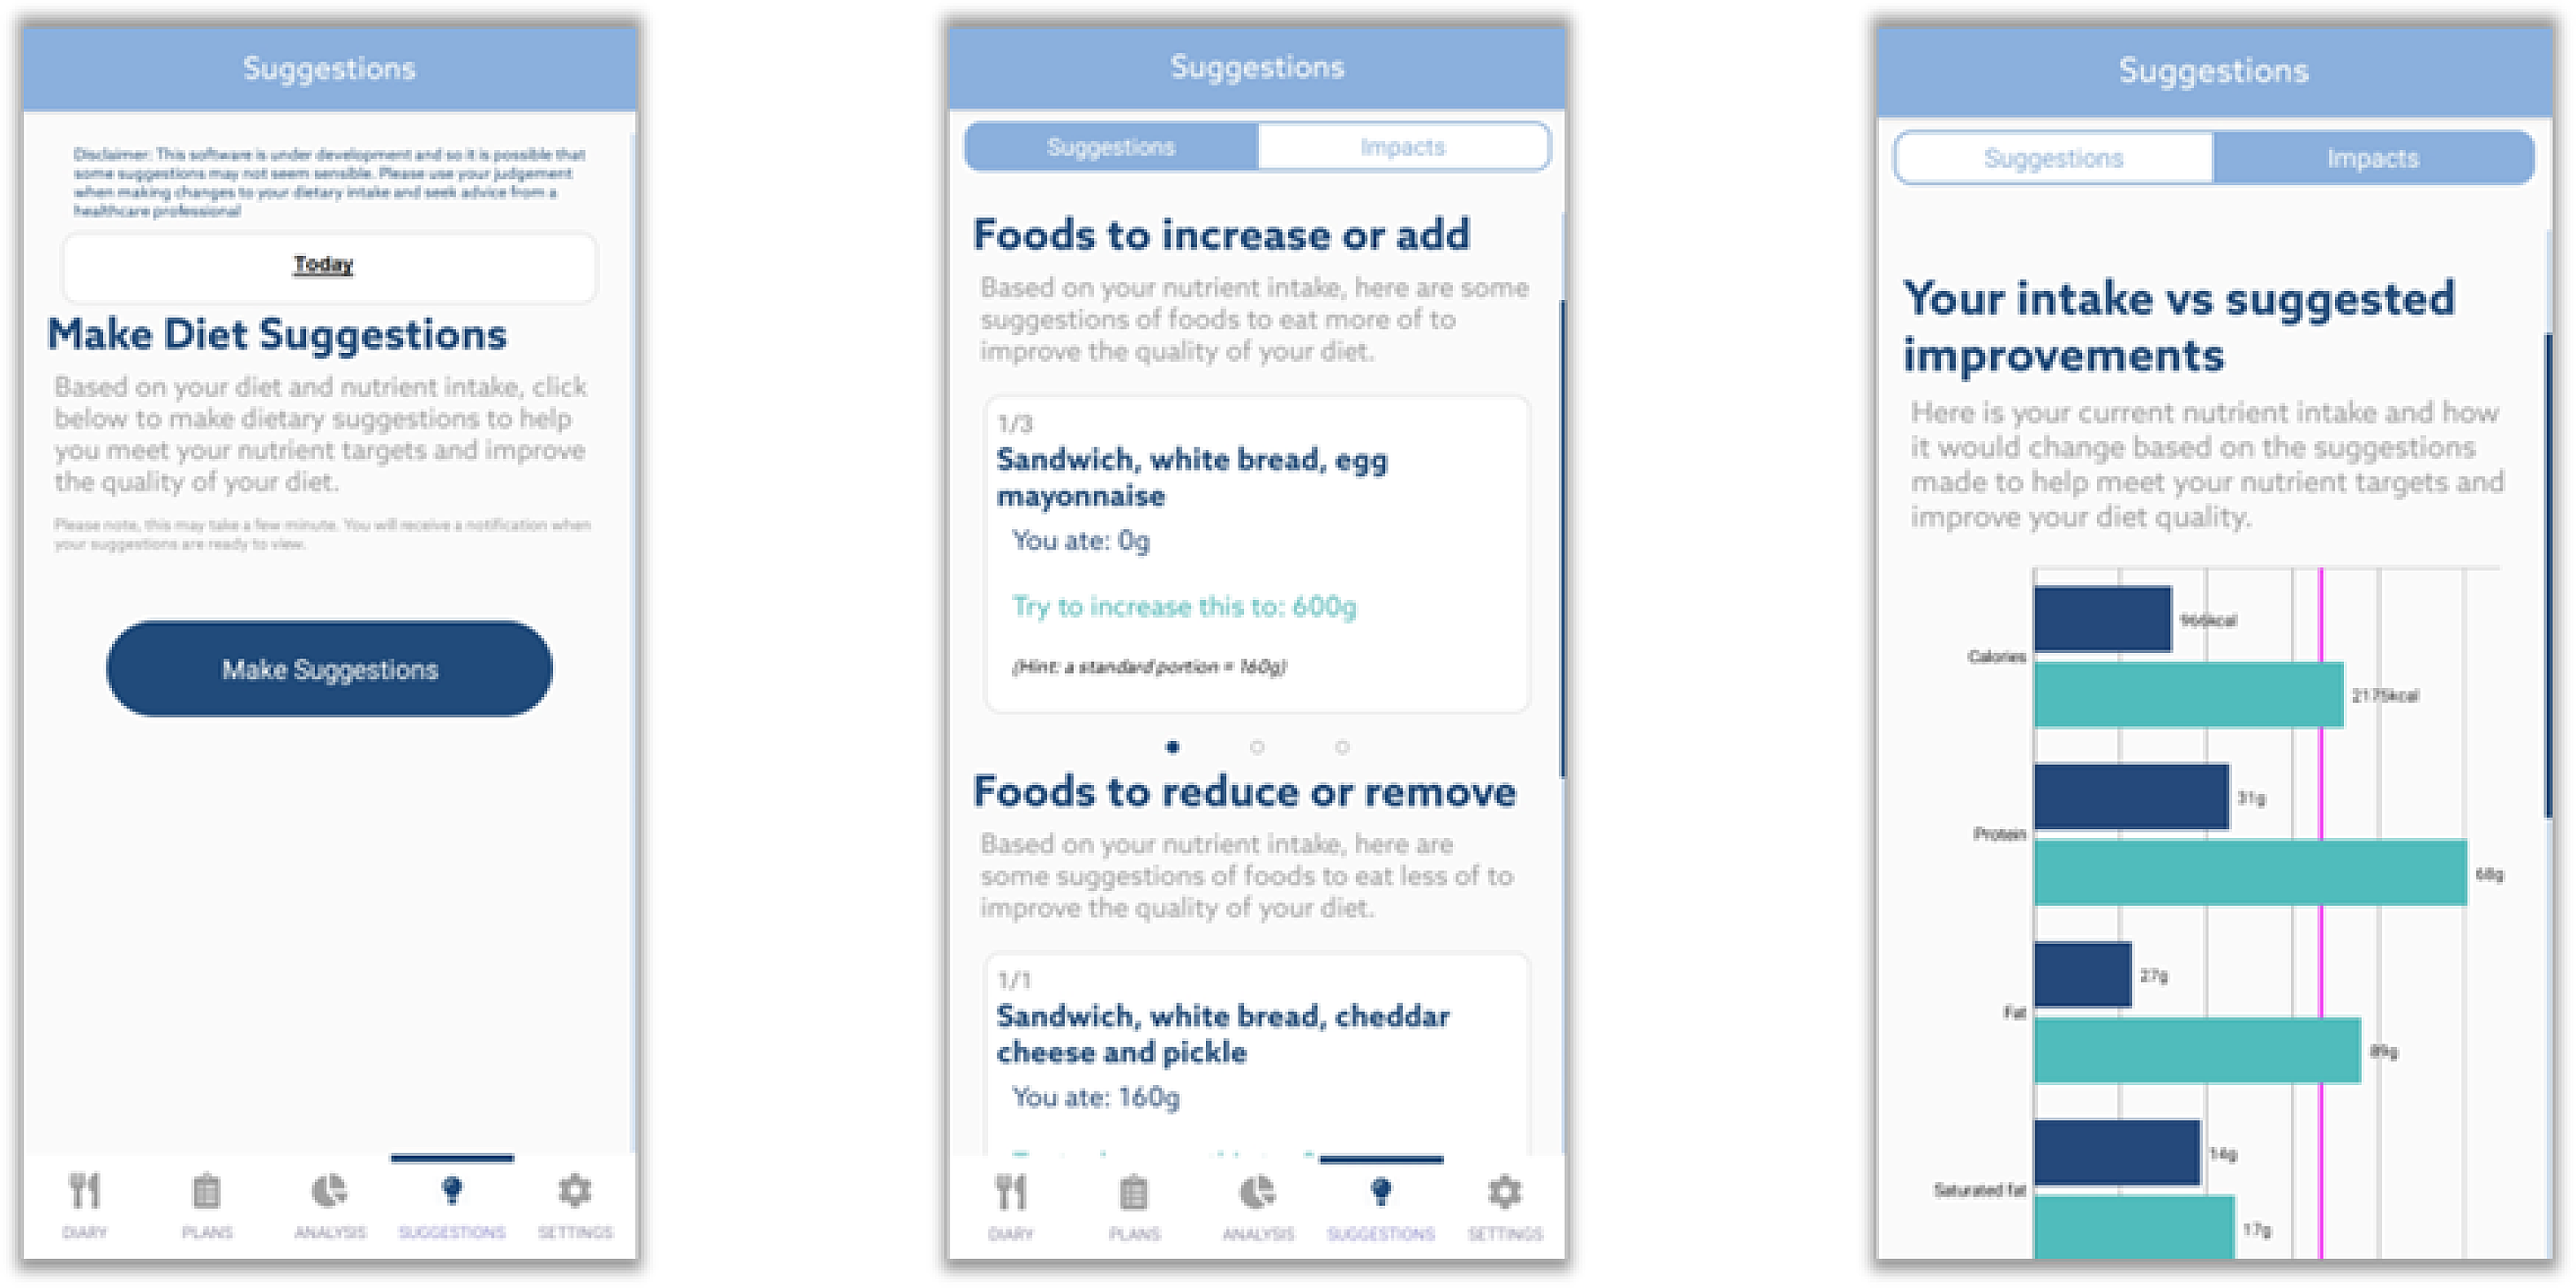
To encourage users to make improvements in food and nutrient intakes in relation to target nutrient values myfood24 has incorporated a tool for diet optimisation. The Diet Optimisation Engine (DOE) is a registered class I medical device that makes personalised suggestions to change intakes based on nutritional needs. The suggestions are based on the food diary data entered by the individual and targets for nutrients based on their age and gender. Diet is modelled for the individual, using linear programming to suggest minimum dietary changes to move closer to nutrition targets. All foods recommended by the DOE, regardless of what is entered into the user’s food diary, come from McCance and Widdowson 7. This is to ensure that recommendations given are unbranded and likely to be more commonly consumed/familiar to the average user. Using specially developed algorithms, the DOE analyses the current food list and interrogates the food dataset to develop an alternative set of foods suggested to the user to help meet their targets. The elements of this set are prioritised and iteratively refined based on additional criteria eventually resulting in a stable set of alternative foods. The system does not suggest increasing alcohol or reducing fruits and vegetables. An example of the screens linked to the DOE making ‘suggestions’ for personalised improvements is shown in Fig. 1.
Example screens for the diet optimisation engine.

Potential for Fig. 1 location. Example screens for the diet optimisation engine
myfood24 use cases
The application of myfood24 is wide and it is regularly used in research; for teaching with students; and as healthcare apps with a portal for the healthcare professional.
Researchers can tailor underlying food composition databases to their own needs. For example, the French database is more than three times larger than the official French food composition tables CIQUAL due to inclusion of branded items. The even larger UK branded database contains more than 30 times the numbers of items in the UK generic database.
myfood24 has been used in cohort studies of adults(Reference Rycroft, Beer and Corrigan14,Reference Rostgaard-Hansen, Rosthoj and Brunius48) and children(Reference Fraser, Bedendo and O’Neill49). Clinical populations who have used myfood24 include children fed by gastrostomy(Reference Taylor, O’Neill and Maddison50), in women with gestational diabetes(Reference Morris, Hutchinson and Gianfrancesco51), people living with cancer(Reference Conway, Rigler and Croker52) and dietetic patients(Reference Gianfrancesco, Taylor and Croot53). A clinical trial of myfood24 has been conducted in weight management and gastroenterology patients who were randomised into 3 groups: standard care, myfood24, myfood24+ diet optimisation. Compliance was good amongst those using the app, with 78% using it at least once, and 50% recording intake for four or more days (the study requirement). The app software was found to be generally acceptable and beneficial for patients in tracking their dietary intake and assisting HCPs in supporting patients’ dietary changes(Reference Threapleton, Beer and Foley54).
The quick and easy use of myfood24 makes it ideal for collecting large amounts of data in a short time. This has been useful at a regional level since there is no regular, routine measurement of food and nutrient intakes. A regional survey in Yorkshire and Humberside recruited participants using Facebook boosts. In 3 weeks, 673 adults had completed a myfood24 food diary, with overall nutrient values similar to national survey data(Reference Rycroft, Beer and Corrigan14).
Internationally, myfood24 has been used in research with culturally specific food databases in a range of countries including Uganda(Reference Scarpa, Berrang-Ford and Bawajeeh45), Peru(Reference Zavaleta-Cortijo, Cade and Ford55), Thailand(Reference Nitsuwat, Webster and Sarkar56), Nigeria(Reference Uzokwe, Nkwoala and Ebenso43), Germany(Reference Koch, Conrad and Hierath57), France(Reference Hasenbohler, Denes and Blanstier42), Norway(Reference Hopstock, Medin and Skeie58), Denmark(Reference Rostgaard-Hansen, Rosthoj and Brunius48), St Kitts and Nevis(Reference Crispim, Elias and Matthew-Duncan59) and the Middle East(Reference Bawajeeh, Kalendar and Scarpa44). On each occasion local researchers developed their own food composition database to ensure appropriate coverage of foods and undertook translations as required.
Our API has also been used to create an app for consumer use. This free app for consumers includes food logging, diet optimisation and a smart nutrition score(60). Helping consumers to understand more about what they are eating and how it could be improved.
Conclusion
This is an exciting time for nutrition research because new dietary assessment tools can provide data for large-scale studies more quickly, cheaply and more accurately than previous methods using FFQ. With the potential to include detailed food composition data the new tools will provide deeper insights into dietary behaviour. myfood24 is one such tool. Supporting research around the world, healthcare professionals and patients. These tools now need to be applied routinely in large epidemiological surveys; for public health population screening and for patients to fully realise their potential.
Acknowledgements
Thanks to the team at myfood24, Lucy Clarkson and Grace Williams, for providing comments and details for this paper.
Financial support
No financial support has been provided for this paper.
Author contributions
Janet Cade is the only author and the sole contributor to this work. I approve submission.
The manuscript is original and not submitted elsewhere. I take full responsibility for the accuracy and integrity of the content.
Competing interests
Janet Cade is Founder of Dietary Assessment Ltd which supports myfood24.
JC is Director of Dietary Assessment Limited, a University of Leeds spin out company supporting development and use of myfood24.

 Open access

