
Introduction
Chagas disease is a neglected disease caused by the intracellular protozoan Trypanosoma cruzi. Initially, it was confined to Latin American countries but has now spread worldwide by immigration (Jackson et al., Reference Jackson, Varcher Herrera and Gascon2014). Besides, non-traditional vectors have been involved in transmission (Salazar et al., Reference Salazar, Castillo-Neyra, Tustin, Borrini-Mayori, Naquira and Levy2014), raising the concern about the dissemination in non-endemic countries as currently reported (Lynn et al., Reference Lynn, Bossak and Sandifer2020).
Chagas disease is characterized by an acute phase, generally asymptomatic or with mild unspecific symptoms, such as fever and hepatomegaly. Patients progress to a chronic phase, being only 30% symptomatic during this stage. Chronic disease is characterized by heart failure, arrhythmias and sudden death that represent 60% of mortality. The victims often are younger than 58 years and asymptomatic before the final episode (Mendoza et al., Reference Mendoza, Marques, Misticchio, Matheus and Rodriguez1999), which made the understanding of pathophysiological mechanisms involved in Chagas malignant arrhythmias a challenge.
There is scarce information about cardiac arrhythmia genesis in Chagas disease. Circulating anti-muscarinic and anti-adrenergic antibodies have been reported in chronic chagasic mice with QTc increasing and dysautonomia (Daliry et al., Reference Daliry, Pereira, Pereira-Junior, Ramos, Vilar-Pereira, Silvares, Lannes-Vieira and Campos de Carvalho2014), a well-known pro-arrhythmogenic factor. Together with this, anti-adrenergic and anti-muscarinic antibodies have been related to AV conduction blocks in mouse hearts (Escobar et al., Reference Escobar, Fernandez-Gomez, Peter, Mobini, Hoebeke and Mijares2006); and muscarinic signalling by auto-antibodies from Chagasic patients have been pointed out as reducers of calcium current in isolated myocytes (Hernandez et al., Reference Hernandez, Barcellos, Gimenez, Cabarcas, Garcia, Pedrosa, Matheus, Kurtenbach, Masuda and Campos de Carvalho2003). On the other hand, calcium handling dysfunction in cardiomyocytes isolated from Chagasic patients (Lopez et al., Reference Lopez, Espinosa, Landazuru, Linares, Allen and Mijares2011) is a factor that might be associated with ventricular arrhythmias and sudden death. Recently, it has been reported that the chronic elevation of the intracellular calcium diastolic, in patients suffering from chagasic cardiomyopathy, is mediated by the inositol triphosphate receptor and it is linked to the deterioration of cardiac function (Mijares et al., Reference Mijares, Espinosa, Adams and Lopez2020). Exposition of cardiac tissues obtained from dogs with chronic T. cruzi infection to soluble factors of trypomastigotes of T. cruzi was able to induce the upregulation of plasma membrane calcium pump (Barr et al., Reference Barr, Pannabecker, Gilmour and Chandler2003). Interestingly, it was reported that Trypanosoma brucei cathepsin-L was able to increase sarcoplasmic calcium release from rat cardiac myocytes (Elliott et al., Reference Elliott, McCarroll, Hasumi, Welsh, Panissidi, Jones, Rossor, Tait, Smith, Mottram, Morrison and Loughrey2013), the fact that was in accordance with the pro-arrhythmic potential showed by T. cruzi conditioned medium on healthy, isolated beating rat heart model under ischemic conditions (Rodriguez-Angulo et al., Reference Rodriguez-Angulo, Toro-Mendoza, Marques, Bonfante-Cabarcas and Mijares2013) and under a non-damaging hypoxic recirculation (Rodriguez-Angulo et al., Reference Rodriguez-Angulo, Toro-Mendoza, Marques, Concepcion, Bonfante-Cabarcas, Higuerey, Thomas, Balzano-Nogueira, López and Mijares2015). A large number of molecules have been involved and are described as part of the secretome of T. cruzi (Brossas et al., Reference Brossas, Gulin, Bisio, Chapelle, Marinach-Patrice, Bordessoules, Palazon Ruiz, Vion, Paris, Altcheh and Mazier2017; Watanabe et al., Reference Watanabe Costa, Batista, Meneghelli, Vidal, Nájera, Mendes, Andrade-Lima, da Silveira, Lopes, Ferreira, Antoneli and Bahia2020). Some of them are included in extracellular vesicles (Retana Moreira et al., Reference Retana Moreira, Rodríguez Serrano and Osuna2019). It has also been described that T. cruzi tissue-culture cell-derived trypomastigotes induced physiological changes in non-parasitized culture cells; however, the molecular mechanism associated with this effect is poorly understood. Thus, the aim was to study the effect of conditioned medium obtained from T. cruzi-Vero cell co-culture on cellular excitability, ionic conductance and catecholamine release in chromaffin cells. The chromaffin cells are one of the most popular and widely used cellular models for investigating the molecular mechanisms underlying cellular excitability and neurotransmitter release (Lingle et al., Reference Lingle, Martinez-Espinosa, Guarina and Carbone2018; Carbone et al., Reference Carbone, Borges, Eiden, García and Hernández-Cruz2019).
The main aim was to test how possible alterations of the ionic currents involved in neurotransmitter release and cellular excitability underlie pro-arrhythmogenic conditions in the Chagas disease. Here, it was demonstrated that parasite-secreted proteins induce potentiation of catecholamine release that appears to be due to increases in cytosolic calcium levels raised from intracellular stores rather than extracellular calcium influx. In fact, it was shown how this conditioned medium induces a depression of calcium current in a time- and concentration-dependent manner; and a sharp blockade of the potassium conductance responsible for the completion of action potentials (APs). Both the cytosolic calcium increment and the alteration of the cellular excitability may underlie the appearance of malignant arrhythmias in the Chagas disease.
Materials and methods
Isolation and culture of bovine chromaffin cells (BCC)
All experiments were carried out in accordance with the guidelines established by the National Council on Animal Care and were approved by the local Animal Care Committee of the Universidad Autónoma de Madrid. Adrenal glands were obtained from a local slaughterhouse under the supervision of the local veterinary service. Bovine adrenal medullary chromaffin cells (BBC) were isolated as described previously (Livett, Reference Livett1984), with some modifications (Moro et al., Reference Moro, López, Gandía, Michelena and García1990). Briefly, cells were suspended in DMEM supplemented with 5% fetal bovine serum (FBS), 50 IU mL−1 penicillin and 50 μg mL−1 streptomycin, and preplated for 30 min. Proliferation inhibitors (10 μ m cytosine arabinoside, 10 μ m fluorodeoxyuridine and 10 μ m leucine methyl ester) were added to the medium to prevent excessive growth of fibroblasts. Cells were plated on 10 cm diameter Petri dishes 5 × 10⁶ cells in 10 mL of DMEM for secretion experiments, and on 1 cm-diameter glass coverslips at low density (5 × 10⁴ cells per coverslip) for patch-clamp studies. Cultures were maintained in an incubator at 37°C in a water-saturated atmosphere with 5% CO2. Cells were used 1–4 days after plating.
Conditioned medium obtaining
Ultrafiltrate fractions of conditioned medium control (CCM) or Tripanozoma cruzy conditioned medium (TCCM) were obtained as described by Rodriguez-Angulo et al. (Reference Rodriguez-Angulo, Toro-Mendoza, Marques, Concepcion, Bonfante-Cabarcas, Higuerey, Thomas, Balzano-Nogueira, López and Mijares2015). Briefly, Vero (African green monkey kidney cells, ATCC CCL-81; American Type Culture Collection, Rockville, MD, USA) were maintained at 37°C and 5% CO2 in complete Minimum Essential Medium (Mediatech, Herndon, VA, USA) containing 10% FBS (Gibco-BRL, Gaithersburg, MD, USA), 2 mm L-glutamine, 1 mm sodium pyruvate and 50 μg of gentamicin/mL (all Sigma-Aldrich, St Louis, MO, USA). Confluent Vero cultures plated in a 75 cm2 Easy Flask were infected with 2 × 10⁵ EP strain trypomastigotes/mL. EP human strain at a rate of 2 parasites per cell. The EP strain (Biodiven EP-028) of T. cruzi was isolated from a fatal human case in 1967 as described by Contreras et al. (Reference Contreras, Araque and Delgado1994). Free parasites were removed after 24 h and the complete medium was changed at this point to medium FBS-free. On the fifth or sixth day post-infection, the conditioned serum-free medium was collected. The criteria for the harvesting of the TCCM were that a minimum of 75% of the Vero cells should remain adhered and that at least 2.5 × 10⁶ trypomastigotes/mL should be present in the supernatant. CCM was collected from uninfected Vero cells cultured under the same conditions.
The supernatant fluid which had been decanted was concentrated by using low-protein binding membrane Diaflo (Millipore, AmiconCorp., Cambridge, Massachusetts, USA) ultrafiltration cell operated in a cold room (4°C) at 50 psi. The Diaflo Model 50 ultrafiltration cell is provided with internal stirring and has a capacity of 40 mL. Supernatant were passed through an ultrafiltration membrane and the fraction was concentrated to a volume of 10 mL (4x) and washed three times to remove the lower molecular weight proteins. The pore size cut-off used were 300, 50 and 10 kDa, and the ultrafiltrates obtained were >300, <300, >50 and <50 kDa. Each fraction was reconstituted to a final protein concentration of 5 μg mL−1 using Minimum Essential Medium (in mm; 1.8 CaCl2, 0.81 MgSO4 5.33 KCl, 117.24 NaCl, 1.0 NaH2PO4, 5.56 D-Glucose). The osmolalities of the reconstituted medium were measured using an osmometer (model Osmette A, Precision Instruments, Sudbury, MA, USA) and were adjusted at 295–300 mOsm and pH to 7.4 with HCl. Protein determination was performed on all mediums used in this work. For detailed information about the supernatant, see Rodriguez-Angulo et al. (Reference Rodriguez-Angulo, Toro-Mendoza, Marques, Bonfante-Cabarcas and Mijares2013, Reference Rodriguez-Angulo, Toro-Mendoza, Marques, Concepcion, Bonfante-Cabarcas, Higuerey, Thomas, Balzano-Nogueira, López and Mijares2015).
Online measurement of catecholamine release from chromaffin cells
BCC 5 × 10⁶ were scrapped off carefully from the bottom of the Petri dish with a rubber policeman and centrifuged at 120 × g for 10 min. The cell pellet was re-suspended in 200 μL of Krebs-HEPES (in mm: 144 NaCl, 5.9 KCl, 1.2 MgCl2, 2 CaCl2, 11 glucose and 10 HEPES; pH 7.4) and then introduced in a 100 μL-microchamber for their cell superfusion at room temperature 22–24°C with Krebs–HEPES solution containing (in mm): 144 NaCl, 5.9 KCl, 1.2 MgCl2, 11 glucose, 2 CaCl2 and 10 HEPES at pH 7.4. The perfusion rate was 2 mL min−1. The liquid flowing from the perfusion chamber reached an electrochemical detector model Metrohm AG CH-9100, Hersau, placed just at the outlet of the microchamber, which monitors online, under the amperometric mode, the amount of catecholamines secreted. Cells were stimulated to secrete with short pulses (5 s) of a Krebs-HEPES solution containing 35 mm K+ at 5 min intervals, with isoosmotic reduction of Na+. Solutions were rapidly exchanged through electrovalves commanded by a computer. This amperometric strategy permits the online recording of reproducible catecholamine release responses during long-time periods of 50–60 min.
Currents recordings, data acquisition and analysis
Ca2+ (IBa), Na+ (INa) and K+ (IK) currents were recorded using the whole-cell configuration of the patch-clamp technique (Hamill et al., Reference Hamill, Marty, Neher, Sakmann and Sigworth1981); APs were recorded using the perforated-patch whole-cell recording technique (Korn et al., Reference Korn, Marty, Connor and Horn1991). Whole-cell recordings were made using patch pipettes of thin fire-polished borosilicate glass (Kimax 51, Witz Scientific, Holland, OH, USA) to obtain a final series resistance of 2–3 mΩ when filled with the standard intracellular solutions and mounted on the headstage of an EPC-10 patch-clamp amplifier (HEKA Electronic, Lambrecht, Germany), allowing cancellation of capacitative transients and compensation of series resistance. Data were acquired with a sampling frequency ranging between 5 and 10 kHz and filtered at 1–2 kHz. Recording traces with leak currents >100 pA or series resistance >20 mΩ were discarded. Data acquisition and analysis were performed using PULSE programs (HEKA Elektronic, Lambrecht, Germany).
Coverslips containing 5 × 10⁴ cells were placed on a chamber mounted on the stage of a Nikon Eclipse T2000 inverted microscope. During the preparation of the seal with the patch pipette, the chamber was filled with a control Tyrode solution containing (in mm): 137 NaCl, 1 MgCl2, 10 HEPES/NaOH, 0.005 tetrodotoxin (TTX), pH 7.4 (no TTX was added when measuring INa). Once the patch membrane was ruptured and the whole-cell configuration of the patch-clamp technique was established, the cell was locally, rapidly and constantly superfused with an extracellular solution of similar composition to the chamber solution, but containing nominally 0 mm Ca2+ (no EGTA added; to measure INa), 2 mm Ca2+ (to measure IK) or 10 mm Ba2+ (to record IBa) (see Results for specific experimental protocols). For INa and IBa recording, cells were dialysed with an intracellular solution containing (in mm): 10 NaCl, 100 CsCl, 14 EGTA, 20 TEA.Cl, 5 Mg-ATP, 0.3 Na-GTP and 20 HEPES⁄CsOH (pH 7.3). To record IK, CsCl and TEA.Cl were replaced by KCl.
The perforated patch was obtained using pipettes containing 50–100 ng mL−1 amphotericin B as permeabilizing agent (Sigma, Chemical C., St. Louis, MO, USA) and a pipette-filling solution containing (in mm): 135 KCl, 8 NaCl, 2 MgCl2, 20 HEPES, 5 EGTA (pH 7.3 with KOH). The external bath solution contained (in mm): 137 NaCl, 4 KCl, 2 CaCl2, 1 MgCl2, 10 HEPES (pH 7.4 with NaOH), Amphotericin B was dissolved in dimethyl sulfoxide (DMSO, Sigma) and stored at −20°C in stock aliquots of 50 μg mL−1. Fresh pipette solution was prepared every 2 h. To facilitate the sealing, the pipette was first dipped in a beaker containing the internal solution and then back-filled with the same solution containing amphotericin B. Recording started when the access resistance decreased below 20 mΩ, which usually happened within 10 min after sealing (Rae et al., Reference Rae, Cooper, Gates and Watsky1991). Series resistance was compensated by 80% and monitored throughout the experiment. The external solutions were rapidly exchanged using electronically driven miniature solenoid valves (The Lee Company, Westbrook, CO, USA) coupled to a multi-barrel concentration-clamp device, the common outlet of which was placed within 100 μ m of the cell to be patched. The flow rate was 1 mL min−1 and regulated by gravity. Experiments were performed at room temperature (22–24°C).
Current-clamp experiments were analysed using Clampfit software (Molecular Devices, CA, USA). We have selected the next detection parameter value that the events must meet to be considered an AP: the time before a peak for baseline 20 ms (pretrigger) and period to search a decay time 50 ms (post-trigger). Any AP that did not have a clear morphology or that did not exceed 0 mV was discarded.
Measurement of [Ca2+]c in population cells with Fluo-4 AM
The measurements of the changes in [Ca2+]c in BCC populations were carried out by using the fluorescent probe Fluo-4 AM (Thermo Fisher Scientific) and a microplate reader FLUOstar OPTIMA (BMG LabTech, Ortenberg, Germany). Cells were plated into black 96-well plates at high density (200.000 cells/well). After removing the medium, cells were incubated with the Ca2+ fluorescent probe Fluo-4 (Gibco-Invitrogen) (10 μ m). After 45 min, cells were washed with Krebs-HEPES buffer of the following composition (in mm): 144 NaCl, 5.9 KCl, 1.2 MgCl2, 11 glucose, 10 HEPES, pH 7.4. Fluorescence measurements were carried out on the fluorescence plate reader FLUOstar Optima (BMG Labtech GmbH, Ortemberg, Germany) using an excitation wavelength of 488 nm and recording the emission at 522 nm. At the end of the experiment, cells were incubated with Triton X-100 (5%; 10 min) to determine the maximum fluorescence (Fmax) and then incubated in the presence of MnCl2 (2 m, 10 min) to measure the minimum fluorescence (Fmin). Changes in [Ca2+]c were calculated as a percentage of the total fluorescence; Fx = (Fmeasured – Fbasal)/(Fmax – Fmin) × 100. All experiments were performed at room temperature on cells from 1 to 3 days after culture.
Chemicals
The salts to make the saline solutions were obtained from Sigma (Madrid, Spain). Tetrodotoxin citrate (TTX) was purchased from Tocris (Biogen Científica, Spain). Dulbecco's modified Eagle's medium (DMEM), bovine serum albumin fraction V, fetal calf serum and antibiotics were obtained from Gibco (Madrid, Spain). All other chemicals used were reagent grade from Merck and Panreac Química (Madrid, Spain).
Statistical analysis
Data were expressed as means ± s.e.m. of the number of cells (n) studied, from at least three different cell cultures. Student's t-test or one-way ANOVA followed by Newman–Keuls multiple comparison tests were used to determine statistical significance between means. For APs, analysis data were first subjected to a normality test (D'Agostino and Pearson Omnibus Normality test) and we found that some parameters followed a normal distribution and others did not. Thus, we applied a Mann–Whitney test in all cases. The statistical significance was established at P values smaller than 0.05 (*), 0.01 (**) and 0.001 (***).
Results
Conditioned infected medium with T. cruzi enhances catecholamine release
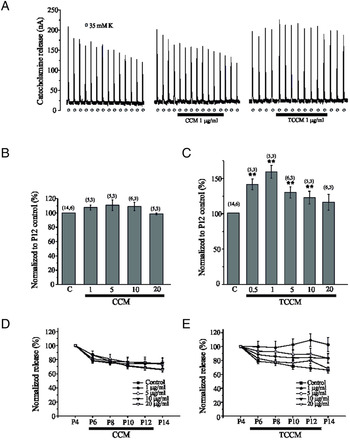
The study of catecholamine release responses can be performed through the repeated challenge with secretagogues of fast-superfused chromaffin cell populations. In the experiment shown in Fig. 1A, cells superfused with Krebs-HEPES solution had a basal steady-state spontaneous catecholamine release of about 20 nA. Upon challenge with 5 s pulses of a 35 mm K+ solution, secretion peaks of around 150–200 nA were obtained; these peaks show a constant decay when the K+ pulses were repeated at 5 min intervals. In this prototype experiment, the superfusion of the cells with a single concentration of CCM (collected from uninfected Vero cells cultured, Vero, 1 μg mL−1) from de K+ pulses P5 to P12 did not appreciably affect the size of the secretory peaks (Fig. 1A, middle panel) compared with control conditions (without the concentration of conditioned medium; Fig. 1A, left panel). In six experiments, the catecholamine release obtained in the presence of CCM (P12) amounted to 71.5% (compared with the pulse P4, immediately before the introduction of the CCM), similar to that observed in control paired experiments in the absence of CCM. With this protocol but challenging the cells with the conditioned infected medium with EP strain of T. cruzi (TCCM, 1 μg mL−1), secretory peaks of similar magnitude were obtained (Fig. 1A, right panel). The introduction of TCCM from de K+ pulses P5 to P12 drastically enhanced the secretory response. In five experiments of three different culture experiments, the release obtained in the presence of TCCM (P12) amounted to 7.1 ± 11.6% of that obtained with the pulse P4 immediately preceding the introduction of the TCCM, and to 55.6 ± 13% of that obtained with the pulse P12 in control paired experiments. Note that, upon wash-out of CCM, the secretory response was maintenance and slowly recovered to control level. The effects of increasing concentrations of CCM or TCCM on depolarising-evoked secretion were tested (Fig. 1B–E). Panels B–C show the secretion obtained in the pulse P12 and compared in control paired experiments. Panels D–E show the normalized time course of secretion (control condition and the four concentrations indicated) compared with the pulse P4 (immediately preceding the introduction of CCM and TCCM, respectively). In summary, the CCM shows no effect on catecholamine secretion, whereas the TCCM causes potentiation of catecholamine secretion (0.5, 1, 5, 10 and 20 μg mL−1 caused an enhancement of secretion of 103.7 ± 10.8, 155.6 ± 13.7, 129.6 ± 8.6, 122 ± 5.7 and 121.7 ± 12.7%, respectively) compared to P12 of control. Note that both CCM and TCCM induced no secretion in the absence of stimulatory pulse. No modification of the basal secretion was observed in the absence of K+ pulses.
Conditioned infected medium with EP strain of T. cruzi enhances the catecholamine release responses obtained in fast-superfused cells triggered by K+ stimulation. Cells were superfused with Krebs–HEPES solution containing 2 mm Ca2+ and stimulated at 5 min intervals with 5 s pulses of 35 mm K+. CCM or TCCM were applied as indicated by the horizontal bars. (A) Original records obtained in control cells (left panels), in CCM (middle panel) and TCCM (right panel). (B–C) Averaged results on the effects exerted by increasing concentrations of CCM or TCCM. Data show the secretion obtained in the pulse P12 (after 35 min of treatment) and compared with control paired experiments. (D–E) Time-curses for the averaged results of the effects exerted by increasing concentrations of CCM or TCCM at the pulses indicated compared with the pulse P4 (immediately preceding the introduction of the experimental medium). Data are means ± s.e.m. of 5–6 experiments performed with 3 different batches of cell cultures. **P < 0.01 in comparison with the control.

Time- and concentration-dependent blockade of IBa by TC
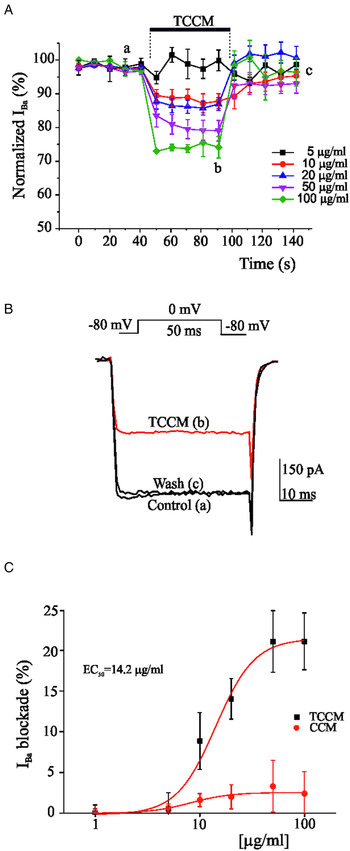
In the experiments of Fig. 2, voltage-clamped cells were stimulated with 50 ms depolarizing pulses to 0 mV, applied at 10 s intervals from a holding potential of −80 mV. The inward IBa currents were elicited with 10 mm Ba2+ as the charge carrier. In 34 cells tested, the averaged current amounted to 928 ± 48 pA. This current suffered no appreciable decline during the testing period; if a tendency to decline was observed, the cell was discarded. Once the initial current stabilized, each cell was superfused with a single concentration of CCM or TCCM until the effect stabilized, this accounted for a 1 min period. The partial recovery of IBa after washout of TCCM precluded doing cumulative concentration-response curves in the same cell. To diminish variations between data, the current was normalized, once IBa had stabilized at the beginning of the recording from each individual cell (IBa/IBa max). Figure 2A shows the time courses of IBa inhibition exerted by five concentrations of TCCM (5, 10, 20, 50 and 100 μg mL−1). Note that superfusion with CCM showed no effect on the IBa. The sharp blockade exerted by TCCM showed a concentration-dependence, and was fast with partial recovery after washout. Figure 2B shows the concentration-response curve for the blocking effect of CCM or TCCM on peak IBa. Remaining IBa was measured in each individual cell at the end of the 60 s superfusion period with each medium concentration (5 μg mL−1, 99.9 ± 3.1%; 10 μg mL−1, 87.8 ± 2.2%; 20 μg mL−1, 86.9 ± 1.9%; 50 μg mL−1, 79 ± 3.1%; and 100 μg mL−1, 75.5 ± 4%). The IC50 value was 14.2 μg mL−1. We selected the concentration of 10 μg mL−1 to conduct subsequent experiments.
Time course of the inhibition by TCCM of the whole-cell inward Ba2+ current. 50 ms depolarizing test pulses to 0 mV from a holding potential of −80 mV were applied at 10 s intervals. (A) Data points represent the maximum peak current initially obtained; with 10 mm Ba2+ as the charge carrier. Once IBa stabilized, cells were continuously superfused (top horizontal bars) with the concentrations of TCCM shown at the right. A separate cell was used for each individual drug concentration. (B) Traces represent original traces obtained in the control condition, at the end of perfusion with TCCM (100 μg mL−1), and after washout at the time indicated by letters. (C) Sigmoidal Hill function [y = start + (end–start) xn/(kn + xn)] fitted with the averaged data of the % of current inhibited after 60 s superfusion with each concentration of TCCM (square symbols) or CCM (circle symbols). IC50 was 14.2 μg mL−1. Note the little effect exerted by CCM (circle symbols). The graph plots data were normalized to the mean value of the control period and expressed as the mean ± s.e.m. of 32 experiments (3 batches of cell cultures).

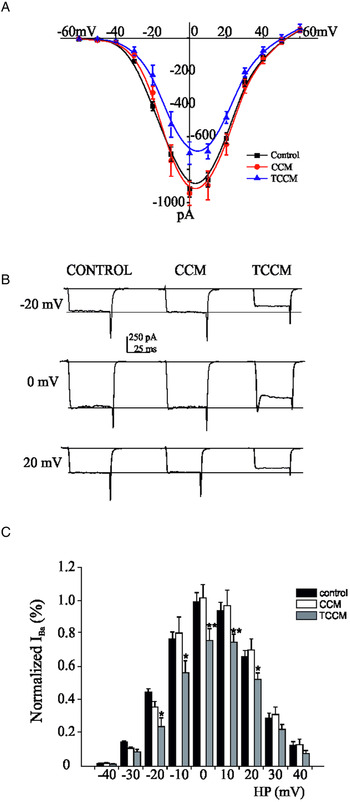
A set of voltage-clamped BCC were stimulated with depolarizing pulses (50 ms) of increasing strength given at 10 s intervals, from a holding potential of −80 mV, before and 60 s after superfusion with CCM (10 μg mL−1), or TCCM (10 μg mL−1), with 10 mm Ba2+ as the charge carrier. The current-voltage relationship shows that in control conditions, peak IBa presented a threshold of activation at around −40 mV, peaked at 0 mV and presented a reversal potential near +50 mV (Fig. 3A). After perfusion of CCM application, no modification of I-V relationship was observed. With the exception of the most hyperpolarized voltages, where TCCM induces a blockade close to 40–45%, the inhibition of IBa was similar in the rest of the potentials tested, around 20–25% (see original traces in Fig. 3B and averaged data in Fig. 3C). No modifications of current activation and deactivation kinetics were observed.
Voltage-current curves obtained before and after superfusing chromaffin cells with TCCM. (A) A set of patch-clamped cells (holding potential −80 mV) were stimulated with 50 ms test depolarizing pulses at the indicated voltages (abscissa scale); the averaged current generated is plotted on the ordinate scale in control conditions (square symbol) and after 2 min perfusion with CCM (circle symbol) and TCCM (triangle symbol) application (10 μg mL−1). (B) Original traces obtained at the voltage and experimental conditions indicated. (C) Averaged data of the Ba2+ current measured at the indicated voltages (abscissa scale) in the experimental conditions indicated in the legend. For every cell, the data were normalized to the maximum value of the control and expressed as the mean ± s.e.m. of 11–35 experiments performed with 8 different batches of cell cultures. *P < 0.05; **P < 0.01 in comparison with the control.

Infected medium with EP strain of T. cruzi show no effect of INa
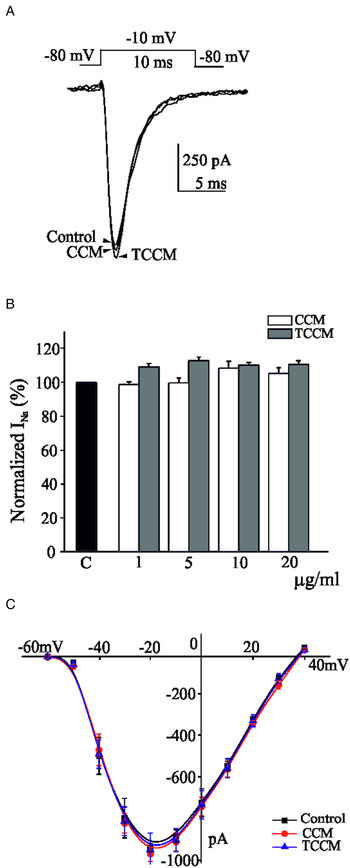
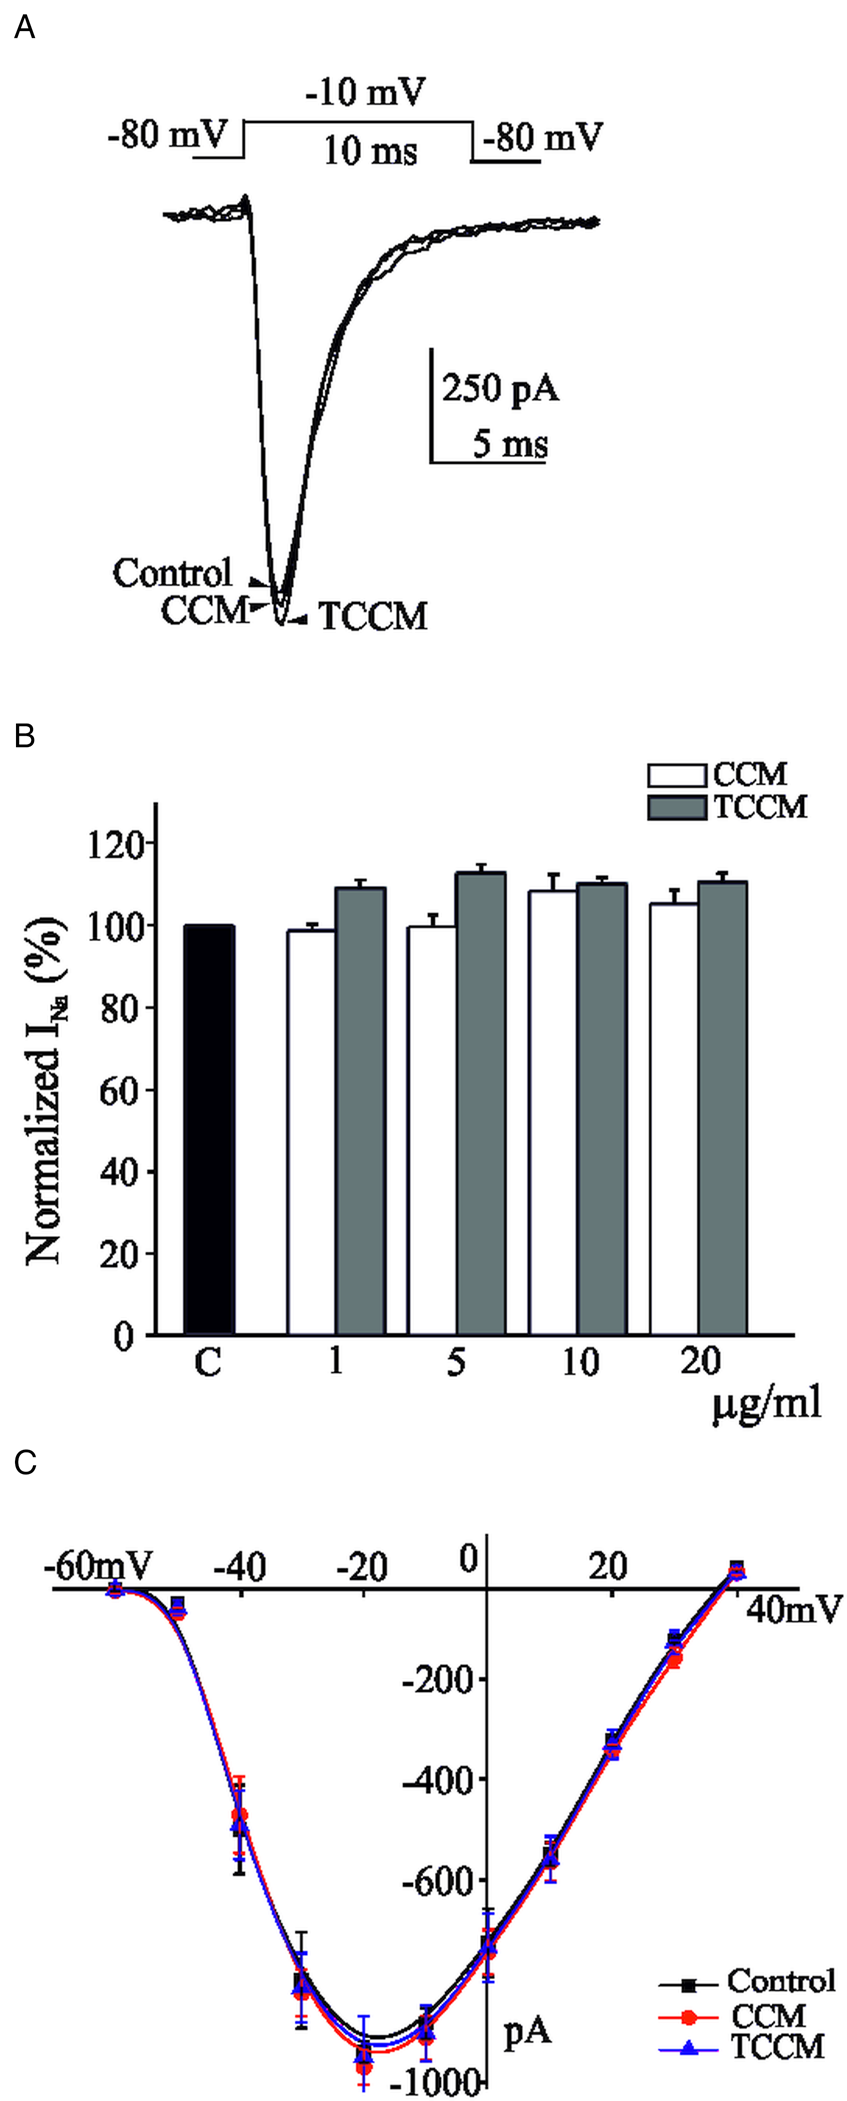
In the experiments of Fig. 4, each individual voltage-clamped cell tested was stimulated with 10 ms depolarizing pulses to −10 mV, applied at 10 s intervals from a holding potential of −80 mV. The average initial current amounted to −912 ± 73 pA (n = 28). This current suffered no appreciable decline during the testing period; as before, if a tendency to decline was observed, the cell was discarded. Once the initial current stabilized, each cell was superfused with a single concentration of CCM (10 μg mL−1) or TCCM (10 μg mL−1) for a 2 min period. Figure 4A shows original traces of INa in control conditions, and after 2 min application of both TCCM and CCM concentrated medium (10 μg mL−1). Neither CCM nor TCCM perfusion exerted any effect on the sodium current. Figure 4B shows the averaged data on normalized INa (compared with control) after perfusion with a concentration of CCM or TCCM at the concentration indicated (1, 5, 10 and 20 μg mL−1). Neither CCM nor TCCM perfusion exerted any effect on the sodium current. The higher concentration used (20 μg mL−1) evoked a blockade of 5.2 ± 3 and 10.5 ± 2% for CCM and TCCM, respectively. A set of voltage-clamped BCC were stimulated with depolarizing pulses of increasing strength given at 10 s intervals, before and 2 min after superfusion with CCM or TCCM (10 μg mL−1). Under control conditions, peak INa presented a threshold of activation at around −55 mV, peaked at −20 mV and presented a reversal potential near +40 mV (Fig. 4C). After 2 min of perfusion with TCCM or CCM, no effect on the I-V curve was observed. No modifications of current activation and inactivation kinetics were observed.
The concentration of the TCCM did not modify the inward Na+ currents. 10 ms depolarizing test pulses to −10 mV from a holding potential of −80 mV, were applied at 10 s intervals. (A) Traces represent original traces obtained in the control condition and at the end of perfusion with a concentration of CCM (10 μg mL−1) or TCCM (10 μg mL−1). (B) Averaged results of the effects exerted by increasing concentrations of CCM or TCCM after 2 min perfusion compared with control (INa measured immediately preceding the introduction of the experimental medium). (C) Averaged data obtained in −80 mV clamped cells stimulated with 10 ms test depolarizing pulses at the indicated voltages (abscissa scale); the currents generated in control conditions (square symbol) and after 2 min perfusion with CCM (circle symbol) and TCCM (triangle symbol) application (10 μg mL−1, respectively) are plotted on the ordinate scale. Data are means ± s.e.m. of 7–8 experiments performed with 4 different batches of cell cultures.
TCCM induced an irreversible blockade of Ca2+/voltage-dependent potassium currents
In the bovine chromaffin cell, as in most cell types, K+ is the ion responsible for the phenomenon of repolarization and termination of APs (Solano et al., Reference Solano, Prakriya, Ding and Lingle1995). The K+ current in the chromaffin cell is mainly associated with Ca2+/voltage-dependent K+ channels (Marty and Neher, Reference Marty and Neher1985). The distribution of Ca2+ channels in chromaffin cells remains unknown, but it has been suggested that Ca2+ and BK channels are in close proximity (Prakriya and Lingle, Reference Prakriya and Lingle1999, Reference Prakriya and Lingle2000).
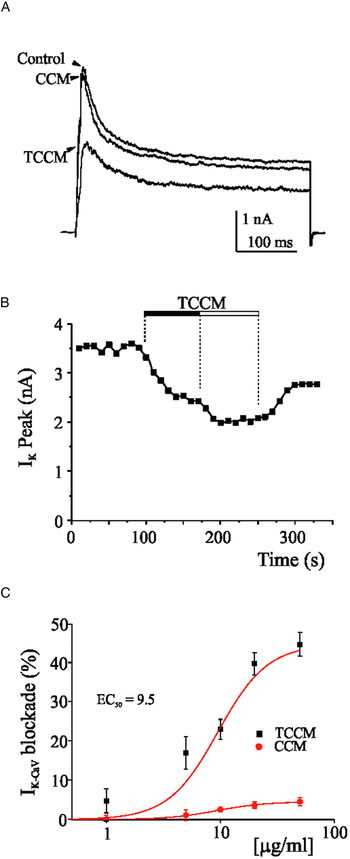
In Fig. 5A, cells were first depolarized to 0 mV (10 ms) to trigger Ca2+ influx by activation of voltage-dependent Ca2+ channels, after which a depolarization step (400 ms) to +80 mV was applied (Vm −80 mV). Ca2+ influx was elicited by brief depolarizing pre-pulses to favour sub-plasmalemmal Ca2+ rises in the vicinity of the Ca2+ channels rather than altering the ‘bulk’ cytosolic Ca2+ concentrations. At +80 mV (near the equilibrium potential for Ca2+), Ca2+ influx ceases and IKCa−v current becomes activated. In the absence of the 10 ms pre-pulse, no Ca2+-dependent current is activated, and all the outward current recorded arises from Ca2+-independent voltage-activated K+ channels (data not shown). The amplitude of the outward current activated at +80 mV in the absence of Ca2+ influx is identical to that activated at +80 mV without a preceding Ca2+ load (data not shown). This IKCa−v current decays after the closure of Ca2+ channels in a rapid and complete manner. The decay of intracellular Ca2+ concentration after the termination of Ca2+ influx is influenced by the properties of intracellular Ca2+ buffers and Ca2+ extrusion mechanisms (Roberts, Reference Roberts1993; Naraghi and Neher, Reference Naraghi and Neher1997). Using this pre-pulse protocol, we have found that the superfusion of the cells with a single concentration of TCCM (20 μg mL−1) reduced IKCa−v by 40 ± 2% from an initial IKCa−v of 3.9 ± 0.4 nA (n = 15) whereas no effect was observed after the application of TCCM (20 μg mL−1) (see Fig. 5A). Figure 5B shows the time-course of IKCa−v in cells voltage-clamped at −80 mV and stimulated with the indicated protocol given at 10 s intervals. TCCM (10 and 20 μg mL−1) elicited a progressive decay of IKCa−v until a steady-state was reached upon about 2–3 min of perfusion with TCCM, at around 23 and 40% amplitude of the initial current, respectively. Figure 5C shows the concentration-response curve for the blocking effect of TCCM and CCM on peak IKCa−v. Inhibition of IKCa−v was measured in each individual cell at the end of the 2 min superfusion period with each medium concentration. TCCM induced a depression of the IKCa−v (1 μg mL−1, 4.8 ± 3%; 5 μg mL−1, 17.1 ± 4%; 10 μg mL−1, 23.1 ± 2%; 20 μg mL−1, 40 ± 2%; and 50 μg mL−1, 45 ± 3%) whereas CCM shows no effect. The IC50 value for the depression exerted by TCCM was 9.5 μg mL−1.
Concentration-dependent depression on BK channels exerted by the TCCM. (A) Cells clamped at −80 mV and depolarized to +80 mV after a 10 ms conditioning prepulse to 0 mV. The prepulse produces calcium influx and activates a large amount of BK current (control). CCM and TCCM (20 μg mL−1, respectively) were applied for 3 min. Traces represent the maximal blockade observed. (B) Time course of IKCa−v obtained with the protocol indicated in (A) before, during and after successive perfusion of TCCM (10 and 20 μg mL−1, respectively) during the time indicated by the top horizontal bar. (C) Averaged results of the % of current inhibited exerted by TCCM (square symbols) and CCM (circle symbols) after 3 min superfusion with each concentration pointed. Sigmoidal Hill function y = start + (end–start) xn/(kn + xn) fitted with the averaged data of the % of current after 60 s superfusion with each concentration of TCCM (square symbols) or CCM (circle symbols). IC50 was 9.5 μg mL−1. Note that Vero shows no effect on IKCa−v. Data are means ± s.e.m. of 6–9 experiments performed with 4 different batches of cell cultures.

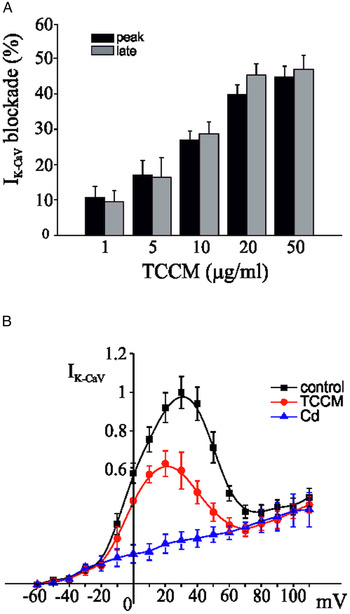
As above indicated, the short (10 ms) prepulse to 0 mV (10 ms) to trigger Ca2+ influx followed by the strong depolarization step to + 80 mV rises an IKCa−v. This IKCa−v current decays in a rapid and complete manner. The averaged data shown in Fig. 6A show that the introduction of TCCM into the superfusion caused an equal decline of both peak and late current at the concentration tested. At the end of the washout period, both peak and late current reached a similar amplitude of about 40% of the initial IKCa−v (data not shown).
TCCM depresses the BK channels. (A) Averaged data obtained in −80 mV clamped cells stimulated with 400 ms test depolarizing pulses ( + 80 mV) after the prepulse indicated above. The cells were superfused with the TCCM indicate in the abscissa scale. The columns represent the blockade of IKCa−v observed after 3 min perfusion TC (20 μg mL−1) at peak and late (end of pulse stimulation). (B) Panel shows the outward K+ current vs membrane potential during the test depolarization (I-V plot), before and during perfusion with the TCCM (20 μg mL−1; circle symbol). Note that only the Ca2+/voltage-dependent K+ current hump is affected by the exogenous drug application. In the presence of the Ca2+ channel blocker Cd2+ (100 μ m, triangle symbol), no Ca2+-dependent current is activated, and all the outward current originates from the opening of voltage-dependent K+ channels. The graph plots data were normalized to the mean value of the control period. Data are means ± s.e.m. of 6–9 experiments performed with 4 different batches of cell cultures.

The Ca2+/voltage-dependent K+ channels can be identified by a characteristic hump of the I-V curve (see Fig. 6B). When Ca2+ influx is prevented by 100 μ m Cd2+ application, a large fraction of K+ outward current is inhibited and the hump in the current–voltage relationship disappears. Comparison of the current–voltage relationship in the presence and absence of Ca2+ influx indicates that in the range between about −30 and +20 mV (values of membrane potential associated with the AP), most K+ outward current is Ca2+/voltage-dependent. Outward currents were activated by depolarization steps (400 ms in duration, preceded by a 10 ms depolarization pulse to 0 mV) repeated every 10 s from a −80 mV holding potential with +10 mV increments, in 2 mm external Ca2+, as a function of voltage. IKCa−v presented a threshold of activation at around −40 mV, and as indicated, this relationship exhibits a pronounced hump. The hump of the current–voltage relationship appears to mirror the current–voltage relationship of the Ca2+ current in these cells. After 3 min application of TCCM (20 μg mL−1), a substantial reduction in the peak IKCa−v was observed. Note the drastic reduction of the IKCa−v amplitude evoked by the TCCM at +40 mV, where the contribution of Ca2+/voltage-dependent K+ channels to the total outward K+ is higher than at more depolarizing potentials. The remaining outward current, voltage-dependent potassium current (IKv), was little affected by TCCM. In the presence of the Ca2+ channel blocker Cd2+ (100 μ m), no Ca2+-dependent current is activated, and all the outward current originates from the opening of voltage-dependent K+ channels.
TCCM medium with T. cruzi enhances the [Ca2+]c levels
Previous experiments have shown the drastic enhancement of catecholamine secretion exerted by the application of the TCMM. But the concentrations of this medium that induce maximal secretion exerted no effect on calcium currents. This fact leads us to think that the origin of the calcium necessary to activate the secretory machinery is not exclusively extracellular but intracellular. This has led to the design of the experiments represented in Fig. 7. The measurements of the changes in [Ca2+]c in populations were carried out by using the fluorescent probe Fluo-4 AM. After 10 s recording the basal fluorescence of the cell population, a 10 s stimulus with K+ (35 mm) was applied, which produced a rise of the fluorescence that is maintained during the rest of the experiment that goes on for a minute. Figure 7A shows original recordings obtained in the absence (control) and in the presence of CCM (10 μg mL−1) or TCCM (10 μg mL−1). Note that the application of CCM and TCCM without cellular stimulation (WS) shows no enhancement of fluorescence signal. Figure 7B shows the mean values of the effects exerted by increasing concentrations of CCM and TCCM. In contrast to CCM that produced no effect, TCCM application produced a [Ca2+]c elevation in bovine chromaffin cell populations in comparison with the control condition (1 μg mL−1, 103.9 ± 9.2%; 5 μg mL−1, 117.5 ± 7.8%; 10 μg mL−1, 147.4 ± 14.6%; and 20 μg mL−1, 121.9 ± 7.2%). This effect in the calcium-dependent fluorescence signal becomes statistically significant with the concentrations of TCCM (5 and 10 μg mL−1).
Effects of TCCM on [Ca2+]c. (A) Original trace of the Fluo-4 fluorescence induced by K+ in the absence (control) or presence of CCM or TCCM (10 μg mL−1, respectively). WS traces represent the absence of endogenous signals evoked by both media, CCM and TCCM. (B) Graph comparing the percentage of the effect in fluorescence in the absence (control) or presence of CCM and TCCM at concentrations indicated in abscissa. The values have been normalized with the maximum fluorescence increment produced with K+ (35 mm). Data correspond with the mean values ± s.e.m. (n = 9, 3 different batches of cell cultures). AFU, Arbitrary Fluorescence Units. **P < 0.01 in comparison with the control.

TCCM induces a depression of evoked APs
Using perforated-patch recording and 2 mm external Ca2+, APs could be elicited in chromaffin cells by current injection through the recording electrode. The depolarization needed to trigger an AP in response to the current injection (~10 pA; 400 ms in duration) was about 10 mV above the resting potential. Only the AP elicited by the depolarizing pulse was used for analysis because BCC do not fire spontaneously. If the current pulse was made longer, the amplitude of the spike decreased with time, and the regular firing was interrupted near the end of the pulse by a progressive decline of spike amplitude, probably due to inactivation of Na+ currents caused by sustained depolarization (data not shown). After 1–2 min of perfusion with CCM (20 μg mL−1), no effect was observed. However, during TCCM (20 μg mL−1) application, AP firing was fully avoided (Fig. 8A). In the presence of the TCCM, APs became progressively lower and broader with a concomitant decrease in afterhyperpolarization (AHP) amplitude. Finally, the membrane potential showed a prominent plateau phase. These effects could be related to the progressive decrease in AHP duration during the pulse due to the smaller Ca2+ influx and the small sustained depolarization, which together lead to Na+ current inactivation and the increasing difficulty to generate APs. No recovery in amplitude and frequency of APs occurred after TCCM wash-out (3 min). Figure 8B shows an isolated AP evoked by a very short step (10 ms) of 10 pA injected current applied at 10 s intervals. Following the TCCM (20 μg mL−1) perfusion, a progressive decrease of AP amplitude was observed (from 65.5 ± 2.6 mV in control to 51.1 ± 2.0 mV) with a slower rise and decay time (from 5.8 ± 0.3 ms in control to 6.5 ± 0.3 ms; and from 3.1 ± 0.2 ms in control to 4.8 ± 0.5 ms, respectively). In the same way, this slow-down of the AP is accompanied by a dramatic broadening, an increment in mean half-width (from 5.2 ± 0.3 ms in control to 7.0 ± 0.3 ms) and area (from 368 ± 13.6 mV ms−1 in control to 406 ± 31.8 mV ms−1). The blockade of the ionic currents by TCCM (20 μg mL−1) also induced a dramatic decrease in the after hyperpolarization (AHP), both in the amplitude (from 13.2 ± 1.0 mV in control to 3.8 ± 0.7 mV) and in the area (from 460 ± 42 mV/ms in control to 114 ± 25 mV/ms) (see Fig. 8B and C). Most of these changes did not recover after washout (Table 1).
Depression of evoked action potentials by TCCM. (A) Current clamp records of evoked firing APs in response to low depolarising injections current (5–10 pA) applied during 400 ms in control conditions and after perfusion with CCM (20 μg mL−1) and TCCM (20 μg mL−1). Notice the suppression of oscillations in membrane potential and genesis of AP bursts under exposure to TCCM. No recovery of firing was observed after washout. (B) Isolated action potential records after a very short step (10 ms) of injected current. Note that TCCM decreased the amplitude of single APs and erase the AHP. Traces have been represented at 30 s intervals. (C) Overloaded traces of single action potential in control conditions (black trace) and after perfusion with TCCM (red trace).

Kinetic parameters of evoked individual action potential events in different experimental conditions

Data are means ±s.e.m. of 16 cells of 4 different cultures. Statistical analysis was performed by Mann–Whitney test. *P < 0.05, **P < 0.01, ***P < 0.001, respect to control. #P < 0.05, ##P < 0.01 respect to TCCM (20 μg mL−1) perfused cells.
Discussion
The effects of acute administration of conditioned infected medium with EP strain of T. cruzi (TCCM) on the excitability of BCC by analysis of calcium, sodium and potassium ionic currents, and the generation of evoked APs have been described. Thus, TCCM produces (1) a 50% of potentiation of catecholamine secretion; (2) a gradual and partial reversible blockade of voltage-dependent Ca2+ currents with an IC50 of 14.2 μg mL−1; (3) a concentration-dependent depression of the Ca2+/voltage K+ conductance with an IC50 of 9.5 μg mL−1; (4) no blockade of sodium currents, even at high concentrations; and (5) a total suppression of the generation and propagation of APs.
A fatal consequence of Chagas disease is sudden death, which can occur at any time during the development of this disease. In the chronic phase of Chagas, various studies demonstrate the persistence of the parasite in chronic cardiac lessons (Jones et al., Reference Jones, Colley, Tostes, Lopes, Vnencak-Jones and McCurley1992). Nevertheless, acute outbreaks of oral transmission have also been described where arrhythmias occur in 32% of cases, the severity of these being associated with the genetics of the parasite and the virulence of the strains, which suggests a role of the parasite in the genesis of arrhythmias (Marques et al., Reference Marques, Mendoza, Noya, Acquatella, Palacios and Marques-Mejias2013). For this reason, it is necessary to deepen the knowledge of the pathophysiological bases that can underlie sudden death in Chagas disease. A multitude of factors can intervene in the appearance of ventricular arrhythmias, individually or jointly, such as inflammation and tissue fibrosis, autonomic imbalance, the direct action of parasites, autoimmunity processes, etc. (Healy et al., Reference Healy, Viles-Gonzalez, Saenz, Soto, Ramirez and d'Avila2015). The central observation is that high molecular weight secretion of T. cruzi drastically potentiates the Ca2+-dependent exocytotic release of catecholamines from adrenal BCC. But it has been observed how, at the highest concentration of TCCM, the enhancement in catecholamine secretion is lost. This could be explained because the secretory response is dependent on both cytosolic calcium increment and extracellular calcium influx; and higher concentrations of TCCM drastically block calcium currents, thereby depressing the exocytotic process. These findings prompted the hypothesis that, by acting on calcium homoeostasis and cellular excitability, T. cruzi could modulate the release of catecholamines in chromaffin cells. Many pieces of evidences have been reported about cardiovascular risk and oversecretion of catecholamine (Grassi and Ram, Reference Grassi and Ram2016). In the early stages of infection, the parasite could use the strategy of increasing intracellular calcium levels by invading chromaffin cells that would lead to an increase in catecholamines and favour invasion. In subsequent stages, protein tyrosine kinase, phospholipase C and IP3 are involved in the signalling cascade that is initiated on the parasite cell surface by gp82 and leads to Ca2+ mobilization required for target cell invasion (Yoshida et al., Reference Yoshida, Favoreto, Ferreira and Manque2000). These findings reveal an unmask mechanism by which an increase in catecholamine levels may play an essential role in the pathophysiology of Chagas disease and open the door for new therapeutic targets oriented at improving cardiac function and therefore the quality of life of individuals suffering from this disease. Sympathetic stimulation induces changes in ECG repolarization and reduction of fibrillation threshold, facilitating the initiation of ventricular fibrillation (Shen and Zipes, Reference Shen and Zipes2014); as a result, the potentiation of depolarization-evoked catecholamine secretion evoked by TCCN represents a clear danger during the development of Chagas disease. Parasite membrane and shed/secreted protein members of the trans-sialidase family have been involved in neural survival in infected tissue (Chuenkova and Pereiraperrin, Reference Chuenkova and Pereiraperrin2011; Rodriguez-Angulo et al., Reference Rodriguez-Angulo, Toro-Mendoza, Marques, Concepcion, Bonfante-Cabarcas, Higuerey, Thomas, Balzano-Nogueira, López and Mijares2015), which made these proteins an interesting candidate for further evaluation. Additionally, the adrenal gland has been considered as a reservoir organ for T. cruzi in humans (Teixeira et al., Reference Teixeira, Magalhaes, Castro, Guimaraes, Rodrigues, Nascimento and dos Reis1995), and associated with the dysregulated synthesis of glucocorticoids and immunological imbalance (Villar et al., Reference Villar, Ronco, Fernandez Bussy, Roggero, Lepletier, Manarin, Savino, Pérez and Bottasso2013).
Ca2+ ion plays an essential role in neurotransmitter release (Katz and Miledi, Reference Katz and Miledi1968). Due to their influx through the voltage-dependent calcium channels, essentially through N- and P-subtypes in neurons (Protti and Uchitel, Reference Protti and Uchitel1993; Takahashi and Momiyamaa, Reference Takahashi and Momiyamaa1993) and L-subtype in secretory cells (Marcantoni et al., Reference Marcantoni, Baldelli, Hernandez-Guijo, Comunanza, Carabelli and Carbone2007), Ca2+ induces exocytosis by joining the SNARE protein complex (Burgoyne and Alvarez de Toledo, Reference Burgoyne and Alvarez de Toledo2000). Additionally, it has been reported that during AP firing, calcium currents are involved in both the early, slowly activating phase (prespike) carried by L-type channel that contributes to the pacemaker potential and the rapid AP upstroke; and in the late short-lasting component (postspike) carried by non-L-type channels that sustains the AP repolarization (Marcantoni et al., Reference Marcantoni, Vandael, Mahapatra, Carabelli, Sinnegger-Brauns, Striessnig and Carbone2010).
Primary cultures of BCC from the adrenal medulla express Ca2+ channel subtypes L (15%), N (35%) and P/Q (50%) (García et al., Reference García, García de Diego, Gandía, Borges and García-Sancho2006). TCCM blocks calcium current in a time- and dose-dependent manner and this blockade are reversible. Meanwhile concentration >10 μg mL−1 showed no potentiation of secretory response and lower concentrations showed no effect on IBa recording, greater concentration blocked the calcium channels. We think that the absence of effect on secretion by concentrations >10 μg mL−1 is related to their capability to induce a blockade of calcium channels. The fast time course of Ca2+ current inhibition and the lack of effects on kinetics suggest that blockade occurs regardless of the open or closed state of the channel and that the single-channel conductance may be probably reduced in an opposite manner to lipophilic compounds (Hernandez-Guijo et al., Reference Hernandez-Guijo, Gandía, de Pascual and Garcia1997). Single-channel recording should be performed to elucidate the mechanism of blockade exerted by TCCM. The lack of displacement of the I-V curve may indicate that TCCM might not have selectivity on the Ca2+ channels subtype.
BK channels subtype activation is determined by their sensitivity to voltage but greatly up-modulated by the binding of calcium to its cytosolic side. The loss of K+ current that occurs in the absence of Ca2+ or in the presence of Ca2+ channel blockers indicates the marked presence of BK channels subtype in chromaffin cells (Marcantoni et al., Reference Marcantoni, Vandael, Mahapatra, Carabelli, Sinnegger-Brauns, Striessnig and Carbone2010; Albiñana et al., Reference Albiñana, Segura-Chama, Baraibar, Hernández-Cruz and Hernández-Guijo2015). They play a role in cellular excitability by inducing AP repolarization and a fast after-hyperpolarization (Prakriya and Lingle, Reference Prakriya and Lingle2000; Scott et al., Reference Scott, Bustillo, Olivos-Oré, Cuchillo-Ibañez, Barahona, Carbone and Artalejo2011). Thus, calcium entry through L-type channels activates BK channels in hippocampal neurons (Marrion and Tavalin, Reference Marrion and Tavalin1998), whereas non-L channels are responsible for activating BK channels in the sympathetic tissue (Wisgirda and Dryer, Reference Wisgirda and Dryer1994). TCCM applied at a concentration close to the IC50 for inhibiting calcium channel resulted in a nearly 45% of blockade of BK channels in a partially reversible and concentration-dependent manner. However, concentration with no effect on calcium channel also blocked (up to 20%) BK channels. This sensitivity may be related to a direct effect on the KCa−v channels by a non-measurable effect on calcium channels closely co-localized with it. During I-V recording, a slow hump of output current, which results from an increase in cytosolic calcium due to the activation of Ca2+ channels, was observed, similar to the values reported by Lopez et al. (Reference Lopez, Espinosa, Landazuru, Linares, Allen and Mijares2011) on humans chagasic cardiomyocytes. BK channels must be located close to calcium channels given that the elevations of calcium occur in the immediate vicinity of calcium channels (Neher, Reference Neher, Heinemann, Klee, Neher and Singer1986), and they have a relatively low affinity for Ca2+ (Marty and Neher, Reference Marty and Neher1985). Although it seems that there is no direct physical contact between these types of channels (Prakriya and Lingle, Reference Prakriya and Lingle1999) and they are weakly co-localized (Sheng and Wyszynzki, Reference Sheng and Wyszynzki1997), there is a clear functional coupling between them (Prakriya and Lingle, Reference Prakriya and Lingle2000; Marcantoni et al., Reference Marcantoni, Vandael, Mahapatra, Carabelli, Sinnegger-Brauns, Striessnig and Carbone2010).
Considering that SK channels play an important role in setting the intrinsic firing frequency (Stocker, Reference Stocker2004), while BK channels regulate AP shape; and that both are activated by intracellular Ca2+ in a voltage-independent and dependent manner respectively; the modulation of calcium influx exerted by TCCM affects the functionality of these potassium channels drastically impacting the AP firing. In fact, the Carbone lab has described a functional coupling between SK and Cav1.3 channels in mouse chromaffin cells (Vandael et al., Reference Vandael, Zuccotti, Striessnig and Carbone2012).
In chromaffin cells, as in many neurons (Sun et al., Reference Sun, Xiong, Zeng, Wu, Pan, Lingle, Qu and Ding2009), calcium influx during the AP activates K+ channels contributing to the repolarization and long-lasting post-hyperpolarization that determines the frequency of firing. So, the depression of calcium influx exerted by TCCM affects the AP firing. In fact, concentrations similar to the IC50 for the blockade of Ca2+ currents cause the disappearance of APs. Also, in a healthy isolated beating rat heart, the recovery is not complete (Rodriguez-Angulo et al., Reference Rodriguez-Angulo, Toro-Mendoza, Marques, Bonfante-Cabarcas and Mijares2013, Reference Rodriguez-Angulo, Toro-Mendoza, Marques, Concepcion, Bonfante-Cabarcas, Higuerey, Thomas, Balzano-Nogueira, López and Mijares2015). It could not be a sign of the toxic effect because this specific effect of the secretome was abolished when the secretomes were incubated with chagasic patient's sera. The down-modulation exerted by TCCM on ionic currents involved in neurotransmitter release (calcium current), and in the termination of the AP (BK currents) may lead to potentially lasting alterations in cellular excitability and postsynaptic behaviour of chromaffin cells, thus other cell types also may be affected.
The depression of the APs firing caused by TCCM is associated with a progressive decrease in the amplitude of the single AP, accompanied by both an increase in their width and area, and a decrease of the AHP. TCCM may reduce the frequency of APs firing by increasing the resting membrane potential. This slight depolarization is most likely due to the blockade exerted on calcium channels (L and R-type mostly) that depress the functionality of the potassium channels involved in the repolarization and generation of long-lasting post-hyperpolarization that in turn determine the frequency of APs firing (BK and SK channels). The broadening of AP seems paradoxical since TCCM blocks primarily calcium channels and it has been reported that the blockade of these channel types is translated to a narrowing of the AP (Marcantoni et al., Reference Marcantoni, Vandael, Mahapatra, Carabelli, Sinnegger-Brauns, Striessnig and Carbone2010; Lingle et al., Reference Lingle, Martinez-Espinosa, Guarina and Carbone2018). Nevertheless, the broadening of the AP is mainly due to the blockade of BK channels responsible for the repolarization phase of the AP, which are tightly coupled to L-type calcium channels. It has been reported how the block of L-type channels causes a slight depolarization of resting potential and a broadening of APs in rat CCs due to the reduced recruiting of BK channels strongly coupled to L-type channels (Marcantoni et al., Reference Marcantoni, Baldelli, Hernandez-Guijo, Comunanza, Carabelli and Carbone2007). In fact, the large broadening of the APs produced by TCCM in this cell type is due to the higher BK channel contribution to the APs (Vandael et al., Reference Vandael, Marcantoni, Mahapatra, Caro, Ruth, Zuccotti, Knipper and Carbone2010). It is important to note the large decrease in the AHP, both the amplitude and the area, induced by the application of TCCM. This effect is Ca2+ channels blockade, which avoids both the activation of BK channels responsible for the repolarization phase of the AP and the fast phase of AHP, and presumably, the activation of calcium-dependent K+ channels (SK-conductance), responsible for the post-hyperpolarization phase which determines the arrival of the next AP (Akiyama et al., Reference Akiyama, Yamazaki, Kawada, Shimizu, Sugimachi and Shirai2010). In this way, the mild depolarization of the resting membrane that prevents the recovery of sodium channels from inactivation, together with the almost total blockade of the AHP, could explain the decrease in the firing frequency of the APs.
Besides TCCM induction of a blockade of calcium conductance, we observed a significant enhancement in intracellular calcium that may be responsible for the enhancement of catecholamine secretion. It has been reported that T. cruzi induces cytosolic calcium increasing during their invasion process (Caradonna and Burleigh, Reference Caradonna and Burleigh2011) but it seems to depend on parasite-cell contact (de Pablos et al., Reference De Pablos, Gonzalez, Solano Parada, Seco Hidalgo, Diaz Lozano, Gomez Samblas, Bustos and Osuna2011; Barrias et al., Reference Barrias, de Carvalho and de Souza2013). It should be noted that increasing sympathetic tone can be potentially generated by TCCM and favours the enhancement of intracellular calcium level, which suggests that the proteins act by complementary mechanisms to induce pro-arrhythmic conditions. It is well-known that, after sympathetic stimulation, an increase of the cardiac AP duration predisposes to depolarization and reentry phenomena and increase the probability of appearance of malignant arrhythmias (Hlaing et al., Reference Hlaing, DiMino, Kowey and Yan2005). L-type calcium channel is the primary charge carrier for after depolarization under delayed ventricular repolarization and any factor that can alter their recovery kinetics and accelerate its reactivation facilitate the occurrence of after depolarization (Lankipalli et al., Reference Lankipalli, Zhu, Guo and Yan2005). On the other hand, blocking of outward currents may be also related to increase AP duration and increased risk of arrhythmias (Kodirov et al., Reference Kodirov, Brunner, Nerbonne, Buckett, Mitchell and and Koren2004). The blockade of outward potassium current can increase the AP duration and, consequently, increase QT interval and decrease heart rate. In fact, in the ECG rat model, there is a significant negative correlation between these variables, which suggests that both factors could be combined in arrhythmia generation. The use of proteins secreted during the first infectious processes demonstrates that the parasite can modulate the chromaffin cells functionality and the catecholamine secretion, with cardiovascular implications. Bradycardia and arrhythmias may be induced in a healthy isolated beating heart by perfusion of immunogenic high molecular weight secretion proteins obtained in the same way that they used (Rodriguez-Angulo et al., Reference Rodriguez-Angulo, Toro-Mendoza, Marques, Concepcion, Bonfante-Cabarcas, Higuerey, Thomas, Balzano-Nogueira, López and Mijares2015). These proteins, used by infective trypomastigotes to invade cells, are capable of altering physiological mechanisms as neurotransmitter release and cellular excitability in healthy cells.
In summary, acute administration of TCCM induced (1) potentiation of catecholamine secretion; (2) blockade of calcium channels; (3) depression of the calcium- and voltage-dependent potassium current; (4) an increment in the cytosolic calcium; and (6) a long-lasting effect that could alter cellular excitability. The effect above reported induced by secretion protein from a conditioned infected medium could be important factors in the generation of cardiac arrhythmias observed previously ex vivo and may be extrapolated to Chagasic patients. Thus, these results may contribute to establishing the molecular basis of the effects of TCCM on the cardiovascular system. Only by clarifying and understanding the mechanisms of this lethal toxicity can effective therapeutic approaches be developed. Further studies are necessary in order to dissect the specific proteins involved in each effect and the molecular pathways involved in their modulation. These data allow us to advance in the understanding of the most important and underestimated cause of death in chagasic patients.
Acknowledgements
We acknowledge the support provided to the present study by ‘Fundación Teófilo Hernando’ and Instituto Venezolano de Investigaciones Científicas (IVIC).
Author contributions
Conducting experiments, data analysis, development of statistical analysis, A.M.B.; conducting experiments, data analysis, development of statistical analysis, R.d.P.; conceptualization, preparation, H.O.R.A.; conceptualization, writing of the original draft preparation, A.M.; conceptualization, methodology, writing of original draft, preparation, revision and editing, supervision, J.M.H.-G.
Financial support
Grants no. 305 and 1365 to A.M.B. from Instituto Venezolano de Investigaciones Científicas.
Conflict of interest
All authors declare that they have no financial or personal relationship with other people or organizations that may influence this work inappropriately.
Ethical standards
All experiments were carried out in accordance with the guidelines established by the National Council on Animal Care and were approved by the local Animal Care Committee of the Universidad Autónoma de Madrid.