Introduction
The classification of aphids has heavily relied on exterior morphologies and host plants for species delimitation and generic circumscription (Miyazaki, Reference Miyazaki1971; Blackman & Eastop, Reference Blackman and Eastop1994, Reference Blackman and Eastop2000; Heie, Reference Heie1994). However, because morphological characters are prone to variation due to adaptation to different host plants, geographic isolation and genetic drift (Moran, Reference Moran1986; Shufran et al., Reference Shufran, Burd, Anstead and Lushai2000; Anstead et al., Reference Anstead, Burd and Shufran2002; Margaritopoulos et al., Reference Margaritopoulos, Tzortzi, Zarpas, Tsitsipis and Blackman2006), published taxonomies have proven unstable (Blackman & Eastop, Reference Blackman and Eastop2000), and researchers have discovered unexpected cryptic divergences within nominal species (Margaritopoulos et al., Reference Margaritopoulos, Tzortzi, Zarpas, Tsitsipis and Blackman2006, Reference Margaritopoulos, Shigehara, Takada and Blackman2007).
The genus Aulacorthum Mordvilko 1914 is nested within the tribe Macrosiphini, which is a large part consisting of the subfamily Aphidinae (Remaudière & Remaudière, Reference Remaudière and Remaudière1997). This genus is a Palaearctic and Oriental group, famous for agricultural and forest pests, and includes polyphagous aphids such as Aulacorthum solani and Aulacorthum magnoliae (Blackman & Eastop, Reference Blackman and Eastop2000). Aulacorthum consists of two subgenera, Aulacorthum (s. str.) and PerillaphisTakahashi Reference Takahashi1965 (Remaudière & Remaudière, Reference Remaudière and Remaudière1997; Lee, Reference Lee2002; Eastop & Blackman, Reference Eastop and Blackman2005; Lee & Kwon, Reference Lee and Kwon2006; Lee et al., Reference Lee, Kim, Jan and Lee2009a,Reference Lee, Kim and Leeb). The taxonomies of this genus were mainly revised by Miyazaki (Reference Miyazaki1971) and Heie (Reference Heie1994), and new species have been subsequently assigned to Aulacorthum (Lee, Reference Lee2002; Lee & Kwon, Reference Lee and Kwon2006; Lee et al., Reference Lee, Kim, Jan and Lee2009a,Reference Lee, Kim and Leeb).
Molecular phylogenetic analysis has been employed as a powerful tool for providing better taxonomic and evolutionary understanding of several aphid taxa. For example, Coeur d'acier et al. (Reference Coeur d'acier, Jousselin, Martin and Rasplus2007) assessed the relationships of the 35 Aphis species, based on analysis of cytochrome b (CytB) and cytochrome oxidase subunit I (COI)/cytochrome oxidase subunit II (COII); and von Dohlen et al. (Reference von Dohlen, Rowe and Heie2006) used COII and elongation factor 1-alpha (EF1a) to examine correlations between aphids and their host plant associations. In Aphidinae, five mitochondrial genes, COI, COII, CytB, 12S ribosomal RNA (srRNA) and 16S ribosomal RNA (lrRNA), and two nuclear genes, EF1a and long-wavelength opsin, have been used to clarify phylogenetic relationships at the tribe, genus or species levels (Moran et al., Reference Moran, Kaplan, Gelsey, Murphy and Scholes1999; von Dohlen et al., Reference von Dohlen, Kurosu and Aoki2002, Reference von Dohlen, Rowe and Heie2006; Ortiz-Rivas et al., Reference Ortiz-Rivas, Moya and Martinez-Torres2004; Coeur d'acier et al., Reference Coeur d'acier, Jousselin, Martin and Rasplus2007). Recently, molecular phylogenetic analysis has been used to discriminate complex species groups within Aphididae together with morphometric analysis (Choe et al., Reference Choe, Lee and Lee2006; Foottit et al., Reference Foottit, Maw, Pike and Miller2010). Choe et al. (Reference Choe, Lee and Lee2006) used ten morphological characters to discriminate a Sitobion avenae complex, and Foottit et al. (Reference Foottit, Maw, Pike and Miller2010) used 20 morphological characters to identify two species of the genus Pentalonia.
In a previous study (Lee et al., Reference Lee, Kim, Jan and Lee2009a), we observed that two species of Aulacorthum, A. magnoliae (Essig & Kuwana, Reference Essig and Kuwana1918) and A. nipponicum (Essig & Kuwana, Reference Essig and Kuwana1918), have distinctly swollen siphunculi and other morphological characters that distinguish them from other congeneric species; and this led us to question whether they really belong in that genus. So, in the present study, we performed phylogenetic analyses for seven Aulacorthum species and six species from other genera sampled from various host plants, using four mitochondrial genes, COI, COII, srRNA and lrRNA, and one nuclear gene, EF1a, to resolve the taxonomic confusion within Aulacorthum. We also used morphometric analyses to determine whether A. magnoliae and A. nipponicum can be discriminated on the basis of morphological differences. Based on these results, we discussed and established a new genus for A. magnoliae and A. nipponicum.
Material and methods
Taxon sampling
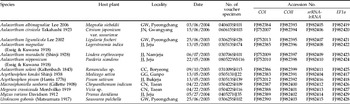
To study the molecular phylogenetic relationships and reaffirm the morphological circumscription of Aulacorthum, seven species conventionally assigned to this genus were selected, which include the type species of the genus (Aulcorthum solani Kaltenbach 1843), with six species of Macrosiphini as the outgroups (table 1). The aphid samples were stored in 95% or 99% ethanol at −20°C for genomic DNA. The identification of each aphid was performed by observing slide mount specimens using a Leica DM 4000B microscope (Leica Microsystems GmbH, Wetzlar). All slide-mounted specimens were deposited at the College of Agriculture and Life Sciences (Seoul National University, Republic of Korea).
Taxa, collecting data, Specimen identification and Genebank accession numbers.

Molecular methods
Total genomic DNA extraction was performed by using QIAGEN DNeasy Kit, according to the manufacturer's protocol. Representative species samples were extracted from individuals collected from the same colony. PCR amplification was conducted with a primer set specific to each gene fragment (supplementary table 1). The fragments to be analyzed were amplified using AccuPower® PCR PreMix (Bioneer, Korea). We used the following thermal cycle parameters for 20 μl amplification reactions: initial denaturation for 5 min at 94°C, followed by 34 cycles of 1 min at 94°C, 1 min at 43–60°C, and 1 min at 72°C and a subsequent final extension at 72°C for 5 min. PCR products were visualized by electrophoresis on agarose gels and, if single bands were observed, were purified using QIAquick PCR purification kit (QIAGEN, Dusseldorf). PCR products were sequenced directly by an automated sequencer (ABI Prism 3730 XL DNA Analyzer) at the NICEM (the National Instrumentation Center for Environment Management, Seoul National University, Republic of Korea).
All fragments were sequenced in both directions. The resulting chromatograms were evaluated for miscalls and ambiguities and assembled into contigs in SeqManTMII (SeqMan 5.01, DNASTAR Inc.). The sequences were individually checked by eye and verified for protein coding frame-shifhts to avoid pseudogenes (Zhang & Hewitt, Reference Zhang and Hewitt1996). Consensus files were aligned using Clustal X 1.83 (Thompson et al., Reference Thompson, Gibson, Plewniak, Jeanmougin and Higgins1997). Ambiguous portions of the alignment were identified using GBLOCKS 0.91b (Castresana, Reference Castresana2002) and eliminated from the data set. GBLOCKS identifies conserved blocks in multiple alignments similar to methods by which such identification is usually done by hand, but following a reproducible set of conditions.
Sequence analysis
Genetic distances between pairs of species were calculated between A. magnoliae+A. nipponicum and other congeneric species for each gene using uncorrected pairwise sequence differences in MEGA 4.0 (Tamura et al., Reference Tamura, Dudley, Nei and Kumar2007).
Phylogenetic analyses
Phylogenetic analyses were conducted for the following six data sets: COI, COII, srRNA-lrRNA, EF1a, combined mitochondrial genes (mtDNA) and combined mitochondrial and nuclear genes (mtDNA+EF1a). An incongruence length difference test was performed on the concatenated alignment to assess whether they were in conflict (alignment available upon request) (Farris et al., Reference Farris, Kallersjo, Kluge and Bult1994), with 1000 replications using PAUP* (Swofford, Reference Swofford2002).
Phylogenetic trees were obtained using three analyses: Maximum parsimony (MP), Maximum likelihood (ML) and Bayesian inference (BI). MP and ML analyses were performed for each data set using PAUP*. MP analysis was performed with a heuristic search algorithm using 1000 random sequence additions and TBR branch swapping, saving no more than 100 trees per replicate. The node support was subsequently estimated by 100 bootstrap replicates, each employing ten random addition sequences plus TBR. Prior to the ML analyses, the hierarchical likelihood ratio test was calculated for the single gene partitions using MODELTEST 3.7 (Posada & Crandall, Reference Posada and Crandall1998) to determine the best-fit substitution model of nucleotide evolution out of the 56 models implemented in the program. ML analysis was performed with heuristic searches with 1000 random addition analyses and TBR branch swapping, and 100 bootstrap replicates were performed to estimate the node support. The BI analysis was performed in MrBayes v3.1.2 (Huelsenbeck & Ronquist, Reference Huelsenbeck and Ronquist2001). Prior to phylogenetic estimation, we used the program MRMODELTEST 2.2 (Nylander et al., Reference Nylander, Ronquist, Huelsenbeck and Nieves-Aldrey2004) to select an appropriate model of sequence evolution. Based on the selected model, we performed the Bayesian analyses, which consisted of running four simultaneous chains for 500,000 generations and sampling trees every 100 generations.
Morphometric analyses
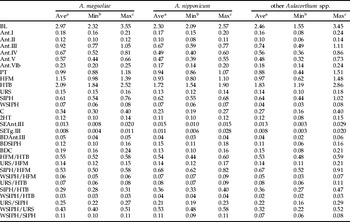
In total, 20 morphological characters, generally used to discriminate aphid species within Macrosiphini (Takahashi, Reference Takahashi1965; Blackman & Eastop, Reference Blackman and Eastop2000), were measured and compared (table 2): length of body (BL), antennal segments I, II, III, IV, V and base of VI, (Ant.I, Ant.II, Ant.III, Ant.IV, Ant.V, Ant.VIb, respectively), processus terminalis (PT), hind femur (HFM), hind tibia (HTB), second segment of hind tarsus (2HT), ultimate rostral segment (segment IV+V) (URS), siphunculus (SIPH), width of siphunculus at 2/3 of length (WSIPH), setae of Ant.III (SEAnt.III), setae of tergite III (SETg.III) and cauda (C); basal diameter of antennal segment III (BDAnt.III), siphunculus (BDSIPH) and cauda (BDC). The measurements were made on 198 apterous vivipara female specimens from 11 species (supplementary table 2), including all species used for molecular analysis (table 1), using digital images captured by a CCD, SPOT InsightTM Color Mosaic 14.2 (Diagnostic Instruments, Inc., Sterling Heights, MI) attached to the Leica DM 4000B microscope.
Comparison of measurement ranges of thirty quantitative morphological characters of Aulacorthum magnoliae, Aulacorthum nipponicum and other Aulacorthum spp.

a Average, b minimum and c maximum.
To evaluate morphological variations among Aulacorthum spp., we performed canonical discriminant analysis (CDA) using the CANDISC procedure of SAS software (SAS Institute) based on the 20 morphological characters.
Results
Sequence analysis
Uncorrected pairwise sequence divergences (p-distance) between A. magnoliae+A. nipponicum and the other Aulacorthum species were different in the mitochondrial and nuclear genes. However, the p-distance between the other congeneric species, excluding A. magnoliae and A. nipponicum, were lower than those between A. magnoliae+A. nipponicum and the other Aulacorthum species in all genes, COI, COII, srRNA-lrRNA and EF1a (table 3).
Comparison of uncorrected pairwise genetic distances of COI, COII, srRNA-lrRNA and EF1a genes within Aulacorthum.

a Average, b minimum and c maximum.
Phylogenetic analysis
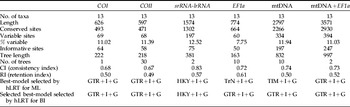
Sequence data for COI (626 bp), COII (597 bp), srRNA-lrRNA (1574 bp) and EF1a (774 bp) were aligned from a total of 13 individuals from 13 aphid species, producing two concatenated alignments of mtDNA (2797 bp) and mtDNA+EF1a (3571 bp). The incongruence length difference test did not suggest that the null hypothesis of congruent datasets should be rejected (P>0.05). Since the incongruence length difference test was not significant, and there were no major conflicts among mitochondrial and nuclear gene phylogenies, the sequences of all markers were concatenated and analyzed together.
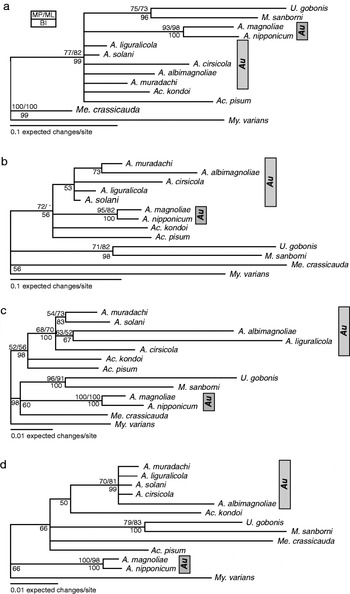
The best model to account for substitution rates was different depending upon each gene (table 4). The EF1a dataset yielded the highest value for the retention index (RI), while the srRNA-lrRNA dataset yielded the highest values of the consistency index (CI). The COII dataset exhibited the lowest confidence statistics under maximum parsimony. All individual genes generated similar topologies with low resolution for basal clades. The relationships within the genus Aulacorthum varied depending upon the gene examined (fig. 1).
Bayesian inference (BI) tree showing phylogenetic relationships among A. magnoliae, A. nipponicum and other congeneric species, with six outgroup species, Acyrthosiphon pisum, Acyrthosiphon kondoi, Uroleucon gobonis, Macrosiphoniella sanborni, Megoura crassicauda and Myzus varians, based on four single gene data sets: (a) COI (626 bp), (b) COII (597 bp), (c) srRNA-lrRNA (1574 bp) and (d) EF1a (774 bp). Numbers above branches indicate support value of MP bootstrap test with 100 replicates followed by support values of ML bootstrap test with 100 replicates, and numbers under branches indicate posterior probabilities of BI analysis.

Tree statistics for each data set.

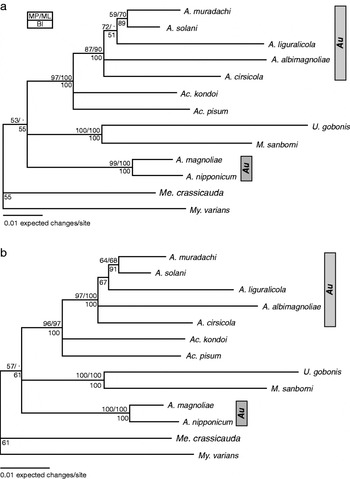
The topologies obtained by MP, ML and BI based on two combined data sets were similar, so only BI trees are shown. Aulacorthum was split between two clades in the mtDNA tree (fig. 2a). Five of the Aulacorthum species were monophyletic, while the other two species assigned to Aulacorthum, A. magnoliae and A. nipponicum formed a separate well supported clade. The nuclear gene corroborated the results of analyses of mtDNA (fig. 2b). The total evidence topology (mtDNA+EF1a) was the same as the one obtained with the mtDNA alone. The mtDNA+EF1a tree (fig. 2b) was congruent with the mtDNA phylogenetic analysis presented in fig. 2a and confirmed that Aulacorthum contains two distinct clades.
Bayesian inference (BI) tree showing phylogenetic relationships among A. magnoliae, A. nipponicum and other congeneric species, with six outgroup species, Acyrthosiphon pisum, Acyrthosiphon kondoi, Uroleucon gobonis, Macrosiphoniella sanborni, Megoura crassicauda and Myzus varians, based on two concatenated data sets: (a) mtDNA (2797 bp) and (b) mtDNA+EF1a (3571 bp). Numbers above branches indicate support value of MP bootstrap test with 100 replicates followed by support values of ML bootstrap test with 100 replicates, and numbers under branches indicate posterior probabilities of BI analysis.

Morphometric analysis
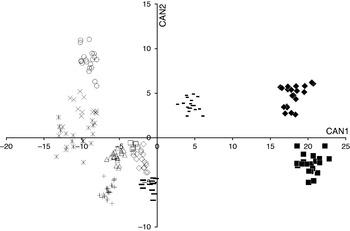
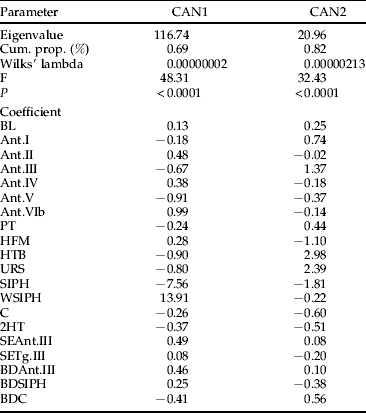
The ranges of variation for measurements of 20 morphological characters were mostly overlapped between A. magnoliae+A. nipponicum and other Aulacorthum spp. (table 2). So, to characterize the variation in exterior morphology within Aulacorthum, we performed CDA based on 20 measurements (table 5). The first and second canonical components explained 69% and 13% of the total variation, respectively, which accounted for a total of 82%. Both first and second canonical variates (CAN 1 and CAN 2) contributed to the separation of the species analyzed (fig. 3). A. magnoliae and A. nipponicum were distinguished from all other species by their much higher scores on CAN 1, and from each other by differing scores on CAN 2, while scores on both CAN 1 and CAN 2 contributed to the separation of the remaining species. The variables contributing most to CAN 1 scores (table 5) were SIPH (large negative coefficient) and WSIPH (large positive coefficient). The variables contributing most to CAN 2 were HTB and URS (positively) and HFM and SIPH (negatively).
Results of the canonical discriminant analysis based on measurements of 20 external morphological characters for the relationship among A. magnoliae, A. nipponicum and other Aulacorthum spp. (-, A. liguralicola; ▵, A. ixeridis;  , A. solani; +, A. muradachi; ◊, A. corydalicola; ▪, A. nipponicum; □, A. ibotum; ×, A. asteriphagum; ○, A. cirsicola; –, A. albimagnoliae; ◆, A. magnoliae).

Summary of canonical structures for the morphological analysis in the 11 Aulacorthum species.

Discussion
Until now, in two species, A. magnoliae and A. nipponicum, many synonym works have been conducted. Originally, both species were reported as Rhopalosiphum magnoliaeEssig & Kuwana Reference Essig and Kuwana1918 and Macrosiphum nipponicumEssig & Kuwana Reference Essig and Kuwana1918, respectively (Essig & Kuwana, Reference Essig and Kuwana1918). By Takahashi (Reference Takahashi1965), both species were firstly mentioned as A. magnoliae and A. nipponicum; thereafter, they were again synomyzed with Acyrthosiphon species by Miyazaki (Reference Miyazaki1971) and Aulacorthum species by Lee (Reference Lee2002). In the previous study (Lee et al., Reference Lee, Kim, Jan and Lee2009a), comparing with Aulacorthum spp. revealed that two species, A. magnoliae and A. nipponicum, were distinguished by a distinctive morphological feature, swollen SIPH. However, because this character is mainly observed in myzine groups such as Myzus (Börner, Reference Börner1952; Börner & Heinze, Reference Börner, Heinze and Blunck1957), we considered that additional research would be need to determine the taxonomic position of A. magnoliae and A. nipponicum.
The p-distances revealed that A. magnoliae and A. nipponicum have much larger p-distances compared with other species of Aulacorthum in all mitochondrial and nuclear genes (table 3). In particular, COI and EF1a revealed that the p-distances were more than double p-distances between A. magnoliae+A. nipponicum and the other congeneric species (table 3). The phylogenetic analysis results also revealed that the monophyly of A. magnoliae+A. nipponicum, distinct from other species of Aulacorthum, received 100% support using all methods (MP, ML and BI) and several single genes and concatenated data sets (figs 1 and 2). Especially, we selected six aphid species, Acyrthosiphon pisum, Acyrthosiphon kondoi, Uroleucon gobonis, Macrosiphoniella sanborni, Megoura crassicauda and Myzus varians, as outgroups to assess the phylogenetic position of A. magnoliae+A. nipponicum and other Aulacothum spp. in the dactynotines groups, which is one of the three groups recognized by some authors in Macrosiphini (Börner, Reference Börner1952; Börner & Heinze, Reference Börner, Heinze and Blunck1957). The analysis results of mtDNA and mtDNA+EF1a divided the 11 aphid species into three major clades: (i) two Acyrthosiphon species and five Aulacorthum species, (ii) U. gobonis and M. sanborni and (iii) A. magnoliae and A. nipponicum (fig. 2). This result suggests that the traditional genus Aulacorthum forms a non-monophyletic group, and a clade of A. magnoliae and A. nipponicum is genetically separated from the other congeneric species.
The CDA results demonstrated that A. magnoliae and A. nipponicum could be distinguished from the other Aulacorthum spp. (fig. 3). However, comparing the measurements of the 20 morphological characters demonstrated that both species are partially included within the range of Aulacorthum spp. (table 2). In this study, we tried to find morphological key characters to discriminate A. magnolia+A. nipponicum from other Aulacorthum spp. Because both species were distinguished by HFM, HTB, URS, SIPH and WSIPH in CDA, we tested these five morphological characters as classification keys for A. magnoliae and A. nipponicum, using the measurements and their ten ratios sets: HFM/HTB, URS/HFM, SIPH/HFM, WSIPH/HFM, URS/HTB, SIPH/HTB, WSIPH/HTB, URS/SIPH, WSIPH/URS and WSIPH/SIPH (table 2). The analysis results showed that even though most of the ratio sets had mostly overlapping ranges, similar to the results obtained by comparing the measurements, WSIPH/SIPH revealed distinctive range values for A. magnoliae+A. nipponicum (table 2). Two species, A. magnoliae and A. nipponicum, were ranged from 0.09 to 0.11 with average 0.11, whereas other Aulacorthum spp. ranged from 0.06 to 0.08 with average 0.07. This result indicated that WSIPH/SIPH is useful as key characters to distinguish A. magnoliae+A. nipponicum from other Aulacorthum spp.
Our several results revealed that A. magnoliae and A. nipponicum are maverick taxa that are unexpectedly quite different from other Aulacorthum spp. Based on these results, we suggest that A. magnoliae and A. nipponicum can be excluded from the genus Aulacorthum and describe a new genus for A. magnoliae and A. nipponicum below.
Neoaulacorthum, W. Lee & S. Lee, gen. nov
Type species
– Rhopalosiphum magnoliaeEssig & Kuwana Reference Essig and Kuwana1918: 59.
Included species
– Neoaulacorthum magnoliae (Essig & Kuwana Reference Essig and Kuwana1918) comb. nov.; Neoaulacorthum nipponicum (Essig & Kuwana Reference Essig and Kuwana1918) comb. nov.
Diagnosis
– Resembling Aulacorthum in having a spinulose head, well-developed antennal tubercles with steep-sided, almost parallel inner faces and median tubercle hardly developed. Differing from Aulacorthum in having front of head black, siphunculi with discernible distal swelling and dark cauda with usually five hairs (including two lateral pairs – Aulacorthum typically have a pale cauda usually with seven hairs including three lateral pairs).
Distribution
– The two species of the genus are only known from East Asia.
Etymology
– The genus name consists of Neo (Gr. neos-new)+Aulacorthum (a genus of Macrosiphini).
Acknowledgments
The authors thank Dr R.L. Blackman, The Natural History Museum, London, UK, for kindly reading and advising the manuscript. This research was supported by a grant from the Agricultural R&D Promotion Center and the project on survey and excavation of Korean indigenous species of the National Institute of Biological Resources (NIBR) under the Ministry of Environment, Korea. This work was also supported by a grant from the ‘Cooperative Research Program for Agricultural Science & Technology Development (Project No. 200901FHT051430521)’.
Supplementary material
The online tables can be viewed at http://journals.cambridge.org/ber