I. INTRODUCTION
The majority of structural materials are typically based on crystalline metals, due to their high strength and toughness. A wide range of methods has been developed to tailor the mechanical properties of metals, generally being focused on either alloying additional elements to a matrix element and/or on making use of grain refinement, i.e., increasing the volume fraction of grain boundaries. In addition, grain boundaries are prone to segregation of alloying additions, which not only changes the local chemistry but also their structure, Reference Donald and Brown1 bond strength Reference Duscher, Chisholm, Alber and Ruhle2 and according to recent findings may also lead to grain boundary phase transformations Reference Frolov, Divinski, Asta and Mishin3 —sometimes termed “complexions.” Reference Cantwell, Tang, Dillon, Luo, Rohrer and Harmer4 Two very prominent examples for grain boundary segregation are bismuth and boron additions to copper (Cu). Since both elements are almost immiscible in Cu according to their respective equilibrium phase diagrams, Reference Chakrabarti and Laughlin5,Reference Chakrabarti and Laughlin6 these elements show pronounced grain boundary segregation. Enrichment of these segregate atoms at the boundary—even at low concentrations—was shown to significantly change the macroscopic mechanical behavior of the material. Bismuth strongly embrittles polycrystalline copper, Reference Li and Zhang7 while boron increases the cohesion of a copper boundary significantly. Reference Lozovoi and Paxton8
Aberration-corrected scanning transmission electron microscopy (STEM) provides sub-Ångstrom spatial resolution at pm precision, thereby being capable to characterize the structure of crystalline materials on the atomic level. Reference Kisielowski, Freitag, Bischoff, Van Lin, Lazar, Knippels, Tiemeijer, Van Der Stam, Von Harrach, Stekelenburg, Haider, Uhlemann, Müller, Hartel, Kabius, Miller, Petrov, Olson, Donchev, Kenik, Lupini, Bentley, Pennycook, Anderson, Minor, Schmid, Duden, Radmilovic, Ramasse, Watanabe, Erni, Stach, Denes and Dahmen9 In combination with analytical methods such as energy dispersive X-ray spectroscopy (EDS) and electron energy loss spectroscopy (EELS), chemical information can even be obtained from complex material systems and their interfaces with atomic resolution. Reference Wang, Baiutti, Gregori, Cristiani, Salzberger, Logvenov, Maier and Van Aken10 However, these techniques usually require acquisition times on the order of minutes translating into high electron doses Reference Krivanek, Dellby, Murfitt, Chisholm, Pennycook, Suenaga and Nicolosi11 that may influence the sample material by beam-induced effects like knock-on and ionization damage, radiolysis, sputtering, etc. Reference Egerton, Li and Malac12 The high electron doses required in analytical measurements can activate atomic migration leading to blurring of the X-ray or EELS signal. Since the contrast of atomically resolved high angle annular dark-field (HAADF) STEM images is proportional to the mean atomic number of the atom columns (Z-contrast imaging), this imaging technique provides an alternative to extract qualitative and quantitative chemical information with a much lower required electron dose. Reference McBride, Kippeny, Pennycook and Rosenthal13 Recent studies even achieved to extract the number of atoms in individual mono-elemental atomic columns out of HAADF images of lead nanoparticles embedded in a silicon matrix, Reference Van Aert, De Backer, Martinez, Goris, Bals, Van Tendeloo and Rosenauer14 germanium clusters, Reference Van Aert, De Backer, Martinez, Goris, Bals, Van Tendeloo and Rosenauer14 gold nanorod Reference Van Aert, De Backer, Martinez, Goris, Bals, Van Tendeloo and Rosenauer14 or platinum/iridium nanoparticles on a 3D carbon black support Reference De Backer, Martinez, McArthur, Jones, Béché, Nellist and Van Aert15 and are currently investigating if this so-called “atom-counting” approach can predict numbers and positions of a second elemental species inside an individual column. Reference Van Den Bos, De Backer, Martinez, Winckelmans, Bals, Nellist and Van Aert16 Instead of taking the peak intensities of atomic columns, this analysis uses integrated peak intensities—being related to the scattering cross-section. It was found that the peak intensity of a homogenously filled atomic column increases monotonically but strongly nonlinear with sample thickness and eventually reaches saturation at about 10 nm sample thickness, while the scattering cross-section of that same column was found to also increase monotonically but much closer to a linear behavior. Reference E, McArthur, Pennycook, Okunishi, D'Alfonso, Lugg, Allen and Nellist17 Applying this approach to atom-counting, it was shown that reliable results can be obtained from single atoms and atom clusters up to 40 atoms inside individual columns, Reference Van Aert, De Backer, Martinez, Goris, Bals, Van Tendeloo and Rosenauer14 however, there are still restrictions associated to that method. Besides beam sensitive materials that decompose or change structure under an incident electron beam, factors like background intensity and dose dependence have to be considered as shown by De Baker et al. Reference De Backer, Martinez, McArthur, Jones, Béché, Nellist and Van Aert15 This study also showed that deviations of only a few mrad from an exact zone axis orientation might already strongly influence the measurement due to a reduction of electron channeling in the atomic columns. The situation becomes even more difficult for thicker samples when cross-talk between columns occurs influencing the integrated scattering cross-section by up to 11% and 16% in the case of pure platinum and palladium columns, respectively, for 10 nm thick samples. Reference E, McArthur, Pennycook, Okunishi, D'Alfonso, Lugg, Allen and Nellist17 In contrast to these atomically precise characterization methods in more or less ideal nanostructures, interfaces of thicker sample systems raise the level of complexity. Moreover, interfaces like grain boundaries involve a high number of vacancies, consequently atomic reconstructions within the interface along the electron beam direction and slight deviations from the perfect zone axis orientation represent challenges that have to be addressed in future experiments on more complex material systems.
Recently, different groups explored the possibilities of fast sequential STEM image acquisition under HAADF imaging conditions to distinguish single atoms and track their movement over time. However, most of these studies either investigated beam-induced migration of single atoms in or on homogeneous and stable ceramic substrates like cerium and manganese doped w-AlN Reference Ishikawa, Mishra, Lupini, Findlay, Taniguchi, Pantelides and Pennycook18 or of single iridum atoms and clusters on MgO. Reference Han, Iddir, Uzun, Curtiss, Browning, Gates and Ortalan19 Bowers et al. recently showed dynamical beam-induced step coalescence at a grain boundary in Au in an aberration-corrected STEM. Reference Bowers, Ophus, Gautam, Lançon and Dahmen20 They stress the importance of careful knowledge about acquisition time related phenomena induced by electron beam radiation during image or spectrum acquisition. Regarding the random walk model of lattice diffusion, for instance, it is clear that atomic motion is at least linearly related to time if not even on a higher order considering the less densely packed structure of grain boundaries compared to the bulk. This is especially important for probe corrected microscopes that have sub-Ångstrom beam diameters, since the electron dose is inversely proportional to the square of that diameter. Critical steps to extract meaningful information from such image series are the alignment of the individual frames and how to deal with artifacts originating for instance from the scanning system, especially in STEM. Nonrigid registration is a currently often used method to achieve this and was shown to be able to increase precision for locating atomic column positions to the sub-pm regime. Reference Yankovich, Berkels, Dahmen, Binev, Sanchez, Bradley, Li, Szlufarska and Voyles21 Other parameters such as scan and environmental noise and dose effects are currently investigated, along with suggestions of how to analyze and interpret these effects. Reference Jones22
The addressed challenge to be solved in the present study focuses on the determination of atomic migration events that happen during acquisition of an image or a spectrum at the atomic scale, especially at points of higher excess volume, higher vacancy concentration and less stable background conditions of low displacement threshold materials. To shed light on these events, the present study investigates a silver (Ag) containing asymmetric grain boundary in a Cu(Ag) alloy. The solid solubility of Ag in Cu is less than 0.5 at.% according to the equilibrium phase diagram, Reference Subramanian and Perepezko23 promoting grain boundary segregation of excess Ag. From a materials science point of view, Cu(Ag) is particularly interesting, due to a measured diffusion anomaly above 826 K Reference Divinski, Edelhoff and Prokofjev24 that could recently be correlated to a structural grain boundary transformation (“complexion”) by atomistic simulations. Reference Frolov, Divinski, Asta and Mishin3 Regarding segregation, Seah predicted in 1980 that silver segregation at a copper grain boundary would induce rather loss of cohesion based on sublimation enthalpies and atom size. Reference Seah25 However, experimentally it was found that silver addition to a sulfur segregated grain boundary in copper could actually recover the detrimental effects of sulfur to a certain degree. Reference Korzhavyi, Abrikosov and Johansson26 From a methodical point of view, Cu(Ag) is a very suitable system for chemistry characterization by HAADF imaging, since the difference in atomic number is fairly large, i.e., Z Cu = 29, Z Ag = 47. Consequently, atomic columns containing Ag should be of higher peak intensity compared to pure Cu columns under HAADF conditions. Therefore, STEM image simulation in combination with STEM EELS thickness determination provides the required additional information needed to extract chemical information under HAADF imaging conditions, an approach that is also used for determining the number of atoms of individual atomic columns through peak integration. Reference LeBeau, Findlay, Allen and Stemmer27
The present study makes use of the high spatial resolution of an aberration-corrected STEM under HAADF imaging conditions to extract quantitative chemical information of Ag-containing grain boundary facets in Cu. It is the first approach to systematically study the influence of imaging conditions on the beam-induced atomic migration under standard, subdisplacement threshold energy conditions at a metallic grain boundary with nanoscale Ag-rich facets. The Cu(Ag) system was chosen as suitable model system exhibiting very stable, symmetric facets on an otherwise asymmetric grain boundary. Single frame acquisition is compared to serial image acquisition of different frame rates and peak intensity ratios of atomic columns of Cu and Ag were determined after digital post acquisition image processing. STEM image simulations of the symmetric Ag-containing boundary structure corresponding to the experimental observations was performed to verify the experimental assumptions and to obtain a trend on the influence of imaging conditions on the extracted Ag concentration in individual atomic columns at the boundary.
II. EXPERIMENTAL PROCEDURES
A. Sample preparation and STEM
Granular copper of 99.88 at.% purity (as determined by wet chemistry) was used to fabricate a macroscopic bicrystal making use of the Bridgman method. Two single crystalline seed crystals were set up on a polycrystalline rod to form an asymmetric tilt grain boundary with a common [100] rotation axis. From the macroscopic bicrystal, a disc of 2 cm in diameter was spark eroded containing the grain boundary. The disc was mechanically polished down to about 300 µm thickness with the finest SiC grinding paper of grit 4000 (grain size 5 µm) and electropolished by consecutive dipping in orthophosphoric acid. Ag was sputter deposited on both sides of the disc to a thickness of about 500 nm from targets of 99.99 at.% purity after sputter cleaning the Cu surface with Ar ions for 600 s to remove contaminants and the native oxide layer. Deposition was performed in an ATC-2200V machine (AJA International, North Scituate, Massachusetts). To promote Ag segregation to the boundary, thermal annealing for 120 h at 800 °C was performed in high vacuum of ∼2.5 × 10⁻⁶ mbar using a custom built heating chamber. Subsequently, 5 transmission electron microscopy (TEM) samples of 3 mm diameter were spark eroded along the boundary and again polished down to a thickness of ∼100 µm. Twin-Jet electropolishing was used in a Tenupol 5 machine (Struers, Willich, Germany) to thin the sample until electron transparency was achieved. The electrolyte was composed of 70% methanol and 30% nitric acid. Generally the hole is located close to the grain boundary. To extend the hole and electron transparent section toward the grain boundary, Ar+ ion polishing at 4 kV from both sides of the sample was applied in a Gatan PIPS II system (Gatan Systems Inc., Munich, Germany). Directly prior to STEM investigation, the sample was ion polished at 0.1 keV to remove any newly formed surface layer. The TEM sample thickness was measured by EELS in a slightly thicker area of the sample adjacent to the area of interest. This provides an upper limit for the sample thickness, which amounted to 0.45 in units of the inelastic scattering mean free path corresponding to a sample thickness of less than 45 nm.
A FEI Titan Themis 60-300 (FEI Company, Eindhoven, The Netherlands) was used to acquire STEM micrographs at 300 kV under HAADF conditions. A semiconvergence angle and an inner semicollection angle of 23.8 mrad and 73 mrad, respectively, were set up at a probe current of about 80 pA. Image acquisition followed three distinct procedures: (1) standard single frame acquisition (Single Image), (2) serial image acquisition of 17 frames at slow acquisition times (Slow Scan), and (3) serial image acquisition of 200 frames at fast acquisition times (Fast Scan) to capture more of the dynamics of Ag solutes at the boundary. For the Fast Scan, a pixel dwell time of 1 µs was chosen as lower bound to reach a sufficiently high signal-to-noise ratio to extract meaningful information. Estimation of the electron dose D was calculated according to
 $$D = {{It} \over A} = {{4It} \over {\pi \mathop {{d_0}}\nolimits^2 }}\quad ,$$
where I is the probe current, t the time, and A the probe area. A circular probe diameter d 0 of 80 pm was assumed for 300 kV and full compensation of up to third order aberrations. An electron dose rate of 1 × 10⁹ e−/Å2 s was calculated for the used microscope set up. The individual pixel dwell times (t P), frame times (t F), serial times (t S) as well as their respective local (D loc), global (D glo), and accumulated (D acc) electron doses, which were calculated according to Eq. (1) and by using the respective times mentioned above, are given in Table I.
Pixel dwell times (t P), frame (t F) and series times (t S) translate into local (D loc), global (D glo) and accumulative (D acc) electron doses of the applied imaging conditions.

The single frame image was acquired at lower magnification to capture more Ag columns, show the regular arrangement of Ag, and to minimize a possible contamination of the imaged area for the subsequent serial image series as any carbonaceous contamination layer would increase the background intensity and therefore change the intensity ratio and thus the precision for a quantitative data interpretation. Slow Scan (1024 × 1024 pixels) and Fast Scan (512 × 512 pixels) were both acquired on the exact same location of a zoomed-in region of the static image (1024 × 1024 pixels) and analyzed following the exact same procedures to ensure comparability.
B. Image processing
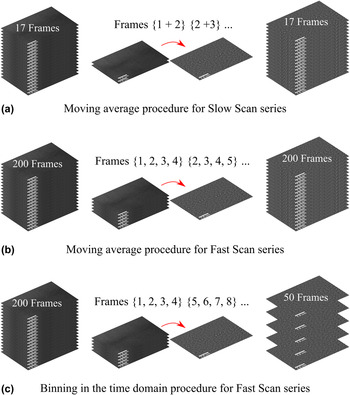
The presented electron micrographs are modified using image processing tools, i.e., different filters and averaging techniques (Fig. 1), to extract quantitative information. Nevertheless, a raw image and for the image series also an intermediate image are presented, along with the filtered images, to visualize the influence of the applied processing tools.
Schematic representation of the applied procedures for the acquired image series. For the Slow Scan Series and Fast Scan series, a moving average evolution was applied with two (a) and four (b) images being averaged, respectively. For the Fast Scan series, an additional binning procedure in the time domain was applied that also averages 4 images (c).

Three main types of image filtering are implemented in Matlab, namely Median, Gaussian, and Butterworth filtering. Filtering is performed to have a first noise reduction of the raw images in the scan series, to smooth the micrographs for peak fitting and precise peak position determination as well as to reduce low frequency noise being manifested as background intensity variations in the real image to accurately compare peak intensities after correlating the sequential images. Special attention was paid to proper alignment of sequentially acquired images.
Generally, the procedure to extract quantitative information involved the following steps. First, images from a series were aligned by cross-correlation, where image shifts between consecutive images were refined by determining the atomic column position of the brightest atomic column containing Ag to account for sample drift. Cross-correlation was previously shown to yield a column position precision of at least several picometers. Reference Jones22 For comparison, a nonrigid registration approach developed by Jones et al. Reference Jones, Yang, Pennycook, Marshall, Van Aert, Browning, Castell and Nellist28 was additionally applied with almost the same outcome to further account for scan distortions (comparison of both approaches can be seen in the Supplementary Material). In terms of noise levels, aberration-corrected TEM would be beneficial to avoid scan distortions and use lower dose rates compared to STEM, but direct elemental information would be lost and techniques such as exit-wave reconstruction Reference Hsieh, Chen, Kai and Kirkland29 along with intensive image simulations would be required. Additionally, the alignment of images to the position of the brightest Ag-containing column strongly reduces smearing out of the columns' intensity profile, which is especially important for the few Ag-containing columns, as the Cu background intensity is averaged over many columns, and for cumulatively averaged images of longer acquisition times. In the second step, the atomic column positions and the corresponding peak maxima were obtained by a peak fitting algorithm for all images. Peak intensity ratios were chosen over scattering cross-sections in this study, to actually make use of the saturation effect to get a stable separation between Ag and Cu columns. The peak intensity ratio can be compared to STEM image simulations and is used as first estimate of Ag occupancy and how it depends on the imaging conditions. The Ag-containing atomic columns were deduced by thresholding the peak intensities; the mean peak intensity within the Cu grains was taken as an internal reference for the computation of peak intensity ratios. These reference columns within the grain may contain randomly diffusing Ag atoms that are in solid solution within the Cu. Polynomial background subtraction was performed to account for enhanced Bragg scattering due to a slight twist component of the grain boundary to obtain uniform Cu column intensity within both grains, which is important for precise ratio determination of a rather pure Cu column to a partially Ag-filled column. The peak intensity ratio was determined by dividing the Ag-containing column intensity by the mean atomic column intensity within both grains.
The chosen datasets were treated similarly but with necessary minor adjustments explained in the following, especially for the scan series. The single frame images were analyzed following the general procedure above on as-captured images and the corresponding filtered images (Gaussian and Butterworth) to assess the influence of filtering on quantitative chemical characterization. The Fast Scan series was treated in two distinct ways, one exactly as the Slow Scan series, the second in a way to effectively approach the Slow Scan series dose wise by cumulatively averaging several images of the series and then doing the same analysis. The individual raw frames were summed up in both cases and the resulting images filtered (Gaussian and Butterworth). Chemical information was then extracted as in case of the Single Image following the general procedure.
To capture dynamic changes of individual Ag columns in the Slow Scan series, two successive raw frames were first Median filtered and subsequently cumulatively averaged to increase the signal-to-noise ratio. The resulting image was filtered by a Gaussian and Butterworth filter and an area only containing three Ag columns was cut out (digitally zoomed in). Dynamic chemical information was extracted as described above in a moving average kind of manner over time using overlapping windows of 2 cumulatively averaged frames (frames 1 + 2, 2 + 3, etc.). The Fast Scan acquired on the same location as the Slow Scan was treated in three distinct ways. Again, the individual 200 frames were summed up and the resulting image background was subtracted and filtered. Similar to the Slow Scan, 4 raw frames were Median filtered and cumulatively averaged, the resulting image was then filtered and analyzed in terms of peak intensity ratio determination. To capture the dynamic peak intensity ratio evolution over time, two similar but distinct approaches were chosen. A moving average approach as used for the Slow Scan (frames 1−4, 2−5, etc.) was applied using overlapping windows of now 4 consecutive frames, in contrast to a coarser binning kind of averaging in the time domain using nonoverlapping windows of 4 consecutive frames (frames 1−4, 5−8, etc.). The latter approach was chosen to effectively imitate a Slow Scan series by reduction of 200 frames to 50 and increasing the effective acquisition time. A schematic representation of the procedures described above to analyze the Slow Scan Series and Fast Scan Series is provided in Fig. 1.
The peak intensity ratio of the intragranular mean Cu(Ag) background and Ag-containing columns is not yet a truly quantitative concentration, since that ratio also depends on sample thickness. Consequently, STEM image simulations were performed for various thicknesses and Ag occupancies of individual columns in an idealized symmetrical Σ5(210) grain boundary segment.
C. STEM image simulation
The simulated STEM images of a relaxed Σ5(210) grain boundary in Cu with different Ag contents are obtained by an implementation of the multislice algorithm Reference Kirkland30 in Matlab. The structural units of the pure Cu grain boundary close to the interface were taken from Frolov et al. Reference Frolov, Olmsted, Asta and Mishin31 Ag atoms were randomly distributed within experimentally found Ag sites of the symmetric kite structure, i.e., the coincidence lattice sites, replacing 25, 50, 75, and 100% of the Cu atoms in the respective column. A semiconvergence angle of 23.8 mrad and a theoretical probe size of 0.02 nm were realized for all simulations. The signal was integrated over a semicollection angle range between 73 and 200 mrad. The parameterization of the two-dimensional projected atomic potentials was implemented following Kirkland. Reference Kirkland30 More than 100 frozen phonon configurations are used to include thermal atomic vibration. The mean square atomic displacements of Cu and Ag were taken from Peng et al. Reference Peng, Ren, Dudarev and Whelan32
III. EXPERIMENTAL RESULTS
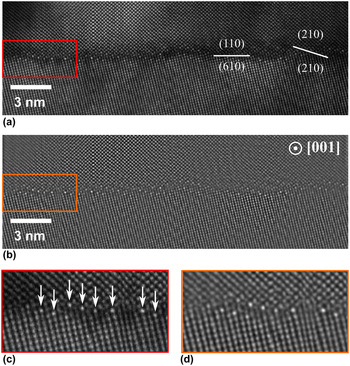
An asymmetric bicrystal was successfully grown according to the set-up misorientation of the seed crystals, i.e., a misorientation angle of 58° was found by electron backscatter diffraction as well as high-resolution STEM. Figure 2(a) shows an as-captured HAADF-STEM micrograph of the Ag-segregated grain boundary acquired at a dwell time of 15 µs. Both grains were observed close to their crystallographic [001] tilt axis. The overall grain boundary orientation can be described as 58° [001], (110)/(610) with repeating symmetric 58° [001], (210) nanofacets that correspond to a symmetric Σ5(210) grain boundary orientation within the Brandon criterion (±6.71° around 53.18°). These nanofacets contained three to four regularly spaced bright atomic columns compared to the intragranular atomic columns. Artifacts introduced by the scanning system like expanded, compressed, or bent lattice planes could be identified. Within the individual grains long range contrast changes were found most likely resulting from a bent sample and therefore differently fulfilled Bragg conditions. The same image after filtering (Gaussian and Butterworth) is presented in Fig. 2(b). The bright atomic columns remain clearly visible, while the long range contrast changes were replaced by more or less uniform background intensity. Artifacts (image distortions) from the scanning system are unaltered. Figures 2(c) and 2(d) represent the areas used to extract quantitative information in a static unfiltered and filtered state (Single Image), respectively. Peak intensity ratios of bright atomic columns were calculated to be 1.36 ± 0.11 (unfiltered) and 1.28 ± 0.09 (filtered), respectively, averaging over the eight most apparent columns [indicated by arrows in Fig. 2(c)]. All peak intensity ratios, also of the Slow Scan and the Fast Scan, are summarized and visualized in the Discussion section (Fig. 7).
Single Image of the Ag-segregated asymmetric Cu grain boundary. The acquired raw image is presented along with the crystallography in (a). The filtered image used to study the influence of image processing on peak intensity ratio determination (b). Enlarged views of the respective areas used for extraction of chemical information for the unfiltered state (c) and the filtered state (d). Arrows indicate atomic columns that were analyzed.

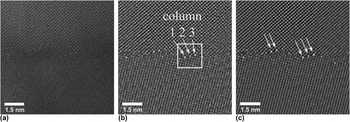
In case of the Slow Scan series that was obtained at a pixel dwell time of 5 µs, Fig. 3(a) presents a representative raw frame of the series. Most obvious was the reduced intensity in the image compared to the Single Image; however, there was still sufficient intensity to identify the brighter Ag-containing atomic columns. Artifacts of the scanning system were less apparent but could still be identified, especially the Fast Scan noise. To capture more of the dynamics and to achieve a better peak intensity ratio determination, two of these raw frames were filtered and cumulatively averaged [Fig. 3(b)]. The bright Ag-containing atomic columns are still clearly visible. Scanning artifacts seem to be reduced compared to Fig. 2(b) and even the structure of the symmetric facets can be identified in such an image. The right highlighted facet containing three bright columns was chosen for peak intensity ratio determination over time. The resulting ratio versus time profile is presented in the Supplementary Material (Fig. S1). The ratio of column 1 [Fig. 3(b)] over time was averaged to be 1.77 ± 0.16, while the ratio of column 2 was calculated to be 1.55 ± 0.20, and the ratio of column 3 to 2.05 ± 0.10. The cumulatively averaged and filtered Slow Scan summed up image using all 17 frames is presented in Fig. 3(c). A significantly increased signal-to-noise ratio was found and only reduced scanning artifacts remained including Fast Scan noise. The atomic structure of the symmetric facets is resolved and, in addition, the asymmetric parts of the grain boundary became more accessible in terms of structure compared to individual raw frames or in case of two summed frames. The five apparent bright columns (indicated by arrows) were chosen to determine an averaged mean peak intensity ratio of 2.01 ± 0.20 that can effectively be compared to the Single Image's ratio.
A representative raw frame of the Slow Scan series is shown in (a), while a cumulatively averaged and filtered image from two raw frames is presented in (b). The time evolution of peak intensity ratios was extracted from the three major peaks in the highlighted area. The cumulatively summed up image of all 17 frames of the series is provided in (c) with atomic columns taken for analysis indicated by arrows.

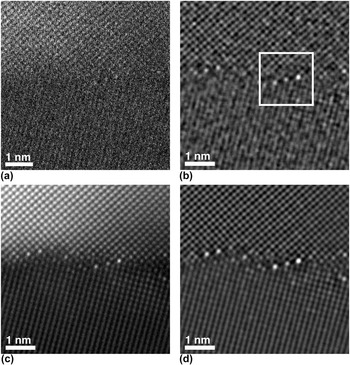
A representative raw frame of the Fast Scan series acquired at a pixel dwell time of 1 µs is provided in Fig. 4(a). The signal-to-noise ratio was just sufficient to trace atomic column positions in the upper grain, while only lattice planes are discernable in the lower grain. Positions of bright atomic columns at the grain boundary were hardly recognizable. The situation changed if four of these raw images were cumulatively averaged and filtered as shown in Fig. 4(b). Bright columns could clearly be identified and atomic positions became much more apparent. Atomic columns of the grain interior revealed random mosaic-like intensity increases, while the bright columns of the nanofacets remained the most intense ones. This averaged image was the basis to dynamically track the peak intensity ratio of the central three Ag columns within the highlighted frame. To effectively mimic a Slow Scan series with these averaged frames, a binning in the time domain was used to track the peak intensity ratio over time. The peak intensity ratios of the left (1.88 ± 0.13), middle (1.81 ± 0.15), and right (2.01 ± 0.13) atomic columns in the highlighted frame were tracked and the resulting profile is provided in the Supplementary Material (Fig. S1). Similarly to the Slow Scan series before, peak intensity ratios were tracked over time in a moving average fashion for the left (2.47 ± 0.28), middle (2.05 ± 0.27), and right (2.90 ± 0.11) atomic column as well. A rigidly aligned, unfiltered sum image of the 200 individual frames is shown in Fig. 4(c), where the atomic structure of the grain boundary is well resolved, especially at the symmetric facets. However, the upper grain is closer to perfect zone axis orientation and the atomic column intensity is therefore brighter compared to the lower grain. The bright Ag-containing columns were clearly distinguishable, even from the bright appearing upper grain. The mosaic-like increased intensity of random columns inside both grains was still captured, however, not as well as in the images that were only averaged over four raw frames. To effectively mimic a Single Image case, Fig. 4(c) was filtered and background subtracted and the resulting image [Fig. 4(d)] was used to determine an average peak intensity ratio for the exact same five atomic columns along the grain boundary as used for the Slow Scan series. A mean ratio of 2.14 ± 0.21 was extracted.
A representative raw frame of the Fast Scan series is shown in (a), while a cumulatively averaged and filtered image from four raw frames is presented in (b). The time evolution of peak intensity ratios was extracted from the three major peaks in the highlighted area. The unfiltered cumulatively summed up image of all 200 frames of the series is provided in (c), while the filtered image is given in (d).

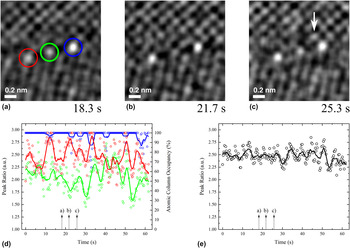
The dynamic evolution of the individual columns in the highlighted frame area of Fig. 4(b) was studied by inspection of the respective images to observe atomic migration events and the columns' peak intensity ratio was tracked over time to quantify these events in terms of Ag column occupation (Fig. 5). The three dynamically tracked Ag-containing atomic columns are encircled in different colors [Figs. 5(a)–5(c)] corresponding to the respective peak intensity ratio evolutions in the time profile below in Fig. 5(d). The time of their appearance is given in the images and highlighted on the time axis of the graph (it is referred to the Supplementary Material for the compiled video of all frames). Proper inspection revealed in (a) that the central column had lowest intensity, while the right column had highest intensity and the left column's intensity is of rather intermediate intensity. 3.4 and 7 s later, the intensities reveal clear relative changes in intensity with the temporal variations plotted in Fig. 5(d). In addition, it can be seen in Fig. 5(c) that a bright column appeared next to the right column within the symmetric kite structure (indicated by an arrow). In the open space of the kite structure between the left and the central column bright pixels were seen that imply atomic scattering through this position. In general, it has to be noted that according to the moving average peak intensity ratio evolution, the right column remained the brightest and almost exclusively constant with a peak intensity ratio of 2.94. If the ratio changed, it only decreased implying that 2.94 corresponds to the global maximum within the acquired timeframe. It is speculated that the right column is fully occupied by Ag atoms. Thus, the peak intensity ratio was linearly translated into an atomic column occupancy of 100% Ag in Fig. 5(d) (right axis). Both the central and left columns were highly dynamic and constantly increased and decreased in intensity, e.g., the central column exhibits a peak-to-valley time period of about 2.7 s on average. The average peak intensity ratio of all three columns is plotted over time [Fig. 5(e)] revealing some modulations, which indicates that Ag exchange happens not only between the 3 columns but also with neighboring regions inside the grains.
From the highlighted area in Fig. 4, the peak intensity ratio over time was extracted. Three electron micrographs (a), (b), and (c) at different moments in time are illustrated with their respective time stamps highlighting three individual atomic columns corresponding to the quantitative graph in (d). Each colored curve of the graph represents the peak intensity ratio of the respective column with the average intensity taken from within the Cu grains. The averaged intensity of all three columns over time is given in (e) highlighting the Ag inflow and outflow events to the nanofacet.

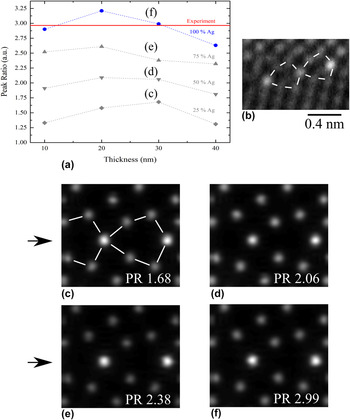
STEM simulation results were used as comparison for experimentally obtained peak intensity ratios focusing especially on sample thickness and Ag content within an atomic column (Fig. 6). The deduced ratios for the different parameters are summarized in Fig. 6(a). Four different peak intensity ratio evolutions are presented corresponding to different Ag occupancies within an individual atomic column of the symmetric (210) kite structure. The horizontal red line indicates the experimentally determined highest peak intensity ratio, which was assumed to be a pure Ag column. In general, it was seen that the profiles tend to follow a hyperbolic trend with a maximum being located between 20 and 30 nm TEM sample thickness. In addition, the experimentally found ratio agrees well with a simulated, fully occupied (100% Ag) atomic column in a 10 nm or 30 nm thick sample. The experimental reference structure of the symmetric Ag-containing (210) facet is shown in Fig. 6(b). All three Ag columns were connected by the same motif, in literature described as a kite structure. Reference Frolov, Olmsted, Asta and Mishin31 According to these experimental findings, STEM image simulations were set up. Image simulation results for a thickness of 30 nm are visualized in Figs. 6(c)–6(f) for varying Ag occupancies of 25%, 50%, 75%, and 100%, respectively. Extracted peak intensity ratios are stated as inset.
STEM image simulation results are presented. Graph (a) summarizes all simulated peak ratios for different thicknesses and Ag occupancies of individual atomic columns. The horizontal line indicates the experimentally found peak ratio for an almost fully occupied column. The experimental grain boundary structure of the symmetric Σ5(210) facet is obtained from digitally zooming in to Fig. 3(c) with structural guidelines being overlaid in (b). Simulated STEM images are presented for a constant thickness of 30 nm in (c)–(f) along with their extracted peak ratios (PR), respectively. Ag columns were introduced in the boundary plane by black arrows in front of (c) and (d) according to the experimental findings in (b).

IV. DISCUSSION
Ag segregation toward the asymmetric grain boundary resulted in regularly spaced symmetric (210) nanofacets along the interface. These usually exclusively consist of 3–4 bright atomic columns compared to the surrounding columns within the grains. Bright columns of higher intensity in HAADF conditions result from increased scattering of higher atomic number elements like Ag compared to Cu. EDS confirmed Ag enrichment at the grain boundary (see Supplementary Material). Beam-induced migration events at the symmetric (210) kite structure are assumed to happen either between the Ag columns directly across the excess volume, which is considered very unlikely due to the large jump distance, or along other paths assuming a coupled collective migration between Ag columns within a single nanofacet, as observed experimentally.
Regarding knock-on beam damage during image acquisition, the maximum energy transferred during a head-on elastic scattering event between a 300 kV incident electron and a Cu lattice atom was calculated to be about 12.5 eV. Reference Egerton, Li and Malac12 The threshold energy to displace a Cu atom from its lattice site, however, is ∼20 eV corresponding to an incident energy of 420 keV. Reference Egerton, Li and Malac12 In case of Ag, a similar threshold energy of approximately 21 eV was found, Reference Grønlund and Moore33 however, only 7.4 eV are elastically transferred. The situation changes at interfaces with a certain excess volume like a grain boundary due to the lower coordination of atoms there. In Ag, the energy required to displace an atom from the surface, probably the lower bound energetic case, is reduced to 3 eV. Reference Grønlund and Moore33 In the present study, it is expected that the transferred energy is just high enough to either strongly deflect atoms from their boundary site or even displace them into neighboring vacancies or less likely substitute lattice positions, with Cu being more affected due to the higher transferred energy.
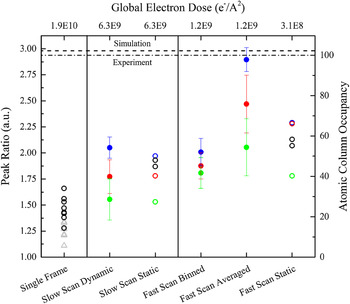
All experimentally determined peak intensity ratios are summarized for the individual imaging conditions and their respective global electron doses D glo (per frame) for comparison (Fig. 7). The ratios are set in relation to the atomic column occupancy that was linearly interpolated from 0% for a peak intensity ratio of 1 (pure Cu) to 100% for a ratio of 2.94, the maximum ratio found in our experiments. First, the results of the three distinct image acquisition schemes are discussed separately. Afterward the findings are correlated between these schemes to finally summarize the impact of imaging conditions, respectively, electron dose, on the qualitative and quantitative chemical information obtained from HAADF images at impurity decorated grain boundaries.
Master plot including all determined peak intensity ratios for the different acquisition procedures and their respective doses. Atomic column occupancy is normalized to the highest determined peak ratio of the Fast Scan Average series that is shown to be very likely a full atomic column by simulations. The Slow Scan captures similarly well the relative atomic column ratios but underestimates the exact occupancy of an individual column while static and Single Image acquisition is shown to always misinterpret the chemical information as well as lacking the dynamics of the observed system. Open symbols represent peak ratios of individual columns, colored points are used for the same atomic columns defined in Figs. 3 and 4 and gray triangles refer to columns of the unfiltered static image.

In case of Single Image acquisition, the influence of filtering was examined, which was applied to reduce effects from diffraction contrast, due to the disorientation of the sample, as much as possible. Background subtraction in the chosen system seems more complex compared to nanoparticle studies since the background information is still required in the chosen approach to determine peak intensity ratios but is also constantly changing due to beam-induced Ag migration at the boundary and inside the grains. No significant changes could be identified between the determined peak intensity ratios, with the filtered image's ratio being slightly above the unfiltered one but still well within its standard deviation. It is concluded that image filtering as applied in the present study is not the main influence on the quantitative information of HAADF images in the present set-up, but should always be considered. This agrees well with findings of Robb & Craven, who developed an image processing based technique on semiconductor superlattices extracting peak intensity ratio maps from HAADF images. Reference Robb and Craven34 It was shown there that background subtraction affects the peak intensity ratio by less than 1.5%.
Considering the Slow Scan series, it is found that dynamic chemical information of individual atomic columns can be extracted using the applied moving average method in form of a progressive time evolution. The calculated mean ratios indicate that clear differences can be identified between different columns. Considering the static summed up image from 17 individual frames, the mean peak intensity ratio is overestimating the ratio of at least two atomic columns, i.e., the left red and central green column.
In case of the Fast Scan series, the dynamic determination of individual and defined atomic column peak intensity ratios was achieved in a moving average manner. The highest peak intensity ratios of all imaging conditions were determined for these imaging conditions although being acquired on the exact same site as the Slow Scan and using the exact same analysis procedure. A clear difference in time is seen for individual columns (Fig. 5) resulting in clearly separated mean ratios in Fig. 7 (Fast Scan Averaged). The exact same series was used in a different manner, i.e., four individual frames were cumulatively summed up and the 200 acquired frames “binned” in the time domain using nonoverlapping windows of these four frames so that only 50 frames remained compared to the previous moving average fashion. The peak intensity ratio evolution of this binned dataset (Fast Scan Binned) surprisingly revealed strongly reduced ratios of up to about 50% for the blue bright atomic column on the right side of the nanofacet. In addition, the intensity ratio between the two left columns could no longer be differentiated and even the clearly brighter right column is no longer significantly different falling within the standard deviation of almost both the other two columns. These differences between the averaged and binned datasets clearly visualize that dynamic peak intensity ratio evolutions can no longer be captured, due to the loss of available information. The binned dataset effectively mimics a four times increased pixel dwell time and frame acquisition time/electron dose. Increasing these times or doses actually means that peak intensities of individual columns change. This becomes very clear for the blue bright column on the right side of the nanofacet. While the moving average captures minor decreases in intensity clearly, the binning procedure rather averages these migration events and is thereby effectively lowered. On the other hand, increased times or electron doses for intragranular atomic columns increases the amount of statistical Ag migration being captured. This effectively increases the reference column intensity. Consequently, both effects sum up and lower the determined peak intensity ratio. Finally, the summed up static image of all 200 frames can be used to evaluate an average concentration of several atomic columns. Compared to the binned dataset the static image slightly overestimates the mean ratio of atomic columns, while it clearly underestimates the ratio compared to the averaged dataset. It has to be noted that the unfiltered, cross-correlated image [Fig. 4(c)], for which sample drift was refined to the peak location of the brightest Ag column in the nanofacet, clearly shows atomic resolution indicating that the cross-correlation worked properly. Sample drift as well as the scan distortions were not significant explaining also the close outcome of the nonrigid registration approach (Supplementary Material).
Comparison of the three different datasets reveals certain similarities and distinct differences that result in points to be aware of when attempting to extract quantitative chemical information from structurally and chemically complex interfaces by aberration-corrected HAADF images (Fig. 7). It appears that Single Image acquisition does not capture accurate peak intensity ratios, neither in unfiltered nor in a filtered state. All extracted static mean ratios from the Slow and Fast Scan datasets were significantly higher, i.e., they are found to agree very well with each other around a ratio of 2.1, indicating the stability of the analysis procedure having in mind that both datasets were acquired at the same location and analyzed by the exact same procedure. No hydrocarbon formation was visible within the two minutes of total acquisition time for both series. In addition, beam-induced effects are shown in the present study to locally have strong effects on individual nanofacets over time but the remarkable stability of the entire nanofacet structure ensured comparable results of the two consecutive series, i.e., the flux of Ag atoms in and out the Ag-containing columns in the symmetric kites was shown to be fairly constant over time (Fig. 5). For the case of static Single Image acquisition, the peak intensity ratio and hence information on the Ag column occupation are largely underestimated since atomic migration events are averaging out the HAADF signal during acquisition. In addition, the high electron dose leads to local displacements of atomic columns and hence the atomic column peak intensity is smeared out. Considering the high mobility of the Ag atoms, it is even possible that Ag-containing columns adopt the same intensity as the bulk Cu columns even preventing a qualitative interpretation of Ag segregation. A similar underestimation of Ag column occupation is observed for simple binning, due to a loss of information in the time domain that translates to a loss of Ag migration events and hence a lower average column peak intensity. Contrarily, the moving average method is suitable to extract at least relative chemical information of individual atomic columns in case of slower acquisition times. Comparing the dynamic Slow Scan data with the dynamic Fast Scan data (Averaged) a rough agreement of the relative peak intensity ratios is seen. Applying shortest pixel dwell times (local electron doses) to reduce beam-induced migration events and to capture the atomic motion—as seen from the Fast Scan series (Averaged) far less underestimates the Ag column occupancy. In addition, the lowered dwell time reduces 1) capturing statistical occurrence of Ag atoms in intragranular reference columns and 2) averaging of Ag segregate columns, thereby being more precise in terms of peak intensity ratio determination compared to slower (lower) dwell times (local electron doses).
For precise chemical characterization, the simple HAADF contrast relation of the intensity being equal to Z α, with α being equal to 2, is rather an idealized assumption. Reference Pennycook35 In reality, α is in fact a complex function of specimen-related and microscope-related factors, like specimen thickness, crystal structure, crystal orientation, and the annular detector geometry. Reference Wang, Li, Park, Abdela, Tang and Palmer36 To find an accurate approximation of the exponent α for the chosen system and set-up, STEM image simulation was applied (Fig. 6), especially focusing on the influence of Ag occupancy of individual atomic columns and sample thickness. Image simulations were often successfully applied before, to study the influence of parameters like thickness on the peak intensity ratio of gallium and arsenic under HAADF imaging conditions. Reference Ishizuka37 Duscher et al. for instance simulated the influence of bismuth segregated atoms at a grain boundary following the experimentally determined grain boundary structure and bismuth locations therein. Reference Duscher, Chisholm, Alber and Ruhle2
The obtained findings for bismuth were then briefly applied to Ag segregation assuming the same segregation site within the kite structure. However, the performed experiments of the present study indicate a different segregation site of Ag in the kite structure as predicted by Duscher et al., but agrees with molecular dynamics simulation results by Frolov et al. Reference Frolov, Divinski, Asta and Mishin3 The experimentally determined structure found in the present study is provided along with the simulated structure. Simulations revealed a maximum peak intensity ratio for fully occupied atomic columns to be about 3.25 at a simulated sample thickness of 20 nm. Comparison with the experimental ratio of the Fast Scan series (2.94), agreement is found for simulated sample thicknesses of either 10 nm (2.9) or 30 nm (2.99). However, it should be mentioned that the experimentally determined column intensities can be tampered by a reconstruction of the grain boundary within the thin foil or by scan noise effects and the image simulations only consider a perfect symmetrical grain boundary segment without depth reconstruction. Thus, the given quantitative Ag occupation values, expressed by the extracted peak ratios, are estimates but clearly indicate that different columns in a nanofacet contain different amounts of Ag and that the determined relative Ag occupation is strongly influenced by the imaging conditions. Regarding the real sample thickness of less than 45 nm determined by EELS, a sample thickness of 30–40 nm seems most realistic. The experimentally found peak intensity ratios were previously just linearly translated into Ag atomic column occupancies under the assumption that the right column consists purely of Ag and therefore reveals the highest peak intensity ratio (Figs. 5 and 7). This assumption could be validated by the image simulation results, thereby showing the linear translation to be a reasonable approximation for quantitatively extracting chemical information. Additionally, simulation results indicate an almost linear dependence of the peak intensity ratio of Ag/Cu with thickness and therefore the ratio is a suitable measure for Ag column occupation. The accuracy is certainly not on a single atom level but can still be used in the first approach for the present complex boundary conditions to extract quantitative information over time. Especially the slight misorientation of the lower grain from perfect zone axis orientation introduces uncertainties when attempting to count the number of atoms in a column by reduced electron channeling. In addition, for sample thicknesses of >10 nm cross-talk between neighboring columns has to be considered. More thorough studies of atom-counting techniques in such systems would be very beneficial not only to extract meaningful quantitative information, but ideally to also locate the Ag atoms within the column to get an indication of the three-dimensional decoration. Reference Van Den Bos, De Backer, Martinez, Winckelmans, Bals, Nellist and Van Aert16
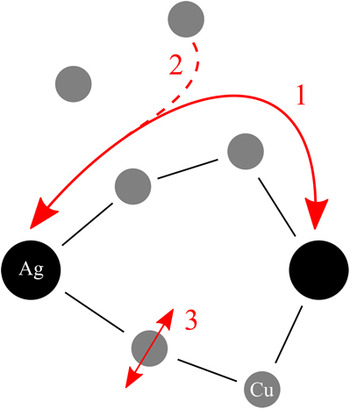
Rapidly acquired HAADF image series capture Ag migration events at nanofaceted grain boundary segments and hence the extracted peak intensity ratio evolution can be inspected that would be lost when taking single frame images (see Fig. 5). Three distinct events are shown in the representative images and highlighted in the peak intensity ratio evolution as (a)–(c). Examination of the compiled video (see Supplementary Material Fig. S3) in combination with the obtained quantitative chemistry evolution allows formulation of beam-induced migration mechanisms schematically shown in Fig. 8 and referred to as events 1–3. From Fig 5(a) to Fig 5(b) an opposing peak intensity ratio evolution is seen for the two left atomic columns in the observed nanofacet. The video indicates that this beam-induced event is likely associated to a favored migration path along the symmetric kite structure and is, to the best knowledge, the first direct dynamic visualization of such an event that occurs several times within the course of the experiment. Although there is only limited literature on atomistic diffusion mechanisms, the described findings agree well with the simulation by Ma et al. Reference Ma, Liu, Adams and Balluffi38 They simulated diffusion of Au in Ag along a symmetrical (210) grain boundary and found an overall maintained grain boundary structure with an easy vacancy-based diffusion path. Reference Egerton, Li and Malac12 According to Ma et al. several vacancies must move to facilitate the migration of the actual segregate atom. This is similar to the well-known 6 jump cycle in lattice diffusion. Reference Mishin, Herzig, Bernardini and Gust39 However, in the experiments electron beam irradiation induced interstitial or substitutional migration events within the crystal lattice, requiring a certain amount of vacancies, cannot be excluded experimentally (event 2 in Fig. 8). The last event observed in Fig. 5(c) is referred to as 3 in Fig. 8. In certain frames, the kite structure contains intensity at unexpected positions, namely the excess volume of the kite. Since the major migration path is expected to be along the structure rather than through this free volume, 3 is described as electron beam-induced displacement of either Ag atoms but more likely Cu atoms (more transferred energy per atom) within at least a single atomic column of the kite structure. It is speculated that in this case the transferred energy of an electron to that atom is not sufficient to displace it from its lattice site but still enough to partially displace it around its thermally vibrating equilibrium position. Using just slightly higher acquisition times or higher electron doses may average over too many of these events simultaneously, which might then be the reason for less captured dynamic information for Slow Scan or Single Image conditions. Interestingly, only the two just discussed atomic columns' respective intensities are significantly changing, in contrast to the third column within the facet that remains almost constant in intensity. Since combined experimental observation and simulations are able to show that it is most likely a fully occupied Ag column, a state both the other two columns do not reach over the course of the experiment, it is proposed that fully occupied atomic columns must retain an energetically favorable and stable “binding-like” configuration, similar to a metastable state. Major disturbance of this arrangement seems to transition it into a rather labile configuration leaving room for dynamic events as described above. Both of the less occupied columns should try to reach this favorable state, however, might compete with the available Ag atoms under a constant in and out flux and therefore might not reach the metastable configuration.
Schematic visualization of the identified beam-induced migration mechanisms captured by the proposed method. Favorable migration of Ag along the kite structure was identified in “1”, while absorption from (and likely also release into) as well as strong displacements around the intracolumnar equilibrium lattice position are shown in “2” and “3”, respectively.

V. CONCLUSIONS
The present study determines the influence of imaging conditions on the measured Ag column occupancy at nanofacets of an asymmetrical Cu grain boundary. In addition, insights in the atomic migration paths could be explored in the time domain using STEM. The study of atomic scale segregation phenomena at grain boundaries is of great interest to reveal the underlying segregation mechanisms. The combination of experimental STEM imaging and STEM image simulations was successfully applied to capture the influence of beam-induced atomic migration on the determined Ag occupation under typical high-resolution STEM conditions. Three distinct and comparable acquisition procedures, considering single, serial, and fast image acquisition, resulted in significantly different Ag occupation values for the individual atomic columns in the nanofacets. These findings emphasize possible artifacts due to beam-induced atomic motion that tamper the extraction of qualitative and quantitative chemical information at complex interfaces. The implications for the analyzed imaging conditions are summarized as follows:
-
(1) Single Image acquisition underestimates the determined peak intensity ratios and in the worst case can lead to chemical misinterpretation, since multiple Ag migration events are averaged during the image acquisition. In this case, the determined Ag column positions can even be misinterpreted because of the strong displacement of Ag atoms from their equilibrium positions by the electron beam.
-
(2) Serial image acquisition is considered favorable at least to sample some migration events, but with increasing acquisition times (electron doses) the accuracy of the extracted Ag occupation decreases and smears out similar to the effects described in (1).
-
(3) Shortest acquisition times just above a reasonable signal-to-noise ratio in combination with a cumulative averaging (moving average) give the highest Ag occupation values because migration of at least several atoms can be inspected and considered when extracting peak intensity ratios. However, even in this situation scan distortions and nonlinear imaging effects have to be taken into account when attempting to extract meaningful chemical information.
Supplementary Material
To view supplementary material for this article, please visit https://doi.org/10.1557/jmr.2016.398.
ACKNOWLEDGMENTS
The authors would like to cordially thank Tobias Oellers of the Rhur University Bochum for Ag sputtering onto Cu bicrystals as well as Lewys Jones of the University of Oxford for help with the nonrigid registered reference series.