



1 Introduction
Waves and breaking waves are a dominant component of the surface of seas and lakes, and play an important role in gas, heat and chemical exchanges at the interface between water and air. Breaking is a diffused phenomenon in deep water, and it is almost always present in shallow water, where it is induced by bathymetry. Breaking occurs in random locations, even if the waves are periodic and regular, such as in a laboratory flume. If a submerged bar is present, either natural or man-made, the breaking section for regular waves is nearly deterministic because the bar forces the instability. However, even though bars force the regular appearance of breakers, the phenomenon preserves an intrinsic non-deterministic variability in its flow structure and in the overall geometry. Sand bars are a morphologic feature of natural beaches, and affect the beach profile and the cross-shore wave transformation. Some measurements in the field (Gallagher, Elgar & Guza Reference Gallagher, Elgar and Guza1998) indicate that bar-intensified breaking during storms increases the undertow shoreward just near the crest, thus forcing an offshore movement of the bar, whereas low-energy wave attacks force an onshore movement of the bar. Submerged artificial berms are a widely adopted marine structure for the defence of sandy beaches and coastal areas in moderate wave climates; hence, the analysis of breakers induced by artificial berms is of practical interest. Additionally, broken waves interact with the sandy bottom and actively participate in sediment transport and local scouring.
The experimental measurement of fluid velocity in breaking waves or complex flows started with hot films and laser Doppler velocimetry (LDV) in a single point (Ting & Kirby Reference Ting and Kirby1994, Reference Ting and Kirby1995, Reference Ting and Kirby1996; Petti & Longo Reference Petti and Longo2001b ; Longo Reference Longo2003, Reference Longo2009, Reference Longo2012; De Serio & Mossa Reference De Serio and Mossa2006; Sumer et al. Reference Sumer, Guner, Hansen, Fuhrman and Fredsoe2013) and evolved into particle image velocimetry (PIV) in planes (Lin & Rockwell Reference Lin and Rockwell1994; Dabiri & Gharib Reference Dabiri and Gharib1997; Chang & Liu Reference Chang and Liu1998; Cowen et al. Reference Cowen, Mei Sou, Liu and Raubenheimer2003; Kimmoun & Branger Reference Kimmoun and Branger2007) or ultrasound velocimetry (Doering & Donelan Reference Doering and Donelan1997; Longo Reference Longo2010, Reference Longo2011; Longo et al. Reference Longo, Liang, Chiapponi and Aguilera Jimenez2012; Cheng & Wang Reference Cheng and Wang2015) and digital correlation image velocimetry (DCIV) (Govender et al. Reference Govender, Michallet, Alport, Pillay, Mocke and Mory2009). The definition of turbulence in unsteady flows remains debatable, and the periodicity of breakers (even though they lack a rigorous constant time period) favours the introduction of new types of averages to analyse the flow field structure, but does not provide a tool for the clear definition of turbulence. There are several techniques to extract turbulence from a time-periodic signal (e.g. fast Fourier transform, its variants, and wavelet analysis; see Longo, Petti & Losada (Reference Longo, Petti and Losada2002) and Longo (Reference Longo2003) for a discussion on this topic), but none seems conclusive, and the overall results are not unique and are still tied to the adopted technique. In particular, small shifts of the period of average result in transfer of the signal from the average flow field towards turbulence, with consequent overestimation of the turbulence level. In this respect, considering the role of coherent structures can help in the interpretation of data and in explaining some mechanisms of the transport of energy and momentum, giving a tool to better control the correctness of the estimated turbulence energy level.
The role and the presence of coherent structures filling the flow field at all time and space scales is widely recognized. Coherent structures generate multiple scales of shear stresses (according to the geometric scale of the structure itself) and actively contribute to the balance by transferring, generating and dissipating energy and momentum. In principle, coherent structure detection requires volumetric measurements of the three velocity components. However, the early detection of ordered and quasi-periodic structures was based on single-point measurements (Wallace Reference Wallace2012), with the use of conditional averages, even though in most cases the detection criteria are applicable only to a specific flow field, and lack generality (see Longo, Dominguez & Valiani (Reference Longo, Dominguez and Valiani2015), and the references therein). Direct numerical simulation and volumetric PIV have improved the detection criteria (see e.g. Green, Rowley & Haller Reference Green, Rowley and Haller2007), with results more tied to the experimental evidence. For example, a very recent analysis of turbulent coherent structures induced by regular plunging waves on a straight inclined rigid bottom was carried out with volumetric PIV measurements by Ting & Reimnitz (Reference Ting and Reimnitz2015) (their commercial PIV is identical to the PIV used in the present experiments), who also provided an in-depth description of vorticity, turbulence and shear stresses along the bottom. The availability of three-dimensional (3D) measurements of instantaneous fluid velocity seems necessary to apply the generalized detection criteria of coherent structures, which are based on topology considerations.
Numerical approaches to breaking description have been also widely adopted, using a fully 3D large-eddy simulation (Christensen & Deigaard Reference Christensen and Deigaard2001; Watanabe & Mungal Reference Watanabe and Mungal2005), or other different approaches (Lakehal & Liovic Reference Lakehal and Liovic2011; Derakhti & Kirby Reference Derakhti and Kirby2014; Lubin & Glockner Reference Lubin and Glockner2015). In some cases, the numerical model outputs of breaking solitary waves (Skyner Reference Skyner1996; Jensen, Mayer & Pedersen Reference Jensen, Mayer and Pedersen2005) and plunging breakers (Emarat et al. Reference Emarat, Forehand, Christensen and Greated2012) were compared to measurements by matching all the details of the experiments within the layout of the numerical models. However, the complexity of the real flow field, with air bubbles and sediment always present, still requires experimental confirmation of the theoretical models or experimental hints to develop new comprehensive models. Also, the simplest case, involving the absence of sediments and a fixed geometry of the boundaries, requires the measurement of the third component velocity.
Advances in technology have produced a commercial 3D (also called ‘volumetric’) PIV system able to measure the velocity in several thousand locations within a large volume. The availability of a huge number of data points with decent spatial and temporal resolutions allows the analysis of the turbulence, vorticity and coherent structures by adopting some theoretical approaches never used before, due to the lack of the third dimensional component of fluid velocity. We take advantage of the practical interest in breaking induced by submerged bars and the regularity of the section with breaking (which greatly facilitates data collection and analysis) to reproduce in a laboratory flume an artificial inclined bottom with a submerged bar to measure the free-surface level in several sections and the fluid velocity in the breaking section using a 3D particle image velocimetry system, under regular wave attacks.
The aims of the present work are the analysis of the flow field in the breaker, and the quantification of the terms in the equations usually adopted for modelling the flow and the turbulence. The data presented here refer to a diffuse natural cross-shore geometry, where a sand bar naturally develops on an inclined submerged beach profile as a consequence of sediment transport induced by currents and breaking waves. The experimental set-up is based on a very common problem to be faced in the design of coastal engineering: the interaction of incoming waves with submerged coastal structures or with bar berm beach profiles (see Losada, Silva & Losada Reference Losada, Silva and Losada1996; Brutsché et al. Reference Brutsché, Wang, Beck, Rosati and Legault2014, and references therein). This aspect qualifies the present activity as new with respect to the experiments of Ting & Reimnitz (Reference Ting and Reimnitz2015). Our aim is (i) to integrate some conceptual models of the complex phenomenon, (ii) to provide exhaustive experimental data to support more detailed numerical models, and (iii) to help planning further experiments better focused on clarifying some specific aspects of this relevant environmental flow field.
The experimental layout and the experiments are described in § 2, and the data analysis is detailed in § 3. The momentum balance is reported in § 4. The balance of turbulence is described in § 5. The conclusions are reported in § 6.
2 Experimental set-up and experiments
The experiments were conducted in the wave flume located in the Laboratorio de Dinámica de Fluidos Ambientales of the CEAMA (Centro Andaluz de Medio Ambiente) in Granada. The flume is 23 m long, 100 cm high, and 65 cm wide. A sketch of the flume is shown in figure 1(a). At one end of the flume, a piston-type wave maker is equipped with an active wave absorption control system (AWACS) for the absorption of the reflected waves. An artificial slope of 1 : 10 was built starting at
 $X=900~\text{cm}$
(the origin of the external coordinate system
 $X$
is the midposition of the wave paddle), with a berm of stones and plastic blocks usually used in physical models of berm breakwaters at
 $X=1050~\text{cm}$
, with a crest approximately
 $70~\text{cm}$
wide and approximately
 $15~\text{cm}$
beneath the still-water level, see figure 1(d). A glass window was positioned at the bottom in the measurement section to allow laser penetration. The camera system (V3V from TSI Inc.) was positioned with a side view of the flume and with a central axis inclination of
 $5^{\circ }$
in the vertical plane in order to enlarge the portion of the field of view (FOV) in water (figure 1
b,c). The lighting system (a 200 mJ dual Nd:YAG) was positioned below the camera system and a mirror reflected the beam to illuminate the FOVs from below, through the glass window. The volume of measurements was a cube with a side length equal to approximately
 $14~\text{cm}$
in the cross-shore and vertical directions and to approximately
 $10~\text{cm}$
in the alongshore direction, and it was centred at
 $X=1138~\text{cm}$
in the middle of the channel. In this paper, all the experimental data are presented in the local coordinate system
 $x{-}y{-}z$
, in which the
 $x$
direction is perpendicular to the shore, the positive
 $x$
direction is onshore, the positive
 $z$
direction is alongshore (across the flume) on the opposite side of the cameras, and the positive
 $y$
direction is perpendicular to the bottom upward. The three cameras (
 $2048\times 2048$
pixels) generated three pairs of 12-bit images. The two images of each pair were captured in rapid sequence and were triggered by an external synchronizer and with an imposed time delay of
 $100~\unicode[STIX]{x03BC}\text{s}$
. The seeding of the flow field was obtained by adding Degussa Vestosint® particles, and several preliminary attempts were necessary to achieve the correct concentration. The surface elevation during tests was measured in several sections (see figure 1
a), including the section of the breaker, using Ultrasonic probes (UltraLab® USL 80D from General Acoustics, sensor model USS635, accuracy on the instantaneous water level measurements equal to
 $\pm 0.5~\text{mm}$
) with data acquired at 200 Hz and stored for post-processing through a data acquisition (DAQ) board system and a personal computer (PC). Measurements for section #2 were unavailable due to data corruption. The acquisition of the V3V images was controlled by the signal of probe in section #4, where the internal toe of the bar was positioned. The measured level in this section was elaborated in real time, applying a moving average in a time window of 0.1 s to detect the maximum value of the water elevation. At the time of occurrence of the maximum water level, an output transistortransistor logic (TTL) signal was sent to the synchronizer of the V3V system and the sequence of shots started. The procedure of a trigger given by the surface elevation in a nearby section performs better than, for example, a trigger given by the signal of the wave paddle because it overcomes the intrinsic variability in the wave transformation process during travel and allows a tight control of the phase of the shots with respect to the breaker. The measured maximum fluctuation between the first shot and the instant of breaking was less than 0.02 s for the 10 sequences of shots in each experiment. For all the experiments, the AWACS was active, with a still-water depth in front of the paddle of 43 cm.
The experimental flume: (a) side view of the flume; (b) layout of the bar and of the volume of measurement; (c) cross-view of the flume; (d) the geometry of the bar, characterized by
 $d_{b}/d=0.54$
, where
 $d=28~\text{cm}$
is the still-water depth in the midsection of the bar (
 $X=1050~\text{cm}$
). The dotted line indicates the still-water level, the dashed line is the mean water level
 $\overline{\unicode[STIX]{x1D702}}$
(wave set-up or set-down). Dimensions are in centimetres.

The first step before executing the tests was the spatial calibration of the three cameras, which allowed the evaluation of the correspondence between the spatial coordinates of the points in the volume of measurements and the pixel coordinates. The procedure was automatic, with a screen containing regularly spaced tiny holes on a square grid with a step of 5 cm. A light-emitting diode (LED) light on the back of the screen resulted in a grid of bright points. The screen materialized the
 $x{-}y$
plane of the internal coordinate system and traversed along the
 $z$
-axis in 0.5 cm increments using a stepper motor. At each position along
 $z$
, three images were acquired and stored for further post-processing.
During the experiments, the acquired images could not be processed in real time (the algorithm of elaboration required up to 15 min of processor time for each shot) and were streamed to a PC. Particle identification started with tracking the same particle in two subsequent frames for each camera, with an algorithm based on intensity threshold and local ratio value (ratio of the intensity with respect the local background). Then, the algorithm detected the same pair of particles (i.e. the same particle in the two subsequent frames) for the three cameras, based on the spatial calibration data and on a procedure that individuates the particle movement with maximum match probability (Ohm & Li Reference Ohm and Li2000). The output was a set of triplets that can be transformed into a three-component velocity assigned to the initial position of the particle, resulting in a set of randomly spaced vectors. These vectors are then interpolated to a regular grid with a Gaussian-weighted interpolation procedure. The spatial step of the regular grid should be matched to the number of valid vectors. In the present tests, a good quality set of images contained approximately 100 000 particles with more than 25 000 particle velocities (the reduction is due to invalid particles or failed triplet identification). That gives almost 1 particle velocity for each point of a 0.4-cm-step regular grid and less than 0.1 particle velocity if the step is 0.2 cm. We chose a grid with a 0.4-cm step. Further details on the V3V system and algorithms can be found in Sharp et al. (Reference Sharp, Hill, Troolin, Walters and Lai2010). The V3V system is identical to the one used in Ting & Reimnitz (Reference Ting and Reimnitz2015), who compared the velocity measured by a V3V system with the measurements of an acoustic Doppler velocimeter (ADV) and found a good overlap in the data. They also measured the still-water velocity with the V3V. On the basis of the average of 30 trials, they obtained values less than
 $0.1~\text{cm}~\text{s}^{-1}$
for the
 $x$
and
 $y$
directions (the cross-shore and the vertical directions in the internal reference system of the present experiments) and equal to
 $0.4~\text{cm}~\text{s}^{-1}$
for the
 $z$
direction (the alongshore direction in our internal reference system). They also estimated that the uncertainty in turbulence velocities was of the order of approximately
 $50~\text{cm}~\text{s}^{-1}$
and turbulent kinetic energy (TKE) of the order of approximately
 $10^{3}~\text{cm}^{2}~\text{s}^{-2}$
are approximately
 $10\,\%$
and approximately
 $20\,\%$
, respectively. Because the flow fields of the present experiments are similar to the flow fields in the experiments by Ting & Reimnitz (Reference Ting and Reimnitz2015), with a velocity range of the same order of magnitude, we can assume the same values of uncertainty as stated in Ting & Reimnitz (Reference Ting and Reimnitz2015).
Nine different experiments were performed with regular first-order Stokes waves with the periods
 $T=1.5$
, 2.0 s and target wave heights (almost coincident with the generated wave height)
 $H_{0}=6$
, 7, 8, 9 and 10 cm. The main parameters of the experiments are listed in table 1. According to the values of the Iribarren number, the breakers should be the plunging type (
 $0.5<\unicode[STIX]{x1D709}_{0}<3.3$
); however, the presence of the bar induced breaking, resulting in the spilling type. The Iribarren number is defined by the deep-water steepness, but the wave–bar interaction includes a rapid variation of all the parameters and a rapid evolution of the Iribarren number. This is a relevant difference from the experiments by Ting & Reimnitz (Reference Ting and Reimnitz2015), and makes these experiments relevant: here, breakers are controlled by the bar, and strongly influence the morphodynamics of the beach, which depends on the wave–bar (or wave–berm) interaction. The experiments were designed in order to avoid or to strongly limit the presence of air bubbles in the water column, since air bubbles represent a data loss for the volumetric PIV, due to reflection and scattering, and introduce a second phase in the fluid domain, which can significantly affect the momentum and turbulence balances (Derakhti & Kirby Reference Derakhti and Kirby2014).
Parameters of the tests.
 $H_{0}$
is the target wave height (almost coincident with the generated wave height),
 $T$
is the period and
 $H_{0}/L_{0}$
is the deep-water wave steepness.
 $\unicode[STIX]{x1D709}_{0}=\tan \unicode[STIX]{x1D6FC}/\sqrt{H_{0}/L_{0}}$
is the Iribarren number (
 $\unicode[STIX]{x1D6FC}$
is the bed slope),
 $h=d+\overline{\unicode[STIX]{x1D702}}$
is the mean water depth in the section of measurements,
 $\overline{\unicode[STIX]{x1D702}}$
is the wave set-up, and
 $H_{b-rms}$
,
 $H_{b-1/3}$
, and
 $H_{b-max}$
are the root-mean-square wave height, the mean of the highest third of the waves, and the maximum wave height, respectively, all referred to as the statistics of the breakers.
 $d_{i}$
and
 $d_{e}$
are the still-water depth at the internal and external toe of the bar, respectively,
 $B$
and
 $B^{\prime }$
are the width of the crest and the total width of the bar. The still-water depth in front of the paddle is 43 cm and the breaking section is #5 at
 $X\approx 1138~\text{cm}$
, with a still-water depth
 $d=19.2~\text{cm}$
.

There are also several differences between breaking in deep water and breaking in shallow water. In particular, breaking in shallow water induces vortices packed in the layer between the descending free surface and the bottom, which persist and are still present when the next breaker arrives, interfering with the structure of the following breaker and requiring a long sequence of waves before reaching an adequate repeatability of the breaking process, even in flumes with well-controlled regular periodic waves (for this reason we started measurements after more than 100 generated wave cycles).
To reach a stationary state of the waves and currents in the flume, the image acquisition started approximately
 $250~\text{s}$
after starting the wave generation. For each wave test, 10 sequences were acquired, with each sequence containing 10 or 13 shots (for the 1.5 s and the 2.0 s period waves, respectively) acquired at the maximum allowed frequency, i.e. 7.25 Hz.
3 Data analysis and visualization
3.1 Definition of the averages
The following definitions of several types of averages refer to discrete value functions sampled with a constant time step. For a strictly periodic signal, we define the phase average for the variable
 $a$
as
 $$\begin{eqnarray}\widetilde{a}=\frac{\displaystyle \sum _{i=1}^{N}a(t+iT)}{N},\end{eqnarray}$$
where
 $T$
is the period of the signal and
 $N$
is the number of cycles. The time average is defined as
 $$\begin{eqnarray}\overline{a}=\frac{\displaystyle \sum ^{N_{s}}a}{N_{s}},\end{eqnarray}$$
where
 $N_{s}$
is the number of samples. Occasionally, the phasic average will be adopted, defined as
 $$\begin{eqnarray}\langle a\rangle =\frac{\displaystyle \sum ^{N_{s}}a\unicode[STIX]{x1D719}}{\displaystyle \sum ^{N_{s}}\unicode[STIX]{x1D719}},\end{eqnarray}$$
where
 $\unicode[STIX]{x1D719}=1$
and
 $\unicode[STIX]{x1D719}=0$
if water is present or absent, respectively. The water concentration is
 $\unicode[STIX]{x1D6FC}=\sum ^{N_{s}}\unicode[STIX]{x1D719}/N_{s}$
and
 $\unicode[STIX]{x1D6FC}=1$
below the (minimum) trough level, and
 $\unicode[STIX]{x1D6FC}=0$
above the (maximum) crest level. The phasic average is always greater than and equal to the time average if
 $\unicode[STIX]{x1D6FC}<1$
and
 $\unicode[STIX]{x1D6FC}=1$
, respectively.
The phasic–phase average is also defined as
 $$\begin{eqnarray}\langle \widetilde{a}\rangle =\frac{\displaystyle \mathop{\sum }_{i=1}^{N}a(t+iT)\unicode[STIX]{x1D719}}{\displaystyle \sum ^{N}\unicode[STIX]{x1D719}},\end{eqnarray}$$
applying the phase-average and the phasic-average operators simultaneously.
Specific attention should be paid to the time convergence of the data, related to the number of elements of the sample (the time series) to be averaged in limiting the variability of the average below a fixed threshold. In the theory of signals it is well known that the descriptive properties of a random variable (average, variance, and higher order moments) are not accessible, and can only be estimated by using a finite sample of observations. For the time series, the estimators have an uncertainty that, for some theoretical probability distribution functions, can be computed on the basis of the statistical bandwidth of the data (see e.g. Bendat & Piersol Reference Bendat and Piersol2000, for a detailed description). Experimental time series, such as velocity measurements under breaking waves, are often quite different from the theoretical time series, and many approximations used in statistical theories cannot be safely adopted. A possible methodology for treating data related to breaking waves can be found in Petti & Longo (Reference Petti and Longo2001a
), where the steadiness of some statistical parameters was assessed by using the autocorrelation function of the variable of interest estimated for each period. In a different context the methodology by, for example, Florens, Eiff & Moulin (Reference Florens, Eiff and Moulin2013) can be a useful guide for the description of the convergence errors. In the present experiments, most analyses have been conducted by averaging in the cross-shore and alongshore directions, obtaining a single vertical profile per shot as the average of approximately 800 profiles. With 10 or 13 wave cycles, each phase-averaged vertical profile is the average of approximately 8000 or more than 10 000 profiles, which is far greater than in most other experiments on breaking waves. We bear in mind that time averaging and space averaging generally yield different results (unless specific properties of the flow field are satisfied) and that the nearby profiles are not independent (unless they are sufficiently spaced apart). A solution would be to increase the number of wave cycles by extending the length of the time series. However, a prolonged time series also has some relevant disadvantages, of which the first is the difficulty in guaranteeing perfect stationarity of all the processes in the wave flume for a long interval time. Figure 2 shows the effects of the number of samples in the vertical profile of the cross-shore mean velocity and of the cross-shore component of turbulent kinetic energy. Increasing the number of vertical profiles adopted for the estimation of the average velocity gives values which for approximately 300 profiles are almost coincident with the values for approximately 10 500 profiles, with a maximum relative error of approximately
 $2\,\%$
and an average relative error of approximately
 $0.6\,\%$
. To a less extent, it is also true for the turbulent kinetic energy, with a maximum relative error of approximately
 $14\,\%$
and an average relative error of approximately
 $6.5\,\%$
. The higher moments (not shown) are much more sensitive to the size of the sample, and show a slower rate of time convergence. Hereafter, we will present in the figures either ‘vertically integrated’ data, meaning data phasic-averaged in the vertical, or ‘cycle integrated’ data, equivalent to a time average or a phasic average according to the indications. Since the volume of measurement does not cover all the fluid domain, we expect that some variations of the results could pertain to the data in the missing volume. In the following figures and diagrams, the time (or phase) horizontal axis is in descending values for an easier interpretation of the data.
Experiment 9b, phase 2. Comparison of the averaged values for (a) the cross-shore velocity and (b) the turbulent kinetic energy cross-shore component for 13 samples, one for each shot in the vertical through the point
 $x=0$
,
 $z=0$
(dotted line), approximately 300 samples, all the vertical profiles in the midplane
 $z=0$
for each shot (dashed line), and approximately 10 500 samples, all the vertical profiles for each shot (solid line). Values are non-dimensional.

Figure 3 shows the shape of the wave at the breaking section for all the experiments, and figure 4 shows the surface elevation at section #1 (
 $X=500~\text{cm}$
), section #3 (
 $X=1000~\text{cm}$
), the section of the bar (section #4,
 $X=1050~\text{cm}$
), the breaking section (section #5,
 $X=1138~\text{cm}$
), and the trigger signal. Data in section #2,
 $X=900~\text{cm}$
, are missing due to signal corruption. Although a certain variability in the waves can be observed, the trigger signal, corresponding to the first shot of the sequence, is always located almost at the peak of the breaker.
Phase-averaged surface elevation at the section of velocity measurements (section #5) for all the tests. The dashed lines limit the
 $\pm 1$
standard deviation band for the sample of 10 wave cycles during velocity acquisition.

Experiment 9b. Surface elevations at section #1 (dashed-dotted cyan curve), section #3 (dotted green curve), section #4 (dashed blue curve), and section #5 (solid red curve) (measurements for section #2 are not available due to data corruption during signal acquisition). The vertical dashed lines are the maximum level detected in section #4 and the vertical solid lines are the trigger signal sent to the synchronizer of the V3V system in order to start the sequence of images acquisition (13 shots for the waves with
 $T=2.0~\text{s}$
, and 10 shots for the waves with
 $T=1.5~\text{s}$
).
 $\unicode[STIX]{x0394}t$
is a constant imposed delay equal to 0.1–0.2 s, according to the wave height and period.

The non-integer product between the sampling frequency (7.25 Hz) and the wave period (
 $T=1.5$
, 2.0 s) introduces a bias in time averages. However, we notice that: (i) the time lag (the difference between the wave period and the period corresponding to an integer number of shots, 11 and 14 time intervals of
 $1/7.25~\text{s}$
each for the two wave periods) is equal to 0.017 s and to 0.068 s, respectively, i.e. 1.1 % and 3.4 % of the wave period; (ii) this time lag is of the same order of accuracy in triggering the crest level; (iii) this time lag is even less than the intrinsic variability of the period of the single waves. We can safely discard this effect.
3.2 Proper orthogonal decomposition
Experimental data in planar PIV and in V3V require the elimination of background noise, the detection of outliers, and the filling of gaps due to missing data. Among the various techniques (see Kitzhofer, Nonn & Brcker Reference Kitzhofer, Nonn and Brcker2011, and references therein), we chose the ‘snapshot’ proper orthogonal decomposition (POD) as introduced by Sirovich (Reference Sirovich1987). The signal is analysed to detect the best base described by several modes, and each snapshot can be reconstructed as a linear combination of the elements of the base (the modes). The number of modes in the POD technique is equal to the number of snapshots available. The modes can be ranked according to their energy contribution, and the reconstruction includes a limited number of modes, in most cases those containing at least 90 % of the total energy, without residual modes containing more than 1 % of the total energy. The overall result is the ability to describe an extended sample of data using a limited number of parameters without losing information, while eliminating the noise and unrealistic fluctuations. The more organized the source signal, the fewer modes necessary to properly reconstruct it. POD is a tool for describing the energy distribution amongst the organized modes of the flow, but it also acts as a filter, and can be efficiently used to interpolate spurious data (Kitzhofer et al. Reference Kitzhofer, Nonn and Brcker2011) or to reconstruct snapshots between two experimental snapshots (Druault, Guibert & Alizon Reference Druault, Guibert and Alizon2005).
Energy levels for the different modes obtained by POD. Experiments with waves of period (a)
 $T=1.5~\text{s}$
and (b)
 $T=2.0~\text{s}$
.

Experiment 9b, phase 2. Comparison of the averaged values for (a) the cross-shore velocity and (b) the turbulent kinetic energy cross-shore component for approximately 10 500 samples. The solid line refers to the raw data (no POD decomposition), the dashed-dotted line refers to the signal reconstructed including 95 % of the energy (100 modes), the dashed line refers to 75 % of the energy (35 modes), and the dotted line refers to data containing 50 % of the energy (3 modes). Values are non-dimensional.

A first insight into the flow field structure is given by the energy level of the principal modes, shown in figure 5(a,b) for all experiments. There are 100 and 130 modes for experiments 1b–5b and for experiments 6b–9b, respectively. The number of modes to be included depends on the threshold of energy of the reconstructed signal. For instance, for experiment 4b, 14 modes are sufficient to include 90 % of the energy, whereas experiment 2b requires 80 modes for the same level of energy. Whether the spectrum of energy given by POD can be used to separate the mean flow, the deterministic oscillations and the turbulence, remain an open problem. Presently, it can only be inferred that the shape of the spectrum of energy of modes provides hints to the level of organization in the flow: a limited number of modes containing a high percentage of the total energy indicates that small-scale turbulence plays a minor role in the overall energy balance, whereas the organized fluctuations (and macroturbulence) dominate the flow field. The opposite is true if the spectrum shows a uniform gradient of energy with respect to the mode number. In the present experiments, the fluid velocity field was reconstructed, and included the modes containing 95 % of the total energy. In no case did the residual modes contain more than 1 % of the total energy. The choice of the energy threshold affects the statistics, as is shown in figure 6, where the phase-average cross-shore velocity and the phase-average cross-shore turbulent kinetic component are shown by considering the raw signal (no POD), and the POD reconstructed signal including 95 %, 75 %, and 50 % of the total energy, respectively. While a reduction of 5 % of the energy has a negligible effect on the statistics, a reduction of 25 % has a marked effect, but not for the mean velocity. Figure 7 shows the instantaneous velocity vectors, the phase-averaged velocity and the fluctuating component (the difference between the instantaneous and the phase-averaged velocity) for a snapshot of experiment 6b. For clarity, only the data in the
 $x{-}y$
vertical plane in the midsection of the flume (
 $z=0$
) are presented. An extended data set is shown in the Appendix, where figure 22 shows the snapshot for the same data shown in figure 7, with different panels referring to different values of
 $z$
that are 0.8 cm apart. Based on the data presented in the extended data set in the Appendix, a significant organization in the flow is detected, which is more evident for negative values of
 $z$
. A shear layer between two opposite currents develops at
 $y\approx -5~\text{cm}$
and
 $x<0$
, with a strong vertical jet impinging from the top of the flow domain. The pattern is similar for positive values of
 $z$
, but it appears more random, as if the turbulence was more developed in that part of the flow domain. Figures 23 and 24 (Appendix) contain the phase-averaged and fluctuating velocities for different slices in the alongshore direction. Figure 8 shows a visualization of the velocity vectors with slices in three vertical layers and the zero velocity surface, separating the positive and negative fluid velocity in the
 $x$
direction. The 3D structure of the breaking wave is evident, with an adequate symmetry across the midsection of the channel and with the effects of the vertical wall boundary layers.
Experiment 6b, the fourth shot in a sequence of 13 shots of the first measured wave cycle. (a) Instantaneous velocity in the midplane of the flume (
 $z=0$
); (b) phase-averaged velocity; (c) velocity vectors difference (fluctuating velocity) between the instantaneous velocity and the phase-averaged velocity. Only velocity components in the
 $x{-}y$
plane are shown. The inset depicts the surface elevation time series, with the symbols indicating the time of the shot.

Visualization of the Eulerian phase-averaged velocity field for experiment 6b for the first measured wave cycle (data partially presented in figure 7). The red isosurface corresponds to a zero velocity in the
 $x$
direction (cross-shore), identifying a recirculation region. The inset depicts the surface elevation time series, with the symbols indicating the time of the shot, the fourth shot in a sequence of 13 shots.

4 Momentum balance
Adopting the Reynolds decomposition, the main variables in a turbulent flow, velocity components and pressure, are separated into an (phase-)average value and the fluctuation:
 $$\begin{eqnarray}u_{i}=\widetilde{u_{i}}+u_{i}^{\prime },\quad p=\widetilde{p}+p^{\prime },\end{eqnarray}$$
where
 $i=1,2,3$
, with
 $u_{1}=u,u_{2}=v$
, and
 $u_{3}=w$
indicating the three components of velocity in the orthogonal Cartesian system
 $x{-}y{-}z$
. The phase-averaged velocity
 $\widetilde{u_{i}}$
is the organized part of the flow, and in the present analysis includes the time-averaged velocity (the undertow below the trough level). Hereafter, a repeated index indicates summation unless otherwise stated. The equations of motion for the average flow in an incompressible fluid are
 $$\begin{eqnarray}\underbrace{\vphantom{\displaystyle \frac{\unicode[STIX]{x2202}\widetilde{u_{j}^{\prime }}}{\unicode[STIX]{x2202}x_{j}}}{\displaystyle \frac{\unicode[STIX]{x2202}\widetilde{u_{i}}}{\unicode[STIX]{x2202}t}}}_{I_{m}}+\underbrace{\widetilde{u_{j}}{\displaystyle \frac{\unicode[STIX]{x2202}\widetilde{u_{i}}}{\unicode[STIX]{x2202}x_{j}}}}_{II_{m}}=\underbrace{-{\displaystyle \frac{1}{\unicode[STIX]{x1D70C}}}{\displaystyle \frac{\unicode[STIX]{x2202}\widetilde{p}}{\unicode[STIX]{x2202}x_{i}}}}_{III_{m}}+\underbrace{\vphantom{{\displaystyle \frac{\unicode[STIX]{x2202}\widetilde{u_{j}^{\prime }}}{\unicode[STIX]{x2202}x_{j}}}}g_{i}}_{IV_{m}}+\underbrace{{\displaystyle \frac{1}{\unicode[STIX]{x1D70C}}}{\displaystyle \frac{\widetilde{\unicode[STIX]{x1D70F}_{ij}}}{\unicode[STIX]{x2202}x_{j}}}}_{V_{m}}\underbrace{-{\displaystyle \frac{\unicode[STIX]{x2202}\widetilde{u_{i}^{\prime }u_{j}^{\prime }}}{\unicode[STIX]{x2202}x_{j}}}}_{VI_{m}},\quad i=1,2,3,\end{eqnarray}$$
where
 $\unicode[STIX]{x1D70C}$
is the mass density of the fluid,
 $g_{i}$
is the
 $i$
th component of the acceleration of gravity,
 $\unicode[STIX]{x1D70F}_{ij}$
is the stress tensor due to the viscosity, equal to
 $\unicode[STIX]{x1D70F}_{ij}=2\unicode[STIX]{x1D707}\unicode[STIX]{x1D61A}_{ij}$
with
 $\unicode[STIX]{x1D707}$
representing the molecular viscosity and
 $\unicode[STIX]{x1D61A}_{ij}=1/2(u_{i,j}+u_{j,i})$
representing the rate of strain tensor. The term
 $u_{i}^{\prime }u_{j}^{\prime }$
represents the Reynolds stress tensor. The terms in (4.2) are conventionally defined as local inertia (
 $I_{m}$
), advection (
 $II_{m}$
), gradient pressure (
 $III_{m}$
), gravity contribution (
 $IV_{m}$
), viscous stress contribution (
 $V_{m}$
), and turbulent stress contribution (
 $VI_{m}$
). The gravity term is negated by considering the pressure field which excludes the hydrostatic effect; hence, the sum of the gradient pressure and the gravity contribution (
 $III_{m}+IV_{m}$
) is the net gradient pressure.
We take advantage of the availability of measurements of three velocity components, in several points in space and at different times, to estimate all the terms in (4.2). For an easy visualization of the data, and because the dominant variations in the variables are mainly in the
 $y$
direction, in most cases the values are displayed averaged in the
 $x$
(cross-shore) and in the
 $z$
(alongshore) directions. Averaging in the
 $x$
direction is justified by the limited size of the FOV in that direction with respect to the length of the wave, with a ratio equal to approximately
 $14/200\approx 7\,\%$
, and averaging in
 $z$
direction is justified based on symmetry considerations.
The results are presented in non-dimensional form with a vertical length scale given by the mean water depth
 $d+\bar{\unicode[STIX]{x1D702}}$
, where
 $d$
is the still-water depth and
 $\bar{\unicode[STIX]{x1D702}}$
is the time-averaged surface elevation. The velocity scale is given by
 $\sqrt{g(d+\bar{\unicode[STIX]{x1D702}})}$
, and the time scale is given by the wave period
 $T$
. The horizontal length scale is
 $T\sqrt{g(d+\bar{\unicode[STIX]{x1D702}})}$
. Surface elevations are measured from the mean water level; hence,
 $\unicode[STIX]{x1D701}=(y-\bar{\unicode[STIX]{x1D702}})/(d+\bar{\unicode[STIX]{x1D702}})$
.
Because no significant differences arise amongst the experiments listed in table 1, most of the following analyses refer to a specific experiment (usually experiment 9b); in some cases, the analysis is extended to the entire collection of experiments.
Figure 9(a–c) shows the non-dimensional oscillating cross-shore, vertical and alongshore velocities for experiment 9b. Figure 9(d) shows the phase-averaged surface elevation and the instant of shooting of the V3V system. Crest and trough are located at
 $\unicode[STIX]{x1D701}=0.43$
and
 $\unicode[STIX]{x1D701}=-0.11$
, respectively, and the vertical extension of the FOV is between
 $\unicode[STIX]{x1D701}\approx 0.31$
and
 $\unicode[STIX]{x1D701}\approx -0.42$
. Phases 1 and 2 are across the crest, and only a small part of the crest is missing from the data analysis. However, the peak velocities are missing, because no phase is perfectly coincident with the crest of the breaker.
Experiment 9b. (a) Phase-averaged oscillating cross-shore velocity, (b) vertical velocity, and (c) alongshore velocity as a function of
 $\unicode[STIX]{x1D701}=(y-\bar{\unicode[STIX]{x1D702}})/(d+\bar{\unicode[STIX]{x1D702}})$
. (d) Phase-averaged surface elevation, with symbols indicating the 13 phases of measurements. The hatched area indicates the FOV of the V3V system.

The maximum non-dimensional cross-shore velocity equals 0.33, and the minimum reversal velocity equals
 $-0.15$
. These values agree well with the values found by Ting & Kirby (Reference Ting and Kirby1995, Reference Ting and Kirby1996) for spilling and plunging breakers, even though the comparison is not exact because the source of breaking is different, i.e. the instability triggered by a submerged bar in the present experiments and the natural instability due to water depth reduction in Ting and Kirby’s experiments. The velocity during reverse flow agrees well with the data reported in Kimmoun & Branger (Reference Kimmoun and Branger2007), but the maximum value in the present experiments is much smaller than the value of 1.33 reported in the data of Kimmoun and Branger. The discrepancy can be attributed again to the different nature of the breakers, bearing in mind that in the present experiments we do not measure the values in the crest of the breaker. Because the flow experiences rapid changes near the breaking point, we expect that the present data are missing the maximum horizontal velocity. Similar considerations also arise for the vertical velocity. The alongshore velocity
 $\widetilde{w}$
shown in figure 9(c) is two orders of magnitude smaller than the two main components
 $\widetilde{u}$
and
 $\widetilde{v}$
. Notably, the data show that a periodicity is still present, with inversion of the sign in different phases. Hence, the symmetry in the alongshore direction is not instantaneously respected, but positive and negative alongshore fluxes develop, possibly as a consequence of a systematic asymmetry induced by the breaker and the presence of recirculating cells in the flume.
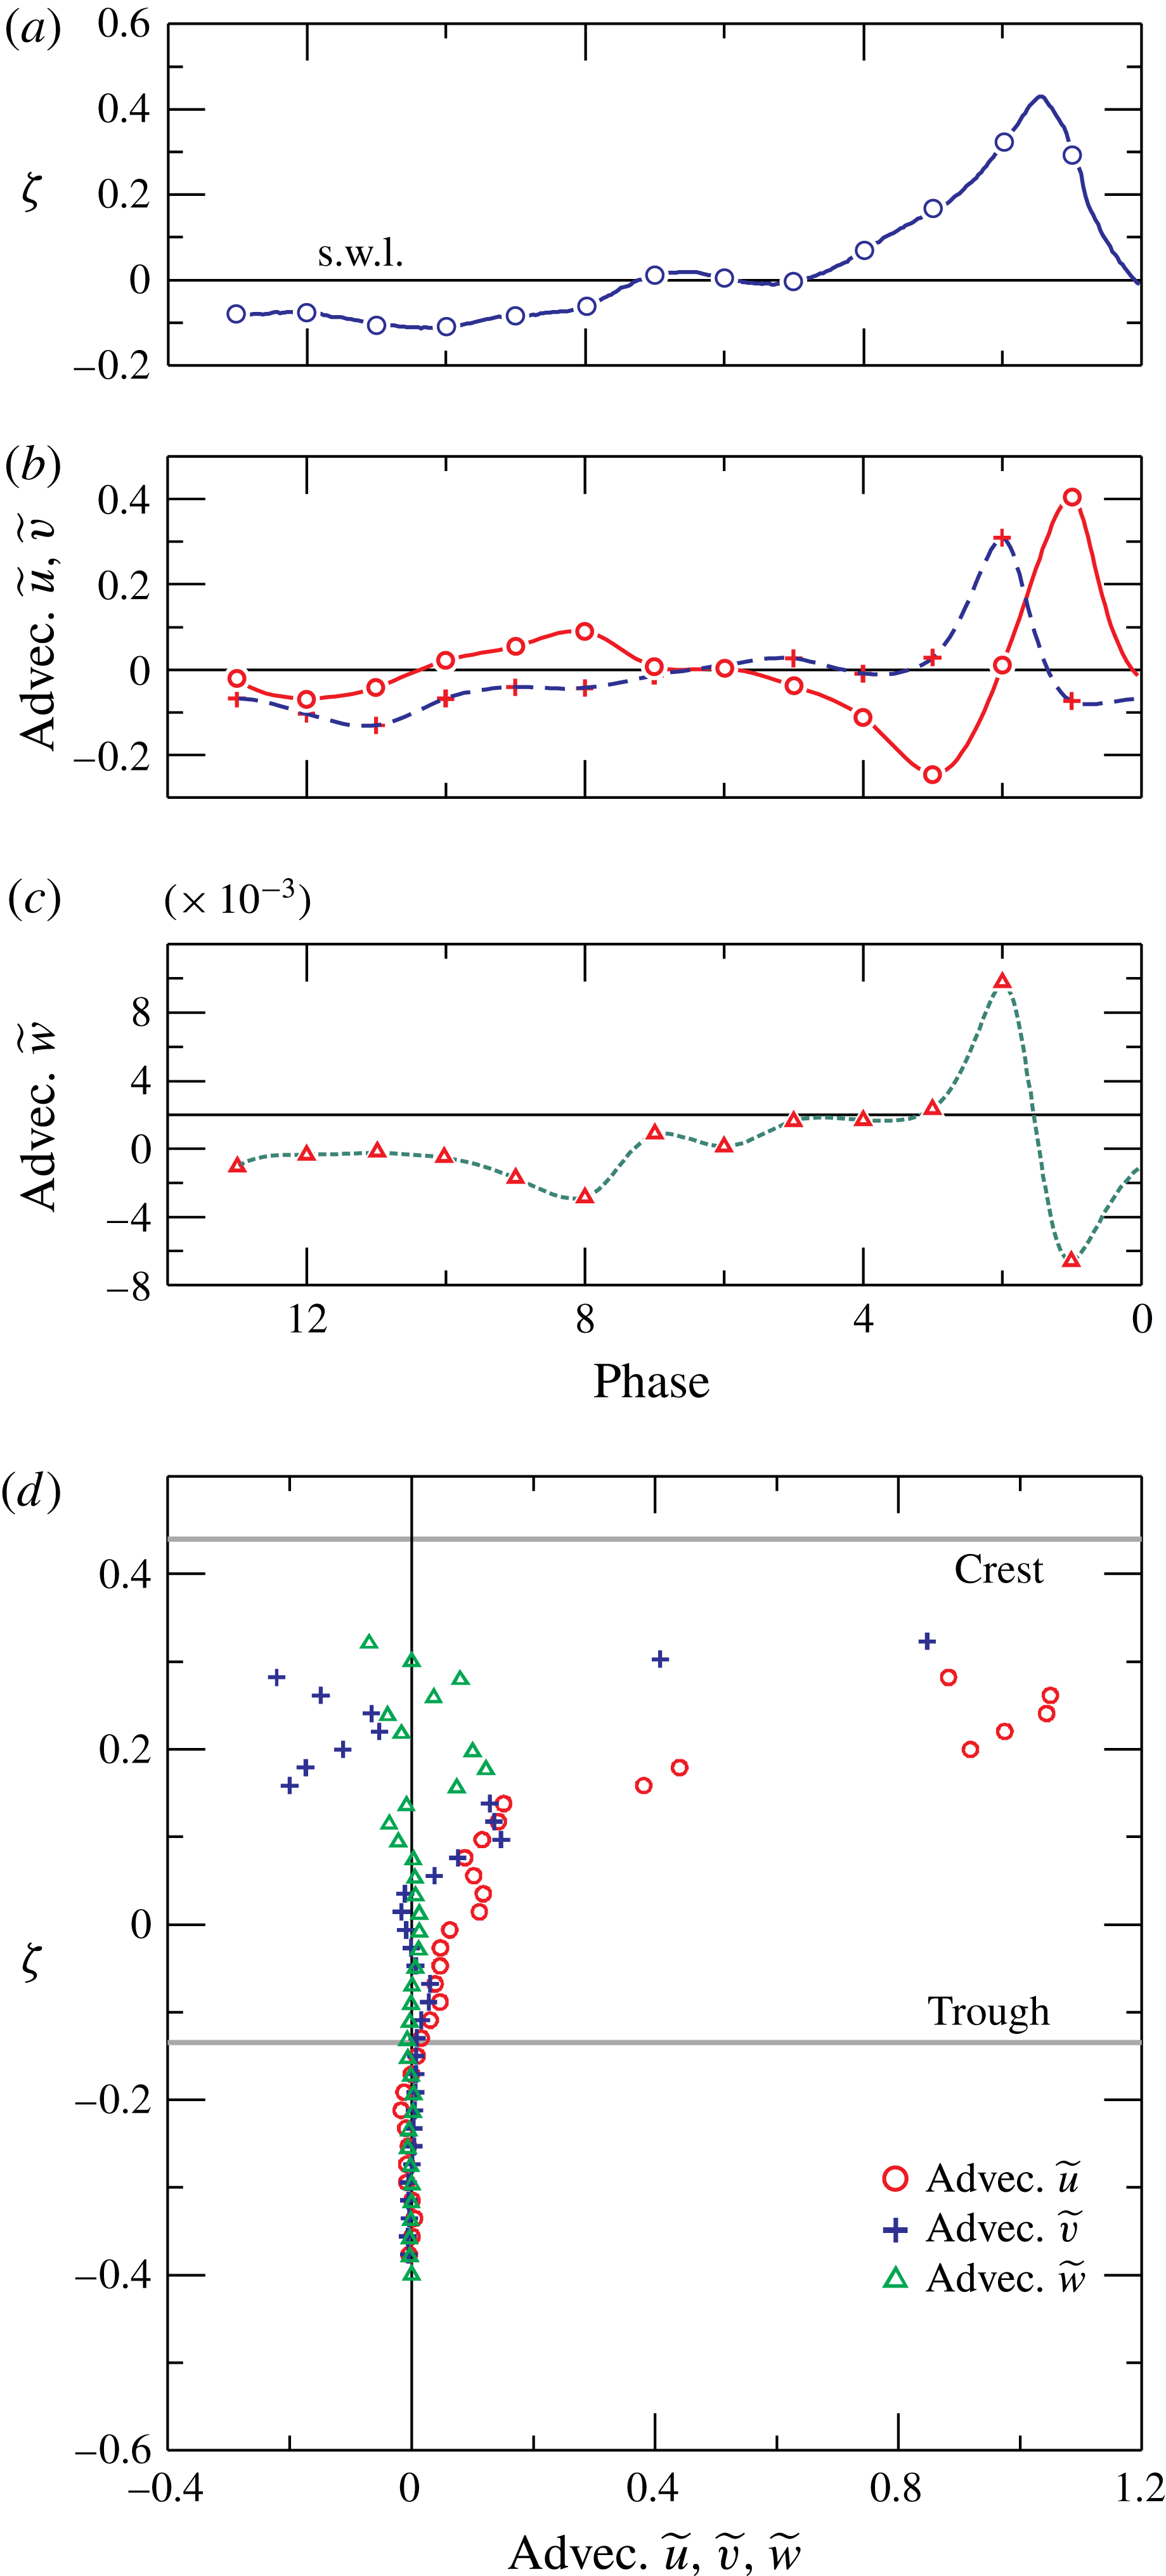
Figure 10 shows the same data as shown in figure 9, but integrated in the vertical direction. The net fluxes during a wave period in the three directions are slightly unbalanced, as a consequence of the missing data below or above the vertical limits of the FOV and the overall uncertainty of the measurements. However, the results are quantitatively coherent with other similar experiments. Figure 10(d) also depicts the time-averaged cross-shore velocity (the undertow). This profile is shown for all the experiments in figure 25 in the Appendix. Figure 11 shows the advection terms due to the mean flow. The cross-shore and the vertical advection are of the same order of magnitude, and the alongshore advection is of a lower order. During breaking, the cross-shore advection is mainly positive, whilst the vertical advection is negative (see figure 11
b) and shows a phase lag of approximately
 $\unicode[STIX]{x03C0}/2$
(it is not exactly equal to
 $\unicode[STIX]{x03C0}/2$
, see the following analysis). In the post-breaking phases, a flow reversal is observed in the sign changes for both components. The correlation between the oscillating velocity components, also called the wave Reynolds stress or
 $\overline{\widetilde{u}\widetilde{v}}$
(shear stress in the
 $x{-}y$
plane; the other terms are of minor relevance and are not shown) is depicted in figure 12 for all the experiments. The presence of a correlation between the oscillating components is not predicted by the linear theory, and is responsible for current driving (see, e.g. Deigaard & Fredsøe Reference Deigaard and Fredsøe1989). Figure 12(a,c) show the values averaged in the vertical for each phase. The values are generally positive, and the largest values occur during breaking, and are negative immediately after breaking. (b,d) Show the vertical distribution of the cycle-averaged values. The (phasic cycle average) correlation is positive beneath the trough and is increasing in the vertical for experiments 1b–5b (
 $T=1.5~\text{s}$
) and decreasing in the vertical for experiments 6b–9b (
 $T=2.0~\text{s}$
). The linear variation in
 $\overline{\widetilde{u}\widetilde{v}}$
agrees with several models developed for dissipative or non-dissipative waves, on horizontal or inclined bottoms, and with or without vorticity (see Deigaard & Fredsøe Reference Deigaard and Fredsøe1989; Rivero & Arcilla Reference Rivero and Arcilla1995). However, there are inconsistent results for the trend and sign of the wave Reynolds stress. A very recent analysis (Olfateh et al.
Reference Olfateh, Ware, Callaghan, Nielsen and Baldock2016) of the inconsistent results obtained in labs for the wave Reynolds stress (mainly in wind-generated waves, with transfer of momentum and energy from the wind to the waves) demonstrates that the inconsistencies are due to the reflection of the waves. Hence, there is a lab distortion in the experimental results that should always be considered in the data analysis, but the effect should also be present in nature, where multiple sources of wave reflections can be observed (Baquerizo et al.
Reference Baquerizo, Losada, Smith and Kobayashi1997).
Experiment 9b. (a) Phase-averaged surface elevation; (b) vertical integrated phase-averaged horizontal (continuous line) and vertical (dashed line) velocity; (c) vertical integrated phase-averaged alongshore velocity; (d) cycle integrated velocity components (symbols) and time-average horizontal velocity (solid red line).

Experiment 9b. (a) Phase-averaged surface elevation; (b) vertical integrated advection for the phase-averaged horizontal (solid line) and vertical (dashed line) velocity; (c) vertical integrated advection for the phase-averaged alongshore velocity; (d) cycle integrated advection of the three velocity components.
Correlation
 $\widetilde{u}\widetilde{v}$
for all experiments: (a) vertical average values at different phases for experiments 1b–5b; (b) wave cycle phasic-average values, distribution in the vertical; (c,d) similar data as presented in (a,b) but for experiments 6b–9b.

Figure 13 shows four directly estimated terms of the six terms in the linear momentum balance equation in the cross-shore direction. Local inertia (a) is generally dominant, with advection (b) of a smaller order of magnitude, except immediately after breaking (phase 2). Additionally, the turbulent (Reynolds) stress contribution (c) becomes relevant essentially during breaking (phase 1 and 2), whereas the viscous stress contribution (d) is three orders of magnitude smaller than all other contributions. Figure 13(e) shows the net gradient pressure term (excluding the hydrostatic component), computed by summing all the estimated terms. In the overall balance, we note that the turbulent stresses are quite significant immediately after breaking (in phase 2, they are approximately 10 % of the local inertia), act like inertia and require an extra gradient pressure.
Experiment 9b. Balance for the cross-shore momentum, phase-averaged values. (a) Local inertia (term
 $I_{m}$
in (4.2)); (b) advection (term
 $II_{m}$
); (c) contribution of turbulent (Reynolds) stresses (term
 $VI_{m}$
); (d) contribution of viscous stresses (term
 $V_{m}$
); (e) net gradient pressure term, equal to
 $III_{m}+IV_{m}$
, estimated by summing up all the other terms. The second horizontal axis indicates the values as a fraction of gravity.

Experiment 9b. (a) Phase-averaged surface elevation with the indication of the phase; (b) terms in linear momentum balance in the cross-shore direction, (c) in the vertical direction, and (d) in the alongshore direction. The dashed line refers to local inertia (term
 $I_{m}$
), the dotted line refers to advection (term
 $II_{m}$
), the dashed-dotted line refers to turbulent stress contribution (term
 $VI_{m}$
), and the solid line indicates the net gradient pressure (pressure excluding the hydrostatic component, which is absent in the alongshore direction) obtained by summing up all the other terms. The triangles represent the viscous term contribution (term
 $V_{m}$
) which is almost negligible in all the three directions.

The phase-resolved contributions integrated in the vertical are shown in figure 14 for the cross-shore (
 $x$
), the vertical (
 $y$
) and the alongshore (
 $z$
) directions. In the cross-shore direction (b), for most of the wave cycle the net gradient pressure balances only local inertia, because advection and the turbulent stress contribution are negligible. Only beneath the crest does the gradient pressure act against local inertia, advection and turbulent stresses, and it is equal to approximately three times the gravity component parallel to the bottom or a quarter of the value of gravity. For plunging breakers, the peak gradient pressure is much stronger, up to 5 g (see, e.g. Peregrine Reference Peregrine1983)). We recall here that the present data are missing the peak values. In the vertical direction (c), advection is comparable to local inertia immediately before breaking, with positive values, and the subsequent phases are almost completely dominated by local inertia. Turbulent stresses play a minor role with respect to the cross-shore dynamics, and viscous stresses are negligible. In the alongshore direction (d), all terms are much smaller than in the other two directions. In the presence of a rigorous symmetry, flat profiles were expected for all the terms, and the presence of a periodic variation in the inertial terms clearly indicates that alongshore dynamics are triggered by instabilities of various origins, including systematic asymmetries in the breaker, which is a 3D phenomenon. It is expected that in larger flumes these 3D effects are more evident. Notably, the inertial terms and turbulent stresses are comparable during the entire wave cycle.
Net gradient pressure term in the
 $x$
(cross-shore) and
 $y$
(vertical) directions, and breaking wave profile for experiments 9b–8b–7b–6b (panels a–d). The solid blue line is the wave profile (referred to the right vertical axis), filled circles (dashed red line, an interpolation of the experimental values with splines) are the estimated net pressure gradient term in the cross-shore direction, empty squares (dotted green line) are the estimated net pressure gradient term in the vertical direction. The net pressure gradient terms are referred to the left vertical axis.

The gradient pressure term is considered a key element in the shape of the profile of the breaker. It achieves the highest values during steepening of the wave crest, and strongly contributes to the aspect of the breakers and to the post-breaking wave profile evolution. Figure 15(a–d) shows the net pressure gradient terms in the
 $x$
and
 $y$
directions for the
 $T=2.0~\text{s}$
wave tests. The net pressure gradient term in both directions oscillates, following the wave profile but with a phase shift (a steep front, see (a) and (b) is forced by the large positive value of the cross-shore pressure gradient, with a peak value delayed with respect to the wave crest; the delay is reduced for smaller wave breaking height, see (c) and (d), being zero several times and the cross-shore one being the largest in most cases, but not as large as would be expected. Steepening of the wavefront is strongly correlated with the cross-shore net pressure gradient term, while smoothing of the wave profile is correlated with the vertical component of the net pressure gradient. The results for the other waves (with period
 $T=1.5~\text{s}$
) are similar (not shown).
Experiment 9b, Reynolds stress tensor. Phase-averaged normal stress in the (a)
 $x$
direction, (b)
 $y$
direction, and (c)
 $z$
direction. Shear stresses in the (d)
 $x{-}y$
plane, (e)
 $x{-}z$
plane, and (f)
 $y{-}z$
plane.

Figure 16 shows the six phase-averaged components (phasic values) of the Reynolds stress tensor for experiment 9b. The main diagonal term of the tensor is the cross-shore direction term (
 $\widetilde{u^{\prime }u^{\prime }}$
, (a)), with two maxima in the crest immediately before and after breaking (phases 1 and 2, respectively). The first maximum is the highest in most of the vertical column of water. Then, a progressive reduction is observed, with a minimum value during the trough phase. The profiles are non-monotonic, and the values decrease beneath the surface elevation, reaching a minimum at
 $\unicode[STIX]{x1D701}\approx -0.35$
, then increasing again. The bottom of the flume is too far away to be responsible, and this behaviour can be attributed to a memory effect of the previous breaker. The turbulent stresses decay due to dissipation, but are still present when a new breaker arrives. These data also include the effects of the alongshore aligned large eddies moving offshore (Li & Dalrymple Reference Li and Dalrymple1998). The diagonal term
 $\widetilde{v^{\prime }v^{\prime }}$
in the vertical direction (b) and
 $\widetilde{w^{\prime }w^{\prime }}$
in the alongshore direction (c) are similar to
 $\widetilde{u^{\prime }u^{\prime }}$
, even though they both exhibit maximum values in the crest immediately after breaking in phase 2. The term
 $\widetilde{w^{\prime }w^{\prime }}$
is also much smaller than the other two terms, with a ratio of
 $\widetilde{w^{\prime }w^{\prime }}/\widetilde{u^{\prime }u^{\prime }}\approx 0.22$
, whereas
 $\widetilde{v^{\prime }v^{\prime }}/\widetilde{u^{\prime }u^{\prime }}\approx 0.55$
. These values are different for different phases, and vary in the ranges of
 $0.1<\widetilde{w^{\prime }w^{\prime }}/\widetilde{u^{\prime }u^{\prime }}<0.36$
and
 $0.36<\widetilde{v^{\prime }v^{\prime }}/\widetilde{u^{\prime }u^{\prime }}<0.86$
. Table 2 reports some values of the TKE distribution (defined as
 $1/2(u^{\prime }u^{\prime }+v^{\prime }v^{\prime }+w^{\prime }w^{\prime })$
) for different flow fields. In addition, De Serio & Mossa (Reference De Serio and Mossa2006) found
 $0<\widetilde{v^{\prime }v^{\prime }}/\widetilde{u^{\prime }u^{\prime }}<0.3$
and
 $0.1<\widetilde{v^{\prime }v^{\prime }}/\widetilde{u^{\prime }u^{\prime }}<0.5$
for spilling and plunging waves, respectively, with the range indicating the variation in the vertical and the minimum values near the bottom. The tangential stresses in the
 $x{-}y$
plane and the
 $y{-}z$
plane are of almost equal intensity. Figure 17(a,b) depicts the phase-resolved Reynolds stress tensor averaged in the vertical. The maximum TKE level occurs in the breaking phase (a). The shear stress in the
 $x{-}y$
plane is at the positive maximum during breaking and negative maximum immediately after (b). Also, the shear stress in the
 $y{-}z$
plane is lowest at the breaking point and is positive in all other phases. This behaviour, again, indicates alongshore dynamics, which in theory should be balanced for symmetry. The residual shear stress in the
 $x{-}z$
plane is almost negligible. Figure 17(d) shows the components of the Reynolds stress tensor integrated over a cycle and resolved in the vertical direction. The largest values of the (phasic) TKE are between the trough and the crest. Also, the time-averaged values are shown in curves that decay in the crest because the water concentration decreases.
Turbulent kinetic energy distribution. The values by Townsend (Reference Townsend1976) refer to plane wakes and have been commonly assumed in computing the turbulent kinetic energy under breaking waves having measured only the two main components of the velocity, see, for example, Stive & Wind (Reference Stive and Wind1982); the values by Nezu & Nakagawa (Reference Nezu and Nakagawa1993) refer to the intermediate region of an open channel; the values by Longo (Reference Longo2011) are beneath a fluctuating free surface.

Experiment 9b, Reynolds stress tensor. (a) Phase-averaged surface elevation with the indication of the phases; (b) phase-averaged normal stresses (diagonal terms) and TKE (
 $k$
, solid line); (c) phase-averaged shear stresses (non-diagonal terms); (d) cycle-averaged stresses, with filled circles indicating the TKE and the solid black line indicating the time-average (non-phasic) TKE. The dotted, dashed and dashed-dotted lines are the time-average (non-phasic) values of the normal stresses.

5 Turbulent kinetic energy balance
The governing equation for the average turbulent kinetic energy can be written as (e.g. Tennekes & Lumley Reference Tennekes and Lumley1972):
 $$\begin{eqnarray}\displaystyle \underbrace{\vphantom{\left({\displaystyle \frac{1}{\unicode[STIX]{x1D70C}}}\widetilde{u_{j}^{\prime }p^{\prime }}\right)}{\displaystyle \frac{\unicode[STIX]{x2202}\widetilde{k}}{\unicode[STIX]{x2202}t}}}_{I_{k}}+\underbrace{\widetilde{u_{j}}{\displaystyle \frac{\unicode[STIX]{x2202}\widetilde{k}}{\unicode[STIX]{x2202}x_{j}}}}_{II_{k}}=\underbrace{-{\displaystyle \frac{\unicode[STIX]{x2202}}{\unicode[STIX]{x2202}x_{j}}}\left({\displaystyle \frac{1}{\unicode[STIX]{x1D70C}}}\widetilde{u_{j}^{\prime }p^{\prime }}\right)}_{III_{k}}\underbrace{-{\displaystyle \frac{\unicode[STIX]{x2202}}{\unicode[STIX]{x2202}x_{j}}}\widetilde{u_{j}^{\prime }k}}_{IV_{k}}+\underbrace{{\displaystyle \frac{\unicode[STIX]{x2202}}{\unicode[STIX]{x2202}x_{j}}}\left(2\unicode[STIX]{x1D708}\widetilde{u_{i}^{\prime }\unicode[STIX]{x1D61A}_{ij}^{\prime }}\right)}_{V_{k}}\underbrace{-\widetilde{u_{i}^{\prime }u_{j}^{\prime }}\widetilde{\unicode[STIX]{x1D61A}_{ij}}}_{VI_{k}}\underbrace{-2\unicode[STIX]{x1D708}\widetilde{\unicode[STIX]{x1D61A}_{ij}^{\prime }\unicode[STIX]{x1D61A}_{ij}^{\prime }}}_{VII_{k}}, & & \displaystyle\end{eqnarray}$$
where
 $k=1/2(u_{i}^{\prime }u_{i}^{\prime })$
is the instantaneous turbulent kinetic energy,
 $\unicode[STIX]{x1D708}$
is the kinematic viscosity,
 $\widetilde{\unicode[STIX]{x1D61A}_{ij}}=1/2(\widetilde{u_{i,j}}+\widetilde{u_{j,i}})$
is the average rate of strain and
 $\unicode[STIX]{x1D61A}_{ij}^{\prime }=1/2(u_{i,j}^{\prime }+u_{j,i}^{\prime })$
is the fluctuating rate of strain. The terms are conventionally defined as (
 $I_{k}$
) local inertia, (
 $II_{k}$
) advection by mean flow, (
 $III_{k}$
) transport due to gradient pressure, (
 $IV_{k}$
) transport by velocity fluctuations, (
 $V_{k}$
) transport by viscous stresses, (
 $VI_{k}$
) production, and (
 $VII_{k}$
) viscous dissipation. The transport terms redistribute turbulent kinetic energy; the production term normally represents a transfer of energy from the mean flow to the fluctuating components; and the dissipation is defined as positive, and is a sink of energy for the turbulent flow, with transfer into heat. Figure 18 shows the phase-resolved averages for most of the terms in (5.1) for experiment 9b. The local inertia of TKE (figure 18
a) is mainly negative in the post-breaking phase, and it is generally smaller than the other contributions (except for the dissipation term) and assumes the largest (absolute) values in the phases immediately after breaking. Advection (see figure 18
b) is generally positive and directed onshore (because the alongshore and vertical contributions are minimal). Advection is quite effective in transferring TKE from the generation zone towards the swash zone. Its maximum value is immediately after breaking at the crest. Amongst the transport terms, the only one that can be directly estimated is the transport due to turbulence itself (term
 $IV_{k}$
, figure 18
c) (additionally, the transport term due to viscosity, term
 $V_{k}$
, can be estimated, but it is negligible). The transport due to turbulence is generally positive and partly counteracts the advection. A minor role is played by dissipation (figure 18
e) and by the production term (figure 18
d), which in some phases is negative. The production term is positive in most flows, but there is no restriction to its sign and it has been found be negative (i.e. a transfer of energy from turbulence to the mean flow) in experiments (e.g. Beguier et al.
Reference Beguier, Giralt, Fulachier, Keffer and Fiedler1978; Liberzon et al.
Reference Liberzon, Lthi, Guala, Kinzelbach and Tsinober2005) and in numerical simulations (e.g. Gayen & Sarkar Reference Gayen and Sarkar2011). Figure 18(f) depicts the transport term
 $III_{k}$
due to pressure fluctuations, which has been estimated by balancing all the other terms in (5.1).
Experiment 9b, TKE balance equation, phase-averaged values. (a) Local inertia (
 $I_{k}$
); (b) advection by mean flow (
 $II_{k}$
); (c) transport by velocity fluctuations (
 $IV_{k}$
); (d) production (
 $VI_{k}$
); (e) dissipation (
 $VII_{k}$
); (f) estimated transport due to gradient pressure (
 $III_{k}$
). Transport by viscous stresses is negligible.

Experiment 9b, TKE balance equation, values averaged in the vertical. (a) Surface elevation with the indication of the phases; (b) local inertia, advection by the mean flow and transport by velocity fluctuations; (c) production and dissipation terms, with the solid red line representing the estimated transport due to gradient pressure; (d) time–phasic-averaged terms. The solid line represents the estimated transport due to gradient pressure. Transport by viscous stresses is negligible.

Ratio between the dissipation rate for isotropic turbulence and dissipation rate for the non-isotropic turbulence. (a) Phase-resolved ratio averaged in the vertical and (b) ratio averaged in the vertical for experiments 1b–5b, with
 $T=1.5~\text{s}$
. The bars indicates one standard deviation (STD) of the 10 cycles sample drawn for experiment 2b; (b) phase-resolved ratio averaged in the vertical for experiments 1b–5b, with
 $T=1.5~\text{s}$
; (c,d) as for (a,b) for experiments 6b–9b, with
 $T=2.0~\text{s}$
. The bars indicates one STD of the 10 cycles sample drawn for experiment 6b. The hatched area in (a) and in (c) indicates the phase of breaking, which is slightly different for our set of experiments.

Comparison of spatial gradient of TKE computed with the ‘frozen turbulence’ hypothesis with
 $\widetilde{u}$
and
 $C$
as velocity of advection. Results for experiment 5b: (a) all phases and (b) integrated in the vertical. Results for experiment 9b: (c) all phases and (d) integrated in the vertical. The vertical lines in the panels (a and c) indicate the breaking phase.

Figure 19(a–c) shows the same data as shown in figure 18, but integrated in the vertical direction. Advection, transport and production provide the most relevant contribution across the breaking phase, with negligible values for the intrinsic variation in
 $k$
and the dissipation. The estimated transport due to the pressure gradient term (
 $III_{k}$
) changes sign across the breaking process, and counteracts transport due to fluctuating velocity components (term
 $IV_{k}$
). Figure 19(d) shows the data integrated over a wave cycle in phasic values. Again, advection, transport and production dominate the balance below the crest, whereas production changes sign; it is positive in the crest and negative for
 $\unicode[STIX]{x1D701}<\approx 0.15$
. One of the terms often approximated in modelling TKE is the dissipation rate. The numerous terms necessary to estimate the dissipation rate are seldom available in experimental data sets (direct numerical simulations perform much better in providing virtually all the terms, even though at high Reynolds number some models are adopted for the integration of the equations). Hence, in most cases, the hypothesis of isotropic turbulence is made, with an estimation of the dissipation rate given by (e.g. Tennekes & Lumley Reference Tennekes and Lumley1972)
 $$\begin{eqnarray}\unicode[STIX]{x1D716}_{isot}=15\unicode[STIX]{x1D708}\left(\overline{{\displaystyle \frac{\unicode[STIX]{x2202}u^{\prime }}{\unicode[STIX]{x2202}x}}}\right)^{2}.\end{eqnarray}$$
The present experimental data set allows the estimation of the dissipation rate
 $\unicode[STIX]{x1D716}$
according to its definition in (5.1) (term
 $VII_{k}$
), and a comparison of the ratio
 $\unicode[STIX]{x1D716}_{isot}/\unicode[STIX]{x1D716}$
, shown in figure 20 for all the experiments, with integration in the vertical (panels a and c) and for the wave cycle (panels b and d). In most of the present experiments results
 $\unicode[STIX]{x1D716}_{isot}>\unicode[STIX]{x1D716}$
. However, we bear in mind that the limited spatial resolution (0.4 cm grid step) and the limited temporal resolution (7.25 Hz) of the present experimental data do not allow an accurate estimation of dissipation, which typically occurs at very small scales. Hence, the observed values in the present experiments are presumably underestimated, either computed including all the terms or by assuming the isotropic state. For this reason, the terms obtained as closure of the balance should be taken as an approximation.
In the analysis of experimental data based on measurements at a single point (e.g. LDV measurements), the spatial gradients are unknown, and only time gradients can be computed. The spatial gradient terms are computed, whenever necessary, using the hypothesis of ‘frozen turbulence’. Essentially, it is assumed that turbulence (as well as other ‘scalars’ of the flow field) moves like a permanent wave satisfying the condition
 $\text{d}\widetilde{k}/\text{d}t=0$
, where
 $\text{d}/\text{d}t$
the total derivative. Hence, it is possible to map the spatial gradients using the time gradient with the transformation
 $\unicode[STIX]{x2202}/\unicode[STIX]{x2202}t+u\unicode[STIX]{x2202}/\unicode[STIX]{x2202}x=0$
, where
 $u$
an advective velocity. The advective velocity can be the phase-averaged cross-shore velocity or the celerity of the waves. Figure 21 shows a comparison between the experimental value of the local inertia of TKE and its estimation based on frozen turbulence with advection based on the phase-averaged cross-shore velocity and on the phase celerity of the wave, for experiment 5b (
 $T=1.5~\text{s}$
) and experiment 9b (
 $T=2.0~\text{s}$
). While the estimation based on the phase-averaged cross-shore velocity is acceptable in most phases (discrepancies are relevant in the breaking phases), the estimation based on the phase celerity is biased by significant over- or underestimates. Similar results are obtained for the other variables (not shown).
6 Conclusions
The analysis conducted in the present investigation reveals the numerous parameters that can be evaluated and the numerous models that can be tested if fully 3D velocity time series are available. Most of the simplifying schemes and approximations routinely adopted to overcome limited experimental data (1D or 2D LDV, planar PIV, 3D ultrasound velocity measurements of a single point) can be relaxed, and an almost complete balance of TKE can be tested. The V3V system allows an adequate time rate and spatial resolution to measure complex phenomenon, such as the breaking of waves in shallow water induced by a submerged bar on an inclined bottom. As a general consideration, the necessity of an adequate synthesis of the results obtained with 3D measurements arises because the huge amount of data obtained with V3V cannot be easily and adequately visualized (presently, the spatial and temporal resolution of the commercial V3V has already improved, with a consequent increase in the amount of data that can be collected in each experiments).
The phase-average transverse velocity (alongshore component) is two orders of magnitude smaller than the cross-shore and the vertical velocities, and still shows the periodicity with alternating negative and positive fluxes, due to a systematic asymmetry induced by the bar and due to the presumable formation of transverse recirculation cells (a laboratory effect). The cross-shore
 $\widetilde{u}$
and the vertical
 $\widetilde{v}$
phase-averaged velocities (the wave components) are nearly in quadrature, but a small correlation still exists. As a consequence, a momentum transfer due to the Reynolds wave stresses
 $\tilde{u} \tilde{v}$
enters the balance. The momentum is generally positive during breaking (transfer towards the crest) and negative immediately after breaking (transfer from the crest towards the underlying flow field). Its profile in the vertical (cycle phasic average) is generally positive (also negative in the crest for some experiments) but shows different behaviour according to the incoming wave characteristics. The inconsistencies are attributed to the presence of the bar, which modulates the flow field of the breaker differently for different incoming wave characteristics (height and period).
The cross-shore momentum balance shows the important role of the local inertia, while advection is of comparable intensity only immediately after breaking. Turbulent stresses act like inertia in the post-breaking phases, and require an extra net pressure gradient in addition to the net pressure gradient required to accelerate the fluid. The measured acceleration experienced in the breaker is a fraction of gravity, but it is expected to increase for stronger breakers. Its experimental value is limited by the absence of measurements exactly during breaking and smoothed by the spatial averages used to synthetically present the data. The average (in the vertical) pressure gradient during breaking influences the profile of the breaker, which is general steeper for a rapidly rising pressure gradient, and reaches a higher peak value. The peak value is generally delayed with respect to the crest of the breaker, except for less energetic breakers. Steepening of the breaker front is correlated to the cross-shore net pressure gradient term, smoothing of the breaker profile is correlated to the vertical net pressure gradient term. The pressure gradient also works against turbulent stresses, which in some phases behave like inertial terms.
Turbulent kinetic energy is essentially in the cross-shore and vertical directions. The mean values for one of the experiments indicate a distribution amongst the three directions similar to that observed in other turbulent flow fields, with a dominant cross-shore contribution and with relevant variation during the wave cycle. The structure of turbulence is far from isotropic, with a one-component behaviour only in the crest, and an evolving structure towards the bottom (not shown). The distance from isotropy should be considered with care, because the experimental data available for the present analysis have spatial and temporal resolutions that are insufficient for the detection of the microscale flow, the most dissipative and the most isotropic one. Some estimates of the dissipation rate with respect to the common assumption of the isotropic turbulence dissipation rate indicate that in many cases this last assumption overestimates the real dissipation. In this respect, the same caveat is due to the limited spatial and temporal resolutions. The main terms in the balance are the advection and the transport due to turbulence itself. Production can be ‘negative’, i.e. during some phases, turbulence transfers energy to the mean (wave) flow field. The hypothesis of ‘frozen turbulence’, adopted to estimate the spatial gradients based on the local time gradient, works better if the advection velocity is the wave component velocity, instead of, for example, the wave celerity.
Acknowledgements
We thank the anonymous referees for their competent and constructive comments on this paper.
Supplementary material
The data of measured velocity (raw or elaborated) for the nine tests are available on request to the authors.
Appendix
Figure 22 shows the instantaneous velocity vectors for experiment 6b, with vertical slices in the cross-shore-vertical planes (
 $X{-}y$
planes) across the alongshore direction. Figure 23 shows the phase-averaged velocity vectors. Figure 24 shows the fluctuating velocity components. The mean velocity in the vertical for all the experiments is shown in figure 25.
Experiment 6b. Instantaneous velocity vectors for the fourth snapshot of the first measured wave cycle. The panels refer to different values of
 $z$
, and are 0.8 cm apart.

Experiment 6b. Phase-averaged velocity vectors for the fourth snapshot of the first measured wave cycle. The panels refer to different values of
 $z$
, and are 0.8 cm apart.


Mean velocity in the vertical for all experiments normalized by
 $\bar{u}/\sqrt{g(d+\bar{\unicode[STIX]{x1D702}})}$
.



