

Women are underrepresented at every level of government in the United States.Footnote 1 Scholars have proposed a wide variety of reasons why elected office might be more elusive for women than for men, which fall into two broad categories: political socialization into lower levels of nascent political ambition and informal campaign and election barriers to officeholding. In this article, we examine the selection effects of these two processes on what types of men and women make it through the pipeline to political office—specifically, elected municipal offices such as mayor and city councilor. This analysis offers clues about how the pipeline is both similar and different for women and men and has important implications for the empirical study of women's representation.
Following a growing body of work on political psychology and women's representation (e.g., Bauer Reference Bauer2015a, Reference Bauer2015b, Reference Bauer2017; Cassese and Holman Reference Cassese and Holman2018; Kanthak and Woon Reference Kanthak and Woon2015; Oliver and Conroy Reference Oliver and Conroy2018; Schneider and Bos Reference Schneider and Bos2016; Schneider et al. Reference Schneider, Holman, Diekman and McAndrew2016), we use surveys of the general population and elected municipal officials to examine distributions of Big Five personality traits in three populations—the general public, the politically ambitious, and municipal officeholders.Footnote 2 We find that women of all personality profiles have lower average levels of nascent political ambition than similar men and that the magnitude of the gender gap in ambition is quite consistent across personality traits and range. In other words, the political socialization process into political ambition appears to be substantively the same for men and women—there is just an intercept shift by sex.
By contrast, the selection process for male and female political aspirants to officeholding does interact with personality in meaningful ways: female officeholders display higher levels of conscientiousness and extraversion than male officeholders. Importantly, these differences do not reflect differences in the general population or in the population of politically ambitious individuals. In other words, when it comes to the campaign and elections process, it may not make much sense to think of “the” political pipeline, but rather a political pipeline for women and a political pipeline for men (Carroll and Sanbonmatsu Reference Carroll and Sanbonmatsu2013).
CANDIDATE EMERGENCE AND SELECTION INTO OFFICE
Gender scholars have examined many aspects of whether women face unique challenges in the pipeline to political office. The bulk of these studies focus on one of two broad parts of the process: the development of nascent political ambition or specific aspects of the campaign and election process. Studies consistently show that women have lower levels of nascent political ambition than men—part of which may be the result of socialization into gender norms and part of which may be endogenous to lower levels of recruitment (Fox and Lawless Reference Fox and Lawless2005; Holman and Schneider Reference Holman and Schneider2018; Lawless and Fox Reference Lawless and Fox2010; Maestas et al. Reference Maestas, Fulton, Sandy Maisel and Stone2006; Moore Reference Moore2005; Preece and Stoddard Reference Preece and Stoddard2015; Schneider et al. Reference Schneider, Holman, Diekman and McAndrew2016).
Interestingly, despite the persistent gender gap in nascent political ambition, some research suggests that the factors that contribute to it may be broadly similar for men and women. Surveys of high school and college students find that once factors such as family socialization about politics and competitive experiences are controlled for, sex is no longer a significant predictor of political ambition (Fox and Lawless Reference Fox and Lawless2014). Girls and young women have less political ambition, but it appears to be because they receive fewer of the kinds of inputs that lead to it than boys and young men do. A similar pattern may play out in the way that recruitment to office leads to more interest in running. Both men and women who remember being recruited have greater political ambition, but women are recruited less than men (Lawless and Fox Reference Lawless and Fox2010). At the same time, based on surveys of state legislators, there is some evidence that the development of political ambition varies for men and women, with men following more of a self-starter model and women following more of a “relationally embedded” model (Carroll and Sanbonmatsu Reference Carroll and Sanbonmatsu2013).
While the research on ambition consistently shows gender differences, studies evaluating whether specific informal election institutions present disproportionate barriers for women come to a wider variety of conclusions. Candidate recruitment and negative recruitment patterns favor men (Crowder-Meyer Reference Crowder-Meyer2013; Niven Reference Niven2006). On the other hand, some studies of electoral institutions show no discrimination against women. For example, the media may cover men and women similarly (Hayes and Lawless Reference Hayes and Lawless2015)Footnote 3; fund-raising may not be much of a practical electoral barrier to women's representation (Barber, Butler, and Preece Reference Barber, Butler and Preece2016); party support of women appears to be similar to or higher than support of men (Doherty, Dowling, and Miller, Reference Doherty, Dowling and Millerforthcoming; Fraga and Hassell Reference Fraga and Hassell2018; Hassell and Visalvanich, Reference Hassell and Visalvanichforthcoming); and voters primarily care about partisanship and incumbency (Dolan Reference Dolan2014; Claassen and Ryan Reference Claassen and Ryan2016; but see Karpowitz et al. Reference Karpowitz, Quin Monson, Preece and Gimenez2018).
These and other null findings form the basis of the adage that when women run, women win (Burrell Reference Burrell1994). Nevertheless, most gender scholars agree that reality is much more complex. Many aspects of the campaign process are gendered (Conroy Reference Conroy2015, Reference Conroy2018; Dittmar Reference Dittmar2015a, Reference Dittmar2015b). Female candidates may be much higher quality than their male counterparts, or common research approaches may be poorly suited to measuring the campaign barriers women face—or both (Fulton Reference Fulton2012; Pearson and McGhee Reference Pearson and McGhee2013). This can make it extremely difficult to empirically identify whether gendered processes are at play in the campaign and election stage. Indeed, the possibility of selection effects that obscure causation is one of the biggest challenges to the empirical study of gender and representation.
Increasingly, scholars of women's underrepresentation have turned to political psychology—especially political psychology experiments—to untangle this puzzle. Some of this research examines the psychology of how male and female politicians conceptualize running for office and the effect on nascent political ambition (Kanthak and Woon Reference Kanthak and Woon2015; Schneider et al. Reference Schneider, Holman, Diekman and McAndrew2016; Preece Reference Preece2016). Other research focuses on how voters view male and female politicians during the campaign process (Bauer Reference Bauer2015a, Reference Bauer2015b, Reference Bauer2017; Cassese and Holman Reference Cassese and Holman2018; Schneider and Bos Reference Schneider and Bos2016) or how masculine personality traits affect recruitment (Oliver and Conroy Reference Oliver and Conroy2018). Our study goes in a different direction than most of this recent work on gender and political psychology, but it complements it nicely.
Instead of studying the political psychology of specific elements of the pipeline to office, we measure whether broad stages in the process result in different kinds of men and women navigating those stages successfully. In other words, we use tools from political psychology to present an overview of the effects of the pipeline to office. We do this by identifying differences in the average personality profiles of men and women moving from (1) the general population to the population of political aspirants and (2) the population of political aspirants to the population of local elected officials.
This kind of analytic approach is important because it provides information about the presence or absence of gendered selection effects, something that is empirically very challenging to do. If a selection process is egalitarian, we would expect to see it select on similar personality traits for both men and women. On the other hand, if we see differences in the types of men and women who advance through each stage (i.e., a disproportionate presence of one trait among men and a different trait among women), that indicates that gendered selection processes are at play. The findings can also give us clues about the nature of any gendered selection effects. This simple approach also allows us to evaluate the cumulative effects of these selection processes on how representative elected officials’ personality traits are of their baseline populations.
In examining how the political pipeline is gendered, we use the five-factor model or the “Big Five” personality traits: openness, conscientiousness, extraversion, agreeableness, and neuroticism (or its opposite, emotional stability).Footnote 4 We do so for several reasons. First, we have strong reasons to believe that voters and candidate recruiters are looking for different character traits for men and women when evaluating potential candidates (Dittmar Reference Dittmar2015b; Karpowitz et al. Reference Karpowitz, Quin Monson, Preece and Gimenez2018). Moreover, we also have strong reasons to believe that women focus on different components of the electoral environment when considering a run for office (Carroll and Sanbonmatsu Reference Carroll and Sanbonmatsu2013; Dittmar Reference Dittmar2015b; Kanthak and Woon Reference Kanthak and Woon2015), which might also result in differences in personality traits. Personality traits correlate with the comfort individuals experience while participating in different contexts—and, in particular, their interest in running for political office (Dietrich et al. Reference Dietrich, Lasley, Mondak, Remmel and Turner2012; Dynes, Hassell, and Miles Reference Dynes, Hassell and Miles2019). These traits consistently emerge as dominant features of individual personality (McCrae and Costa Reference McCrae, Costa, John, Robins and Pervin2008).
Furthermore, individual scores on the Big Five personality traits are remarkably stable. A longitudinal study of German youth measured their personality traits during the last year of high school and every two years afterward for eight years. The changes in personality over the course of the eight-year study were mostly attributed to maturation even when comparing those who entered military service with those who did not (Jackson et al. Reference Jackson, Thoemmes, Jonkmann, Lüdtke and Trautwein2012). Research suggests that as people mature, it is possible for them to register minor changes in their personality traits, but after an individual reaches 30 years of age, their personality remains stable for the rest of their life (McCrae and Costa Reference McCrae and Costa2005; Specht, Egloff, and Schmukle Reference Specht, Egloff and Schmukle2011). Neither the number of life changes, the severity of those life changes, nor changes to physical or mental health have been found to significantly alter one's personality over the course of their adult life (summarized in McCrae and Costa Reference McCrae and Costa2005, 130–35). Additionally, there is evidence that personality traits are genetically heritable (Jang, Livesley, and Vernon Reference Jang, Livesley and Vernon1996; Vukasović and Bratko Reference Vukasović and Bratko2015).
Finally, a large body of work has found that the Big Five are associated with a wide range of political attitudes and behaviors among voters (see Gerber et al. Reference Gerber, Huber, Doherty and Dowling2011 for a review). In addition, some of the genes that predispose individuals to developing certain personality traits also predispose them to selecting certain forms of political participation as adults. The political context largely determines why individuals with certain personality traits opt for one form of political participation over another (Miles and Haider-Markel Reference Miles and Haider-Markel2018). And, a new but growing literature finds that personality traits influence decision-making in office (Caprara et al. Reference Caprara, Francescato, Mebane, Sorace and Vecchione2010; Cuhadar et al. Reference Cuhadar, Kaarbo, Kesgin and Ozkececi-Taner2016; Dietrich et al. Reference Dietrich, Lasley, Mondak, Remmel and Turner2012; Ramey, Klingler, and Hollibaugh Reference Ramey, Klingler and Hollibaugh2017) and during the campaign (Hassell Reference Hassell2019). The well-established nature of the Big Five in the social sciences, their usefulness in identifying individual personality differences, and their relationship to the comfort an individual feels in different social and professional environments make them an ideal framework for an analysis of how the political pipeline selects for male and female candidates for public office.
METHODS AND RESULTS
To examine the political selection process for men and women, we examine personality traits by sex among both the general American public (using an online survey of a representative sample of 1,939 American adults conducted in 2015) and elected officials (using a survey of 2,354 elected officials serving in municipal government in the United States conducted in 2016). For extensive details on both surveys, please see the appendix in the Supplementary Materials online.
Our online survey of municipal officials targeted elected municipal executives (mayors) and legislators (e.g., city councilors, aldermen, supervisors, etc.). This sample is similar to ones used in previous work to understand municipal officials’ decision-making (e.g., Butler et al. Reference Butler, Volden, Dynes and Shor2017), including on issues of gender and candidate emergence (Butler and Preece Reference Butler and Preece2016). The survey was administered online using Qualtrics and conducted in two waves sent to two different samples of municipal officials. Email invitations to the first wave were sent in May and June 2016 to a sample of 27,862 elected mayors and municipal legislators from 4,187 cities with populations of more than 10,000. This wave had a 17.8% response rate, similar to other surveys of municipal officials.Footnote 5
The second wave of the survey was conducted in June and July 2016. That sample consisted of the email addresses of elected mayors and municipal legislators gathered by Daniel Butler and Adam Dynes for surveys conducted in 2012 and 2014. Given that these email addresses were gathered two to four years earlier, we knew that a large percentage would no longer be accurate. Indeed, 26% of the emails sent through Qualtrics were undeliverable. It is likely that some of the active email addresses were no longer monitored. The response rate for the second round of the survey was 6.9%.
We combine both rounds of the survey and analyze the data together given the short amount of time between the two waves of the survey. Overall, the municipal officials in our sample come from a wide variety of municipalities from 49 states.Footnote 6 Respondent characteristics also vary significantly across a wide range of politically relevant variables. Though respondents come from slightly larger cities than the average municipal official,Footnote 7 these cities are representative in terms of cities’ aggregate policy views (as measured by Tausanovitch and Warshaw Reference Tausanovitch and Warshaw2013) and demographic features such as minority population size, median income, employment, and education levels. And while the full population of municipal officials is unknown, respondents to our survey are similar to nonrespondents on gender and elected position (i.e., mayor versus city council members). Finally, in Table A8 in the appendix, we show that the personality differences between female and male officials hold even when controlling for a host of other politically relevant variables.
In both samples, we asked a battery of questions designed to measure Big Five personality traits and questions measuring nascent political ambition in the general population. (In both surveys, the battery of personality trait questions was one of many sets of questions used for a variety of research projects.) Consistent with previous work, we measure each respondents’ personality trait scores by calculating their mean response across the items measuring a particular trait and then rescale the mean to be from 0 to 1, with higher numbers indicating higher levels of a particular trait. To measure nascent political ambition among the general population, following Lawless and Fox (Reference Lawless and Fox2010), we asked respondents about their “attitude toward running for office in the future.” We find that 17% of the sample is either “actively considering” (1%) or “open to the possibility” (16%) of running for office in the future. Further details on the sample and methodology are available in the appendix.
Nascent Political Ambition
We begin by examining the relationship between personality traits and nascent political ambition for men and women. In other words, do the personality profiles of politically ambitious men and women look similar or different? This will help us ascertain whether the socialization process that leads to being open to running for office is distinct for men and women.
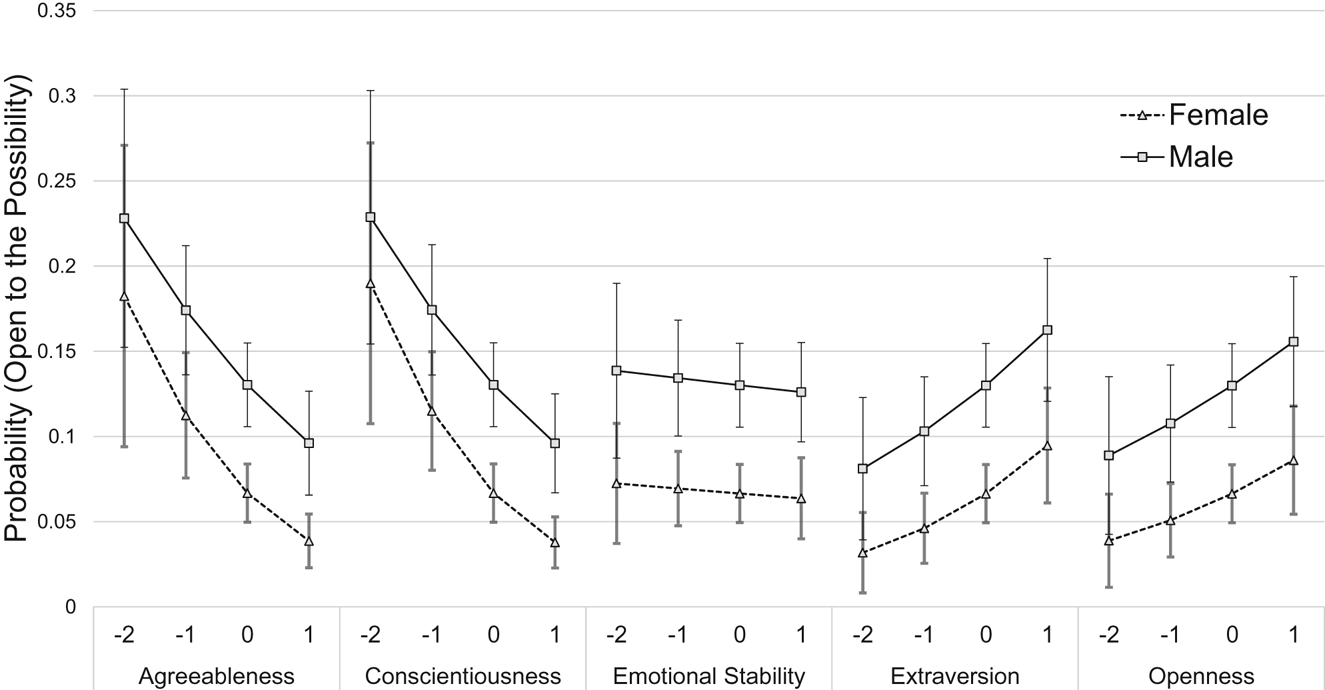
Figure 1 is estimated from an ordered logit model (available in the appendix).Footnote 8 We include personality traits as well as controls for income, education, party identification, ideology, and race. We asked respondents to characterize their interest in running for public office on a three-point scale (no interest = 80%, open to the possibility = 16%, actively considering = 1%). Figure 1 plots the predicted probability of a respondent saying that he or she is open to the possibility of running for higher office by gender and each personality trait level.
The effect of personality traits on political ambition in the general population by gender.
Source: Survey of U.S. adults, 2015. Notes: Points represent the predicted probabilities from the ordered logistic regression model; bars denote the 95% confidence interval. X-axis is the standard deviation from the mean. N = 955 for women; 985 for men.

Consistent with previous research, we find that women generally express less interest than men in running for office and that personality predicts ambition (Dietrich et al. Reference Dietrich, Lasley, Mondak, Remmel and Turner2012; Dynes, Hassell, and Miles Reference Dynes, Hassell and Miles2019). What is interesting, however, is that the slopes of these lines for men and women are approximately parallel. For both men and women, agreeableness and conscientiousness are strongly negatively correlated with political ambition, emotional stability is slightly negatively correlated with political ambition, and extraversion and openness are strongly positively correlated with political ambition. In other words, sex does not interact with personality in regard to a willingness to express political ambition. On average, women of all personality types express less interest in running for office than similar men—but the personality traits that predict political ambition are substantively the same across sex. Hence, although it takes more (or less) of a given personality trait to lead to political ambition for women than men, the same basic types of men and women are attracted to running for office.
This is consistent with Fox and Lawless's (Reference Fox and Lawless2014) findings that the primary reason girls and young women are less politically ambitious is that they receive fewer of the inputs that predict political ambition—for example, they are less likely to be part of political conversations or participate in competitive sports. When thinking about our findings in conjunction with theirs, it seems that existing socialization processes work best to motivate a particular profile of person into politics, but women with that personality profile are less likely to receive that socialization than men are. Interestingly, as our next section shows, the profile that is most likely to be open to running for office in the future is not necessarily the profile that is mostly likely to be successful at navigating the campaign and election process.
Selection into Office
The previous section investigated how personality and gender influence who is open to running for office. However, simply being interested in running for office is not enough for representation to occur. Political aspirants must navigate a campaign and election process to actually get into office. Hence, this section compares the personality traits of men and women with similar levels of political ambition with the personality traits of men and women actually in office.
In other words, we are interested in finding out whether there is evidence of gendered selection effects into office. A gender-neutral selection process into office would take one of two forms. It might replicate the same distribution of traits that exist among political aspirants, which would correspond with a process along the lines of a random draw from the male and female political aspirant pools, respectively. Or it might result in more or less identical personality profiles among men and women in office, which would correspond with a process that selects for the same personality traits, regardless of sex.
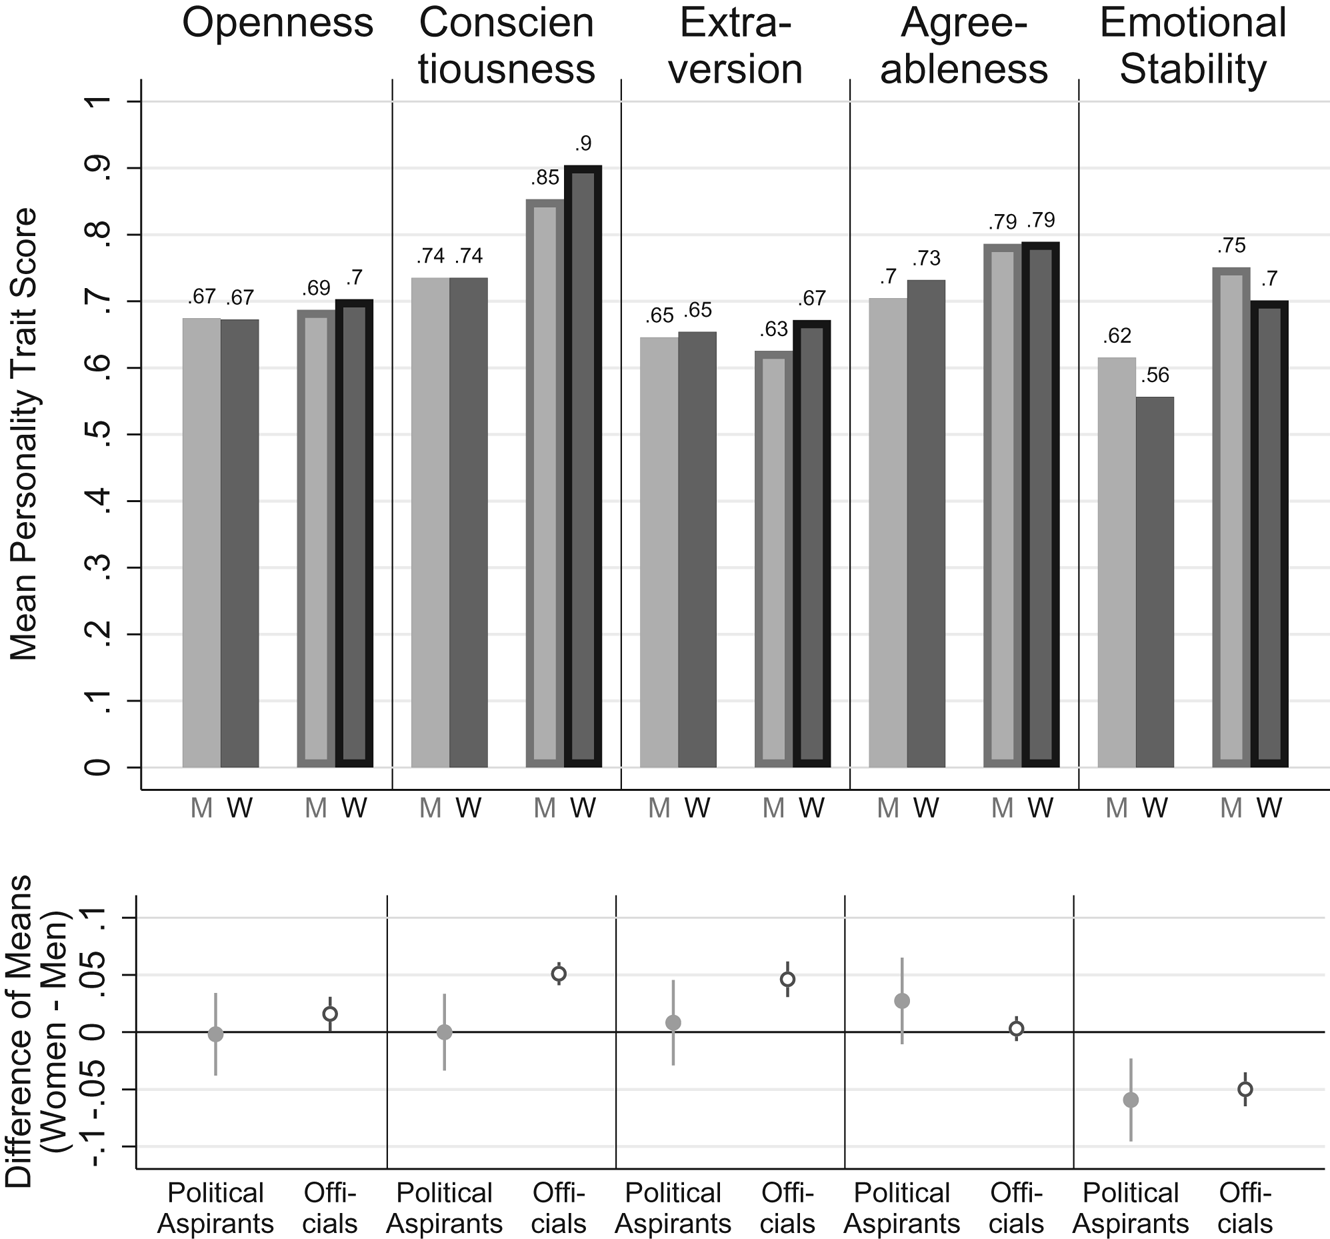
Figure 2 shows the differences in the distribution of personality traits among men and women who have expressed an interest in running for higher office in the general population survey (“political aspirants”)Footnote 9 and the elected municipal officials.Footnote 10 We first note the remarkable similarity in the distribution of personality traits between politically ambitious men and women in the general population sample (see Table A6 in the appendix for statistical tests). As follows from the previous section, the same types of men and women tend to have political ambition. On openness, conscientiousness, extraversion, and agreeableness, politically ambitious individuals have very similar scores, regardless of their sex; politically ambitious females do score somewhat lower on emotional stability than their male counterparts, though.
Differences in personality traits between men and women in the general population with political ambition and among male and female elected local officials.
Notes: Bar graph (top panel) indicates groups’ mean score on the Big Five personality traits, which are measured on a scale from 0 to 1, where higher numbers indicate higher levels of that trait. Light gray bars indicate means for men, while dark gray bars indicate means for women. For each personality trait, the two bars on the left side are the means for male and female political aspirants while the two bars on the right are the means for male and female elected officials. The lower panel indicates the difference of means between women and men among political aspirants (solid gray circles) and among elected officials (open black circles), with their corresponding 85% confidence intervals. We use 85% confidence intervals (Maghsoodloo and Huang Reference Maghsoodloo and Huang2010; Payton, Miller, and Raun Reference Payton, Miller and Raun2000) to more clearly indicate statistically significant differences between the difference of means at the 0.05 level, which is achieved when the confidence intervals do not overlap, as is the case with conscientiousness. N = 651 for female officials; 1,699 for male officials; 102 for female political aspirants; 235 for male political aspirants.

Yet, in contrast to our political ambition findings, we find evidence of gendered differences in the process of selection into office. Despite the overall similarities in the distribution of personality traits among politically ambitious individuals, there are some differences in the distribution of personality traits among male and female elected officials. There are statistically significant differences in male and female elected officials’ levels of conscientiousness (diff. = 0.05 or one-third of a standard deviation, p < .01), extraversion (diff. = 0.05 or one-fifth of a standard deviation, p < .01), and emotional stability (diff. = 0.06 or one-quarter of a standard deviation, p < .01). Female elected officials are significantly more conscientious and extraverted, while male elected officials score higher on emotional stability.Footnote 11
This suggests a gendered campaign and election selection process at play, but the process might still be considered gender-neutral if this just represented proportional draws from populations with different baseline traits. In other words, if male and female aspirants were fundamentally different from each other and that difference was merely replicated among male and female elected officials, then we may not be so concerned about how gendered the campaign and election process is. For one trait—emotional stability—that seems to be precisely the case. The gender gap in emotional stability among political aspirants is exactly replicated among elected officials. As the lower panel in Figure 2 shows, the difference-in-differences estimation for emotional stability is practically zero. And while the gender gap in extraversion is slightly larger, its difference-in-differences calculation falls below standard levels of statistical significance. Essentially, controlling for the level of these traits in the political aspirant pool, it does not seem to be the case that campaigns and elections are differentially selecting men and women for emotional stability and possibly extraversion.
The findings for conscientiousness, however, are different. Taking political aspirants as the baseline, female elected officials are disproportionately conscientious compared to male elected officials. As Figure 2 shows, levels of conscientiousness among male and female political aspirants are identical. But among elected officials, female aspirants are more conscientious. In fact, female elected officials show the highest levels of conscientiousness of any group for any trait.
Our data obviously cannot identify the precise reasons for these differences or the specific parts of the campaign and election processes that account for them. However, thinking about our results in conjunction with prior research is helpful with regard to conscientiousness and extraversion. Our conscientiousness findings dovetail well with existing research that finds that, at least at the congressional level, women typically feel the need to be more qualified—and indeed are more qualified—to run for office (Lawless and Fox Reference Lawless and Fox2010; Pearson and McGhee Reference Pearson and McGhee2013). They also face more primary election challengers (Lawless and Pearson Reference Lawless and Pearson2008). It is perhaps not coincidental that they are often more effective legislators (Anzia and Berry Reference Anzia and Berry2011; Volden, Wiseman, and Wittmer Reference Volden, Wiseman and Wittmer2013). Further, the work on candidate recruitment may help explain why extraverted women are somewhat overrepresented in office. We know that recruitment is an important part of the pipeline to office and that the networks that recruiters typically draw from are male-dominated (Carroll and Sanbonmatsu Reference Carroll and Sanbonmatsu2013; Crowder-Meyer Reference Crowder-Meyer2013; Lawless and Fox Reference Lawless and Fox2010; Niven Reference Niven2006). Extraverted women may be better suited to break into these male-dominated recruitment networks.
The Overall Consequence of the Political Pipeline
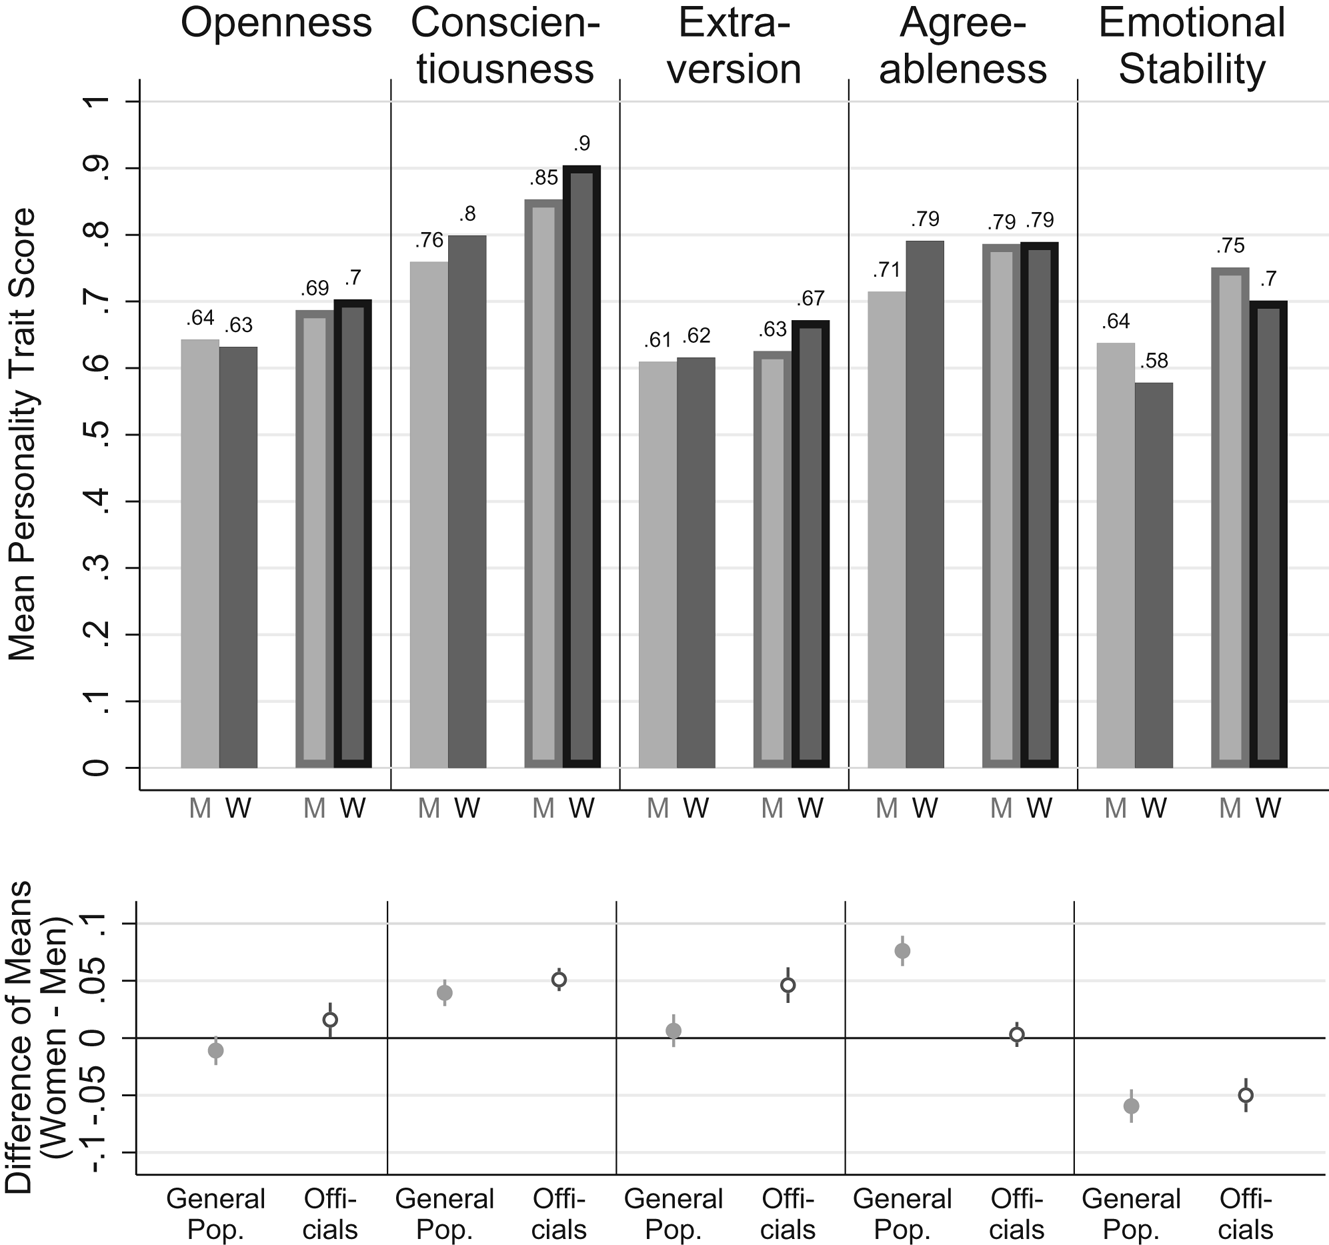
Now that we have examined two constituent parts of the pipeline to elected office, we examine the overall consequence of these selection processes on the distribution of men and women in office compared to men and women in the general population. This provides a summary of the effect of these processes on descriptive representation, as seen through the lens of gender and personality traits. As Figure 3 shows,Footnote 12 elected officials typically score higher on the Big Five personality traits than their respective general populations, especially with regard to emotional stability (diff. = 0.12 or one-half of a standard deviation, p < .01) and conscientiousness (diff = 0.09 or one-half of a standard deviation, p < .01). It is not especially surprising that the pipeline to elected office does not represent a random draw of citizens. In fact, it may be desirable that the overall political pipeline (in stark contrast to nascent political ambition) strongly selects for traits such as emotional stability and conscientiousness. This normative question is, of course, worth debating; as Mansbridge (Reference Mansbridge1999, 630–32) points out, it is not entirely clear that a random draw from the citizenry would mortally impair the function of local government.
Differences in personality traits between men and women in the general population and among male and female elected local officials.
Notes: Bar graph (top panel) indicates groups’ mean score on the Big Five personality traits, which are measured on a scale from 0 to 1, where higher numbers indicate higher levels of that trait. Light gray bars indicate means for men while dark gray bars indicate means for women. For each personality trait, the two bars on the left side are the means for men and women in the general population while the two bars on the right are the means for male and female elected officials. The lower panel indicates the difference of means between women and men in the general population (solid gray circles) and among elected officials (open black circles), with their corresponding 85% confidence intervals. We use 85% confidence intervals (Maghsoodloo and Huang Reference Maghsoodloo and Huang2010; Payton, Miller, and Raun Reference Payton, Miller and Raun2000) to more clearly indicate statistically significant differences between the difference of means at the 0.05 level, which is achieved when the confidence intervals do not overlap, as is the case with extraversion and agreeableness. N = 651 for female officials; 1,699 for male officials; 955 for women in the general population; 985 for men in the general population.

In addition to these overall differences, there are some gender differences. Figure 3 shows that male elected officials are significantly more agreeable than the average man in the general population compared with female elected officials and the average woman in the general population (diff.-in-diff. = –0.08 or two-fifths of a standard deviation, p < .01), while female elected officials are more extraverted (diff.-in-diff. = 0.04 or one-fifth of a standard deviation, p < .01) and marginally more open (diff.-in-diff. = 0.02 or one-tenth of a standard deviation, p < .1). These differences in the representativeness of personality traits among male and female elected officials may have important implications for representation, as recent work finds evidence that personality traits affect policy makers’ decision-making in office (Best Reference Best2011; Caprara et al. Reference Caprara, Francescato, Mebane, Sorace and Vecchione2010; Cuhadar et al. Reference Cuhadar, Kaarbo, Kesgin and Ozkececi-Taner2016; Dietrich et al. Reference Dietrich, Lasley, Mondak, Remmel and Turner2012; Ramey, Klingler, and Hollibaugh Reference Ramey, Klingler and Hollibaugh2017).
CONCLUSION
Political scientists have studied a wide variety of specific contributions to women's underrepresentation in politics. In this article, we take a different approach—we describe who makes it through the two broad stages of the political pipeline. In other words, our findings give us a view of what the overall pipeline for office looks like for men and women and allow us to make some assessments about the similarities and differences of the process for men and women.
We find that women of all personality profiles have consistently lower average levels of nascent political ambition than men with similar personality profiles. Yet there is almost no interaction between gender and personality, suggesting that the process of socialization into political ambition may be broadly similar for men and women—women just receive less of it or respond less strongly. This reinforces the findings that have looked at the predictors of nascent political ambition and found them to be broadly similar for boys and girls (Fox and Lawless Reference Fox and Lawless2014).
At the same time, we find that the campaign and election process selects for somewhat different kinds of men and women. In particular, when compared with the pool of political aspirants, female elected officials are differentially more conscientious and somewhat more extraverted than male elected officials. Though determining the mechanisms through which these selection effects happen are beyond the scope of our data, we hypothesize that this may be because women feel the need to be more qualified before running for office and need to be especially extraverted to break into male-dominated recruitment networks and get the “relationally embedded” encouragement they need to run (Carroll and Sanbonmatsu Reference Carroll and Sanbonmatsu2013). If these are indeed the mechanisms through which this differential selection happens, there are reasons to believe that other underrepresented groups may show similar patterns of personality trait differences. For example, social networks are profoundly racially segregated (McPherson, Smith-Lovin, and Cook Reference McPherson, Smith-Lovin and Cook2001); since political networks tend to be predominantly white, it would not be surprising to find that African American elected officials are especially extraverted.
Our findings about the campaign and election process reinforces findings from Carroll and Sanbonmatsu (Reference Carroll and Sanbonmatsu2013) that men and women have somewhat different pathways to office. Gendered processes in the latter stages of the political pipeline mean that it may not make sense to think of “the” political pipeline, but rather a political pipeline for men and a political pipeline for women. From an empirical analysis standpoint, this suggests a different kind of methodological approach than simply controlling for sex when studying the campaign and election process, as our findings suggest one reasonably could when studying socialization into political ambition. Researchers who study campaigns and elections may consider returning to the analytic approach that Burns, Schlozman, and Verba (Reference Burns, Schlozman and Verba2001, 48–50) employ, namely, running different models for men and women or making generous use of interaction terms in analyses.
Finally, our findings have implications for the adage that when women (want to) run, women win. Comparing the profiles of politically ambitious citizens to the profiles of local officeholders makes it clear that some kinds of women are more successful than others, and these women differ somewhat from the kinds of men who are successful. Our results show that, independent of the political ambition deficit, there are gendered selection effects at play in the campaign and/or election process. Focusing on identifying those selection effects should be a priority for gender scholars.
SUPPLEMENTARY MATERIAL
To view supplementary material for this article, please visit https://doi.org/10.1017/S1743923X19000461