Introduction
Biogenic carbonate is precipitated in various polymorphs as discrete layers or functional components in molluscan shells. These polymorphs dissolve at different rates in seawater: in order of increasing solubility, low- and moderate-Mg calcite, aragonite, high-Mg calcite (Canfield and Raiswell Reference Canfield and Raiswell1991), although relative solubilities are affected by microstructural surface area and shell organic content (Walter Reference Walter1985; Glover and Kidwell Reference Glover and Kidwell1993). Mineralogical composition is typically conserved at the level of biological families or higher (Carter Reference Carter1990a). For this reason, studies relying on the relative numbers of individuals or species from different higher taxa are potentially susceptible to taphonomic distortion. Such studies are pervasive in paleobiology and include ecological interpretation of relative abundance distributions within communities (Powell and Kowalewski Reference Powell and Kowalewski2002; Peters Reference Peters2004a,Reference Petersb; Wagner et al. Reference Wagner, Kosnik and Lidgard2006; Cherns and Wright Reference Cherns and Wright2009), analysis of trophic structure (Dunne et al. Reference Dunne, Williams, Martinez, Wood and Erwin2008), documentation of major changes in global ecosystems (Vermeij Reference Vermeij1977; Signor and Brett Reference Signor and Brett1984), modeling of macroevolutionary dynamics (Sepkoski Reference Sepkoski1981, Reference Sepkoski1984), and inference of evolutionary rates from taxonomic structure (Foote Reference Foote2012).
All else being equal, dominantly aragonitic or high-Mg calcitic shells are expected to suffer greater post-mortem taphonomic and diagenetic destruction on the seafloor and during early burial than shells composed dominantly of low-Mg calcite. Widespread evidence supports this expectation for the case of aragonite and, in particular, for carbonate-rich environments (Nelson Reference Nelson1978; Palmer and Wilson Reference Palmer and Wilson2004; James et al. Reference James, Bone and Kyser2005; Kidwell et al. Reference Kidwell, Best and Kaufmann2005; Cherns et al. Reference Cherns, Wheeley and Wright2011). This evidence has driven a general assumption, also supported by many empirical studies, that the fossil record is pervasively and perhaps profoundly biased against organisms with mineralogically less stable shells (Harper Reference Harper1998; Brachert and Dullo Reference Brachert and Dullo2000; Cherns and Wright Reference Cherns and Wright2000, Reference Cherns and Wright2009; Smith and Nelson Reference Smith and Nelson2003; Wright et al. Reference Wright, Cherns and Hodges2003; James et al. Reference James, Bone and Kyser2005; Caron and Nelson Reference Caron and Nelson2009; Cherns et al. Reference Cherns, Wheeley and Wright2011; Hendy Reference Hendy2011). Estimates of the magnitude of the bias, in terms of the loss of species with more reactive shells, are on the order of less than 10% to ~50% in studies of local and regional diversity (Koch and Sohl Reference Koch and Sohl1983; Cherns and Wright Reference Cherns and Wright2000; Bush and Bambach Reference Bush and Bambach2004).
In contrast, a number of recent studies have argued that the bias is relatively small or negligible at larger spatial and temporal scales (Kidwell Reference Kidwell2005; Crampton et al. Reference Crampton, Foote, Beu, Maxwell, Cooper, Matcham, Marshall and Jones2006a; Kowalewski et al. Reference Kowalewski, Kiessling, Aberhan, Fürsich, Scarponi, Barbour Wood and Hoffmeister2006; Valentine et al. Reference Valentine, Jablonski, Kidwell and Roy2006; Rivadeneira Reference Rivadeneira2010). For example, Kidwell (Reference Kidwell2005) showed that global data on bivalve genera do not support the hypothesis that those with less stable shell mineralogy have shorter durations or significantly more stratigraphic singletons. Her interpretation, in part, was that data at this scale contain substantial redundancy and that recrystallization of aragonite to calcite can actually increase long-term preservation potential. Other work has shown, also with global data at the genus level, that temporal patterns of occurrence frequency are not clearly predicted as artifacts of mineralogy or other aspects of shell structure (Behrensmeyer et al. Reference Behrensmeyer, Fürsich, Gastaldo, Kidwell, Kosnik, Kowalewski, Plotnick, Rogers and Alroy2005; Kosnik et al. Reference Kosnik, Alroy, Behrensmeyer, Fürsich, Gastaldo, Kidwell, Kowalewski, Plotnick, Rogers and Wagner2011).
Thus the question of scale is critical (Kosnik et al. Reference Kosnik, Alroy, Behrensmeyer, Fürsich, Gastaldo, Kidwell, Kowalewski, Plotnick, Rogers and Wagner2011). At the scale of alpha diversity in an individual bed, preservation potential will be determined by the interplay of shell durability, time spent in the taphonomically active zone, and the local taphonomic and diagenetic environments (Koch and Sohl Reference Koch and Sohl1983; Smith and Nelson Reference Smith and Nelson2003; Cherns et al. Reference Cherns, Wheeley and Wright2008, Reference Cherns, Wheeley and Wright2011). In contrast, when considering presence/absence data at regional to global scales over long time spans, sampling potential of a given species will also reflect the abundance and geographic and stratigraphic ranges of the species, time scale of analysis, redundancy in the fossil record, and factors relating to the nature of the environmental and rock records. Importantly, as noted above, dissolution of aragonite need not always result in complete destruction of fossils, and various processes promote preservation of originally aragonitic fossils in altered form (McAlester Reference McAlester1962; Bush and Bambach Reference Bush and Bambach2004; Kidwell Reference Kidwell2005; Kidwell et al. Reference Kidwell, Best and Kaufmann2005; Kowalewski et al. Reference Kowalewski, Kiessling, Aberhan, Fürsich, Scarponi, Barbour Wood and Hoffmeister2006; Cherns et al. Reference Cherns, Wheeley and Wright2008; Tomašových and Schlögl Reference Tomašových and Schlögl2008; Caron and Nelson Reference Caron and Nelson2009).
Here, we compare temporal variation in sampling probability of dominantly aragonitic versus dominantly calcitic marine mollusk species at the regional spatial scale (~106 km2) and the temporal scale of stratigraphic stages (~2.4 million years on average). We then interpret these results in light of local, bed-level data, where we explicitly consider the lithology of each collection as well as the attributes of individual species. We explain the observations in terms of both preservational and ecological factors and conclude that spatiotemporally localized sampling in this study system is broadly consistent with the regional picture. Importantly, at both the regional and local scales, preservational bias is effectively absent in terrigenous clastic sediments and is otherwise time-varying and predictable on the basis of gross features of the rock record, and large segments of the record show no appreciable bias.
Materials and Methods
Nature and Sources of Data
Our data set represents the exemplary fossil record of New Zealand Cenozoic midlatitude mollusks that occupied marine shelf environments (Crampton et al. Reference Crampton, Foote, Beu, Maxwell, Cooper, Matcham, Marshall and Jones2006a). This record derives from a single first-order, transgressive-regressive, mixed siliciclastic-temperate carbonate stratigraphic sequence (King et al. Reference King, Naish, Browne, Field and Edbrooke1999; Crampton et al. Reference Crampton, Foote, Beu, Cooper, Matcham, Jones, Maxwell and Marshall2006b). Data were downloaded from the New Zealand Fossil Record File Electronic Database (FRED: http://www.fred.org.nz/). We restricted the analysis to bivalves, gastropods, and scaphopods that are inferred to have inhabited level-bottom environments at shelf depths (0–200 m water depth; see Crampton et al. Reference Crampton, Foote, Beu, Maxwell, Cooper, Matcham, Marshall and Jones2006a) and excluded pelagic, littoral, and estuarine taxa. The following data were eliminated prior to analysis: fossil lists prepared by identifiers of unknown or doubtful expertise, all uncertain identifications (including “cf.” and “aff.” modifiers), collections that could not be dated to a single time bin, and collections lacking information on enclosing rock type. Following these adjustments, our database contains 2951 collections that were used to characterize the stratigraphic record (Table A1), where each collection derives from a single locality (nearly always a single bed or narrow stratigraphic interval) that was sampled by one person or team on a single occasion. The time bins used in this study are stages of the New Zealand geological timescale, updated from Hollis et al. (Reference Hollis, Beu, Crampton, Jones, Crundwell, Morgans, Raine and Boyes2010). To analyze species sampling, we further restricted the data to include only occurrences of taxa that have information on shell composition (>99%) and are resolved to the species level, leaving a database of 16,007 species-level occurrences of 1466 species from 2494 collections.
Data on the abundance and distribution of living marine mollusks occupying the shelf around New Zealand were extracted from the database of the Museum of New Zealand Te Papa Tongarewa. We used information relating to 16,330 geographically localized samples of 335 species that are shared with our fossil data set and have known shell composition.
Biological Attributes of Species
Following Crampton et al. (Reference Crampton, Foote, Beu, Maxwell, Cooper, Matcham, Marshall and Jones2006a), mollusks were classified as calcitic if their shell includes a substantial calcitic component that could, in the absence of aragonite, be identified to species level. Aragonitic taxa are those that would not be identifiable following aragonite loss (and assuming no replacement by other minerals or formation of molds). We note that our compositional categories differ somewhat from those adopted in other studies of taphonomic bias (e.g., Kidwell Reference Kidwell2005), but are designed to reflect the real-world process of documenting the fossil record, with its emphasis on species identification. Nearly all identifications of aragonitic taxa are based on preserved shell material rather than molds (Crampton et al. Reference Crampton, Foote, Beu, Maxwell, Cooper, Matcham, Marshall and Jones2006a: p. 518).
Shell size measurements used here are based on updated data from Crampton et al. (Reference Crampton, Cooper, Beu, Foote and Marshall2010); each species was assigned a single size value based on the maximum linear dimension of an average adult shell. For the purposes of the present study, we binned size measurements into three categories: small (≤10 mm), medium (>10 mm and ≤32.5 mm), and large (>32.5 mm). These arbitrary divisions were designed to divide the spectrum of size so that roughly equal numbers of species fall into each category. For analyses involving size, we omitted two species that are relevant to those analyses but lack size information.
Stratigraphic and Lithologic Data
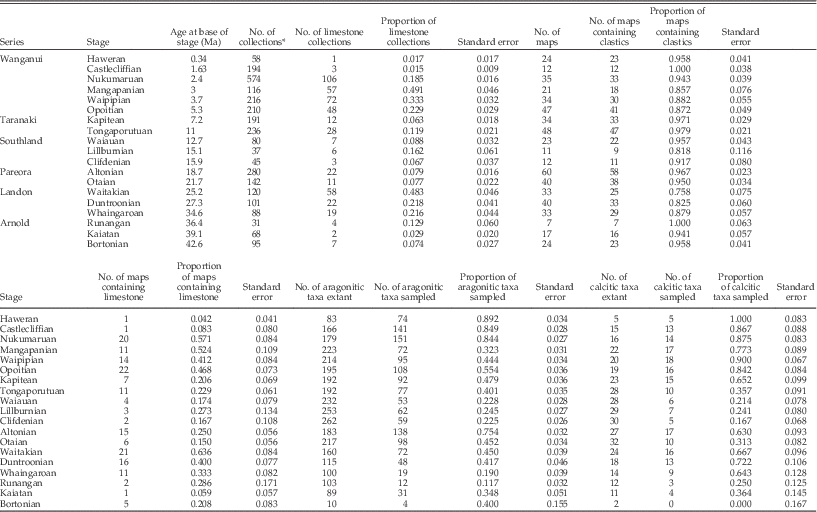
The stratigraphic record was characterized in two ways, regional and site-specific (Table A1). First, we compiled collection lithological data from the FRED “carbonate” field, which is coded into three categories based mainly on subjective field determinations: “limestone,” “calcareous,” and “non-calcareous,” the latter two designations being for siliciclastic rocks. (Strictly speaking, limestone refers to rocks consisting of >50% calcium carbonate.) Here, we simplified this classification to just two categories: “limestone” and “siliciclastic” (the latter being the calcareous plus non-calcareous categories in FRED), and used these data to calculate the proportion of limestone collections in each stage. Thus, lithological data associated with particular collections were used as a proxy for the immediate substrate habitat occupied by a particular species at a given site as well as to characterize the regional extent of carbonate deposition.
Second, for each stage, we tabulated the number of 1:50,000 topographical map sheets that are represented by fossil collections with known lithology, and calculated the proportion of these map sheets that contain at least one limestone collection. This measure provides a simple proxy for the regional geographic extent of limestone in each stage.
For each measure of carbonate extent, we calculated uncertainties as conventional binomial standard errors: SE=(p[1−p]/n)0.5, where p is the observed proportion and n is the sample size. The one exception is that, for a very small number of cases in which p=0 or p=1, we used the Wilson confidence interval (Agresti and Coull Reference Agresti and Coull1998: eq. 2) for z=1 and treated one-half this interval as an approximation of the standard error (Table A1). In Figure 1A, where this is relevant, we plot the full confidence interval.
Species sampling probability (A) and distribution of limestone (B, C) in the New Zealand Cenozoic shelf fossil and stratigraphic records. Divisions on the abscissa are international series (Gradstein et al. Reference Gradstein, Ogg, Schmitz and Ogg2012) and series of the New Zealand geological timescale (Hollis et al. Reference Hollis, Beu, Crampton, Jones, Crundwell, Morgans, Raine and Boyes2010). Stages with widespread carbonate deposition are shaded gray. All panels show plus or minus one standard error, except as noted in Materials and Methods. A, Per-stage sampling probability calculated separately for calcitic and aragonitic species. B, Proportion of limestone collections in the FRED data set. C, Proportion of sampled 1:50,000 map sheets containing at least one limestone collection. Stages when calcitic taxa are better sampled than aragonitic taxa tend to be those with widespread carbonate deposition.

We are interested in the regional and local (bed-scale) effects of carbonate substrate on the distribution and sampling of species, but also on the broader environmental impacts of widespread carbonate deposition. To examine this, we identified two intervals of time during which deposition and sampling of shelfal limestones were relatively extensive: latest Eocene to earliest Miocene (34.6 Ma–21.7 Ma) and Pliocene to early Pleistocene (5.3 Ma–1.63 Ma) (Fig. 1). These designations were based on proportions of limestone collections and of map sheets containing limestones (Table A1), but were also informed by our knowledge of New Zealand’s geological history. These carbonate-rich intervals were used to test the idea that times conducive to carbonate formation might have influenced the species composition of collections, whether original or preserved, irrespective of the substrate type occupied by a particular species.
Limestone formations are present outside these carbonate-rich intervals, but many of these other occurrences are of limited geographic and volumetric extent and/or were deposited at water depths of >200 m (Kamp and Nelson Reference Kamp and Nelson1988), and they have had a relatively small influence on the preserved shelfal macrofossil record (Fig. 1). We note that the Runangan Stage (36.4 Ma–34.6 Ma) arguably could be included in the older of the two carbonate-rich intervals, but we have not done so because it is poorly sampled and measurements are subject to large uncertainties. We acknowledge that the two carbonate-rich intervals identified represent times of very different regional paleogeographic and tectonic regimes. The older interval represents peak first-order transgression during the latter stages of passive-margin subsidence of the Zealandian continent, during which temperate limestone was deposited over much of the now-exposed New Zealand landmass (King et al. Reference King, Naish, Browne, Field and Edbrooke1999). In contrast, Plio-Pleistocene limestones were deposited in a range of active tectonic settings related to the modern Australia-Pacific plate boundary (Kamp and Nelson Reference Kamp and Nelson1987, Reference Kamp and Nelson1988; Beu Reference Beu1995; Caron and Nelson Reference Caron and Nelson2009). Despite these differences, if the two intervals are treated separately in our analyses, principal results and conclusions remain the same (results not shown here).
Regional and Local Sampling Statistics
Per-stage sampling probability (R) is the average probability that any species ranging through an entire stage has been sampled and recorded at least once from that stage. We estimated R separately for aragonitic and calcitic species using the standard gap statistic of Paul (Reference Paul1982), as modified by Foote and Raup (Reference Foote and Raup1996). Because pre-middle Eocene data are sparse, R is reported only for post-40 Ma (late Middle Eocene) faunas.
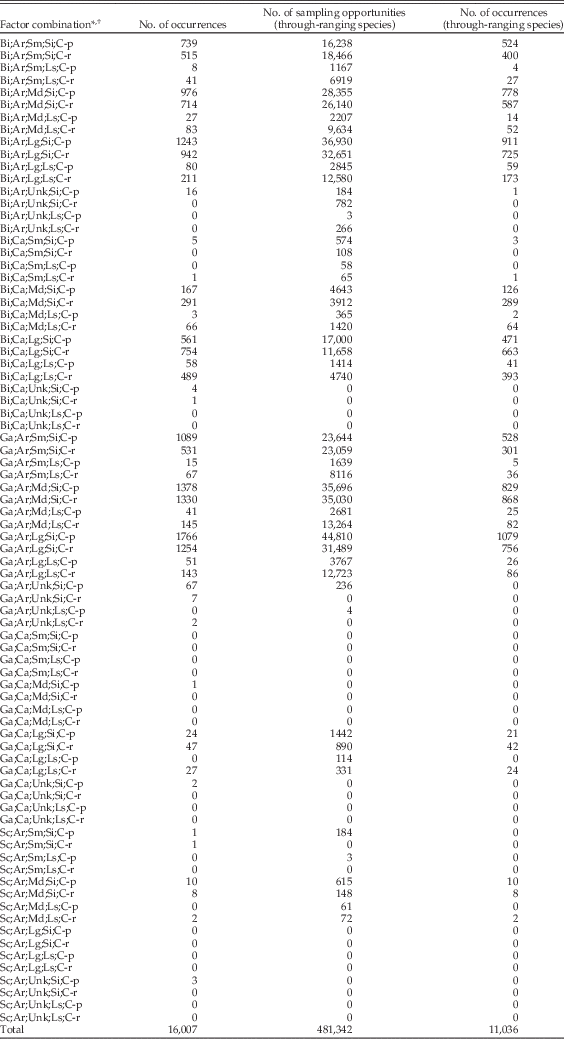
To compare regional and local scales and to test for ecological and taphonomic effects, we need to examine occurrences collection by collection. Thus, for each collection in each stage, we tabulated the presence or absence of every species that first appears before that stage and last appears after the stage. The number of species-by-collection combinations represents the total number of sampling opportunities for a given stage. For each opportunity, we scored an indicator variable, R coll, equal to 0 if the species is absent from the collection and 1 if it is present. In contrast to the net per-stage sampling probability, this approach analyzes sampling on a per-collection basis and therefore implicitly factors out the effects of uneven sampling between stages. In total, there are about 480,000 species-by-collection combinations in our data set, for all stages extending back to the base of the Cenozoic. Our approach tacitly assumes that biogeographic sampling failure (i.e., differential sampling of species reflecting variation in geographic range) will be stochastically uniform with respect to shell mineralogy and size, an assumption we discuss below. For each sampling opportunity, we also tabulated lithology as a proxy for substrate type, assignment to carbonate-poor or carbonate-rich intervals (irrespective of whether the enclosing rock of any particular fossil collection was limestone or siliciclastic sediment), shell mineralogy of the species, and shell size. R coll data are summarized in Table A2.
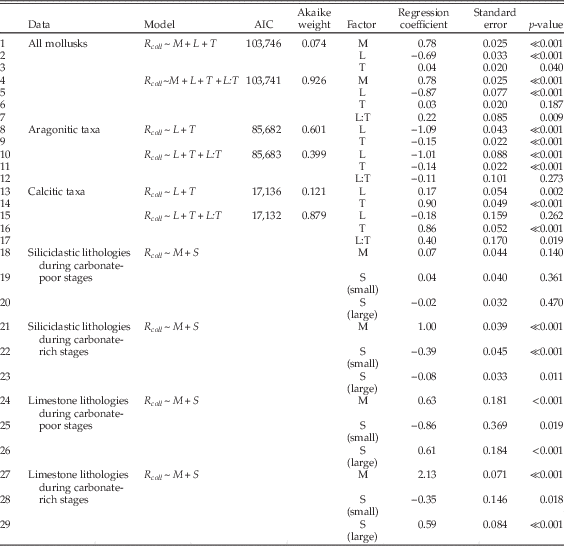
To examine relationships between per-collection sampling, shell mineralogy, substrate type, and limestone-rich intervals, we used multiple logistic regression, coding R coll as the response variable and the other factors as predictor variables. In interpreting the results (Table 1), note that calcitic mineralogy is compared with aragonitic, so that a positive regression coefficient implies greater odds of sampling of calcitic taxa. Likewise, other regression coefficients reflect the log odds ratio of sampling in limestones versus siliciclastic lithologies, and carbonate-rich versus carbonate-poor time intervals. For shell size, both small and large shells are compared with medium shells, so that there is an implicit ordering in this three-state variable. For various partitions of the data, we tested a range of models of increasing complexity. Although we examined a number of models involving interactions between factors, we restricted interaction terms to those that are relatively simple. Thus, we examined the interaction between lithology and carbonate-rich times to test whether, say, preservation in limestones was enhanced or diminished during times of widespread carbonate deposition on the shelf. We are interested primarily in effect sizes, assessed using the estimates of regression coefficients, but we also cite AIC values and Akaike weights as aids to model selection. For simplicity, many models that are uninformative or essentially duplicate other results are not reported.
Results of multiple logistic regression. In all models, R coll=indicator variable showing whether species is (1) or is not (0) found in a given collection, M=shell mineralogy (aragonite, calcite), S=shell size (small, medium, large; analyses presented for small and large species relative to medium), L=collection lithology (siliciclastic, limestone), T=incidence of shelf carbonate (carbonate-poor, carbonate-rich). L:T indicates a non-additive interaction between the factors. Data from Table A2.
Because regional and local sampling statistics are based on the presence or absence of species with first appearance before a given stage and last appearance after that stage, only the 625 species with a range of three or more stages, accounting for 11,036 occurrences in 2426 collections, are included in these analyses. If we compare the total occurrence count in Table A2 for each combination of factors (class, mineralogy, size, and so on) with the count for this longer-ranging subset of species, the two track each other very well (Spearman rank-order correlation coefficient: 0.96; p ≪ 0.001).
All analyses were carried in R, version 2.14.1 (R Development Core Team 2011).
Results
Regional, Stage-level Analyses
Figure 1A shows time series of per-stage sampling probabilities (R) for aragonitic and calcitic mollusk species. This reveals times when calcitic taxa have much higher sampling probabilities than aragonitic species, supporting the notion of profound relative bias, and other times when sampling probabilities are approximately equal and bias is not evident. The potential significance of this observation, in terms of macroevolutionary or macroecological inference, is illustrated quite simply by changes in the relative frequency of gastropods and bivalves through time. Given that shelf-dwelling gastropod species are almost entirely aragonitic (99.3%) whereas 15% of bivalves are calcitic, it stands to reason that periods of time with better sampling of aragonitic taxa should have a higher proportion of gastropod species and occurrences (Fig. 2). The Spearman rank-order correlation between time series of (R calcite − R aragonite ) and the proportion of sampled species that are gastropods is equal to −0.63 (one-tailed p=0.0025); for occurrences the correlation is equal to −0.80 (one-tailed p≪0.001); for genera it is equal to −0.63 (one-tailed p=0.002). Thus a substantial part of the temporal variation in relative representation of gastropods in the record is potentially explained by changes in the sampling probabilities of aragonitic and calcitic taxa. The difference in sampling depicted in Fig. 1A is not merely a reflection of the relative representation of bivalves and gastropods, however, for we see the same pattern within bivalves (Fig. A1).
Difference in per-stage sampling probability (R) for calcitic versus aragonitic species (from Fig. 1A), plotted against proportion of taxa and occurrences that are gastropods versus bivalves. Error bars are plus or minus one standard error; for the ordinate this is the binomial standard error; for the abscissa it is estimated as [SE(R calcite)2+SE(R aragonite)2]0.5. Stages with better sampling of aragonitic species tend to have a higher proportion of gastropods.
Times of relative bias against aragonitic fossils correspond broadly to times when limestone is both more widespread and highly sampled (Figs. 1, 3, A2). Taken at face value, these patterns support the inference that aragonite dissolution is particularly pervasive in New Zealand temperate carbonate settings, but it is essential to test this inference explicitly by analyzing collection-level data. It is also possible that the results reflect ecological preferences of different species, either aversion of aragonitic taxa to environments that are widespread during carbonate-rich intervals or affinity of calcitic taxa for such environments. This possibility too must be explored at the level of individual collections, to which we now turn.
Difference in per-stage sampling probability (R) for calcitic versus aragonitic species (from Fig. 1A), plotted against proportion limestone collections (from Fig. 1B). Error bars are plus or minus one standard error; for the abscissa this is the binomial standard error; for the ordinate it is estimated as [SE(R calcite)2+SE(R aragonite)2]0.5. Consistent with Fig. 1, the spatial extent of carbonate deposition predicts the difference between calcite and aragonite sampling probabilities.
Local, Collection-level Analyses
Results of the logistic regressions are shown in Table 1. In the following discussion, specific inferences are cross-referenced to key regression models by line number in the table. When interpreting this table, effect sizes can be gauged from the magnitude of regression coefficients, and relative model fits can be assessed using Akaike weights. Positive or negative coefficients indicate positive or negative regression relationships for the second factor state relative to the first. For example, in line 1, the regression coefficient is 0.78, indicating that sampling of calcitic species is favored relative to sampling of aragonitic species. Specifically, the odds of sampling calcitic taxa are exp(0.78)=2.2 times as high as the odds of sampling aragonitic taxa; this relationship is statistically significant (p≪0.001).
Models including all data support the regional- and stage-scale interpretation of bias against aragonitic shells and in limestones (lines 1, 2, 4, 5), but indicate somewhat better sampling overall from limestones deposited during carbonate-rich times (line 7). This last result shows a statistical interaction; there is a combined effect of limestone lithology during carbonate-rich times that surpasses the additive effects of the two factors. The Akaike weights also indicate better support for the model with the interaction term. Looking just at aragonitic taxa, we find strong bias against sampling in limestones, and a comparatively modest effect of carbonate-rich intervals (lines 8–12). In other words, presence of aragonitic taxa is influenced much more by the immediate substrate than by abundant carbonate in the wider environment. Calcitic taxa, on the other hand, are mainly affected by the nature of the wider environment and are relatively better sampled during carbonate-rich times (lines 13–17). Calcitic taxa also seem to drive the interaction between limestone lithology and carbonate-rich intervals (lines 7, 17).
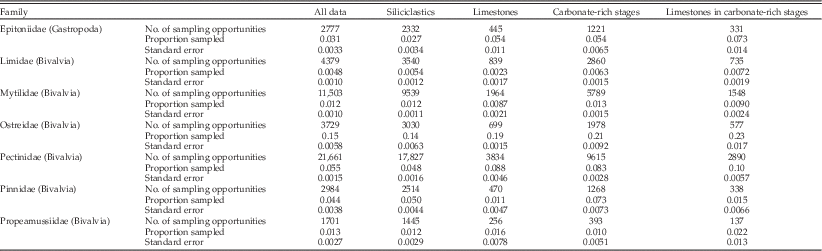
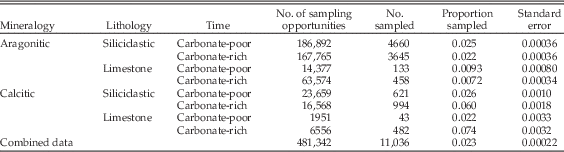
The regression coefficients pertain to relative odds of sampling, for example of calcitic versus aragonitic taxa. To put these into context, it helps to examine absolute sampling proportions as well (Table 2). These show that for several partitions of the data there is a characteristic sampling rate similar to the overall rate of about 2.3% per species per collection. Aragonitic species, however, stand out for having low sampling rates in limestones, during both carbonate-poor and carbonate-rich times, but slightly lower in the latter. Calcitic taxa stand out for having higher sampling rates during carbonate-rich times, an effect that is enhanced in limestones. Thus the inferences based on relative odds are consistent with the absolute sampling proportions.
Absolute sampling rates for mollusks partitioned by shell mineralogy, lithology, and carbonate-rich versus carbonate-poor time intervals.
We emphasize again that sampling is analyzed here at the level of individual collections. Thus, for example, the per-species, per-collection sampling rate in limestones need not be higher in carbonate-rich stages simply because there are more limestones during those stages.
Next we partitioned the data by lithology and general environment and included shell size as a factor. Remarkably, for siliciclastic sediments deposited during carbonate-poor times, neither shell mineralogy nor size significantly biases the odds of sampling (Table 1: lines 18–20). In marked contrast, there is apparently a significant bias against aragonitic taxa in both siliciclastic lithologies deposited during carbonate-rich times and in limestone deposited at any time (Table 1: lines 21, 24, 27). However, looking at the absolute sampling rates (Table 2), we see that the relatively low odds of sampling aragonitic taxa in clastic lithologies during carbonate-rich times are primarily caused by enhanced sampling of calcitic taxa rather than reduced sampling of aragonitic forms. Thus, there is effectively no sampling bias against aragonitic taxa in siliciclastic lithologies.
Finally, there is a bias against small- and medium-sized shells, relative to large, in limestones (Table 1: lines 25–26, 28–29), and bias against small mollusks in siliciclastic lithologies during carbonate-rich intervals (Table 1: line 22). The preservational bias against smaller sizes is consistent with previous work on Cenozoic mollusks of New Zealand (Cooper et al. Reference Cooper, Maxwell, Crampton, Beu, Jones and Marshall2006) and with suggestions of a more general size-related bias in mollusks (Kidwell and Bosence 1991; Cherns and Wright Reference Cherns and Wright2011).
Discussion
In analyzing the factors that contribute to species sampling, we have assumed that biogeographic sampling failure does not vary systematically with salient factors such as shell composition, but this assumption could be violated if aragonitic or calcitic taxa had larger geographic ranges on average. To test this assumption, we examined the geographic ranges of living mollusks around New Zealand. Using maximum great-circle distance as a measure of geographic range and ignoring 26 species recorded from a single occurrence, we find that there is a modest difference in the geographic ranges of aragonitic and calcitic taxa of about 16%: the 25 calcitic taxa have a median range of 1573±115 km, and the 284 aragonitic taxa have a median range of 1325±43 km (median plus or minus one standard error, based on bootstrap resampling). These estimates must be regarded as provisional because of sampling biases that are particular to the living fauna and will not affect our fossil data. For example, 83% of the occurrences are from the water depth range of 0–100 m and only 17% are from the outer half of the shelf depth range; this reflects the relative ease of sampling in shallow water. Similarly, there is relatively sparse sampling of some sectors of the shelf, in particular off the northwestern South Island and part of the western North Island. Taken at face value, the biogeographic bias in the living fauna is small compared to the mineralogical effect sizes documented in the fossil record (Table 1) and is therefore unlikely to dominate these effects. Most importantly, we know from the fossil record that there are times when no bias can be detected (Table 1: lines 18–20; Table 2), which indicates that any significant shell-composition-related biogeographic effects are not a persistent feature of the fauna.
Similarly, locality data on living mollusks do not support the idea that geographic range varies systematically with body size in a way that is likely to produce the sampling results we have documented. Small, medium, and large species have median ranges of 1324±98 km, 1087±122, and 1387±80 km, respectively. One of the main effects we document is that small species have lower odds of sampling than medium or large species (Table 1: lines 21–29), a result that would not be predicted from the larger geographic ranges of small versus medium species or the nearly identical ranges of small versus large species.
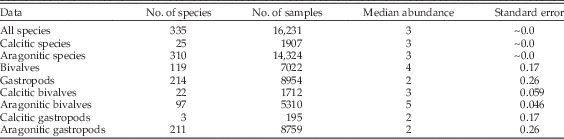
One factor that is likely to be important but for which we do not have data from the fossil collections is numerical abundance; all else being equal, we would expect more-abundant species to have better chances of sampling. To test for systematic differences in abundance between groups of mollusks, we extracted specimen counts from samples of living mollusks and tabulated the median number of specimens per species per sample (Table 3). We find no appreciable difference between the median abundance of calcitic versus aragonitic species; both medians are equal to 3 (two-tailed Wilcoxon test: p=0.572). Thus, if these abundances are representative of calcitic and aragonitic species in general, we infer that the effects of mineralogy documented herein do not simply reflect underlying effects of abundance. In fact, if we focus on bivalves, within which both mineralogies are well represented, we see that aragonitic taxa are more abundant (Table 3). All else being equal, this would predict better sampling of aragonitic taxa in the fossil record, quite the opposite of what we find.
Abundances of living mollusks, per species per sample, from the Te Papa database. Standard error of median based on bootstrap resampling of the samples.
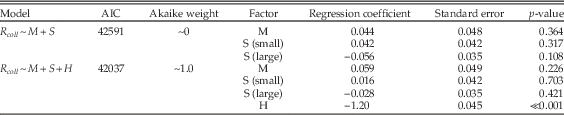
Lithification can reduce the chances of recovering fossil material from a sample and affect the body-size distribution of recovered shells (e.g., Koch and Sohl Reference Koch and Sohl1983; Hendy Reference Hendy2009; Sessa et al. Reference Sessa, Patzkowsky and Bralower2009). It seems unlikely a priori that lithification exerts a major control on our results, simply because so few collections come from unlithified sediments prior to the Nukumaruan stage (2.4 Ma) (Crampton et al. Reference Crampton, Foote, Beu, Maxwell, Cooper, Matcham, Marshall and Jones2006a: Fig. 5). We can nonetheless assess the effects of lithification on sampling by considering the subset of collections (~82%) that have information on degree of induration, coded in FRED as unconsolidated, moderately soft, moderately hard, and hard, but bearing in mind that these categories have probably not been applied consistently by collectors. For siliciclastic lithologies, the four categories account for 5.8%, 64.4%, 22.9%, and 6.9% of the collections, respectively. For limestones, the corresponding figures are 2.4%, 29.1%, 39.0%, and 29.4%. Although limestones are more heavily indurated on average, lithology and the other factors we have shown to influence sampling are not mere proxies for lithification. We can see this by repeating regression analyses with lithification as an additional factor (Tables A3–A8). These regressions show that lithification, as expected, reduces the odds of sampling, and that models including lithification as a factor generally have substantially better fit. The effects of other factors are about the same, however, regardless of whether lithification is included in the regressions. In these analyses, we have treated lithification as a binary factor, contrasting unconsolidated sediments with all other categories, but we attain similar results (not shown) if we contrast unconsolidated plus moderately soft samples with moderately hard plus hard samples, or if we consider all four categories as distinct levels of an induration factor.
There are of course other controls on sampling that we have not considered, including sequence-stratigraphic context. Limestone formation in the study system is influenced by a complex interplay of eustatic sea level, tectonic setting, sediment supply, current regime, and availability of hard substrates for bioclast producers (Nelson Reference Nelson1978; Kamp and Nelson Reference Kamp and Nelson1987, Reference Kamp and Nelson1988; Beu Reference Beu1995). We have previously documented higher per-species sampling probabilities around the middle of second-order cycles (Crampton et al. Reference Crampton, Foote, Beu, Cooper, Matcham, Jones, Maxwell and Marshall2006b), but sequence-stratigraphic control will also likely be important at temporal scales finer than those we can document with our stage-level data.
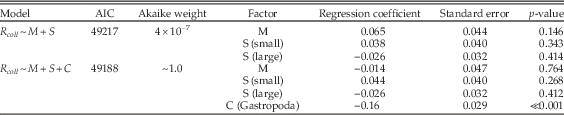
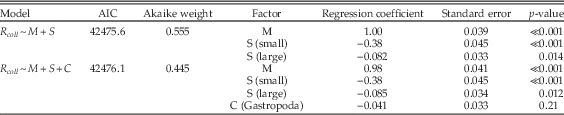
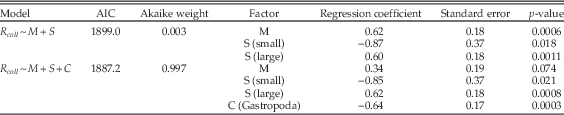
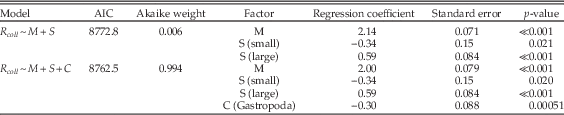
Although not central to our study, our data allow additional analyses bearing on the relative representation of bivalves and gastropods (Fig. 2). We carried out a further logistic regression, using only gastropods and bivalves and adding class as a factor to the results shown on lines 4–7 of Table 1. The results (Table A9) show that gastropod species have odds of sampling at the collection level about 11% lower than bivalves and that adding class membership to the regression yields a model with substantially better support. Body size is also correlated with class membership; the median size of bivalves (32.5 mm) is significantly larger than that of gastropods (17 mm) (Wilcoxon test: p≪0.001). We therefore added class as a factor to the regressions that partitioned data by lithology and time interval and included body size (see Table 1: lines 18–29). In all four cases, sampling odds are lower for gastropods even when the effects of mineralogy and size are taken into account (Tables A10–A13). In three cases, the regression coefficient for class membership is statistically significant, and adding class as a factor leads to a substantial increase in support. At this point we do not know definitively why, all else being equal, gastropods have lower odds of sampling, but it is reasonable to put forth lower abundance as a live hypothesis: the same data on living species used to compare aragonitic and calcitic taxa show that bivalves have twice the average abundance as gastropods per species per locality (Table 3) (two-tailed Wilcoxon test: p≪0.001). This difference stands to reason given that gastropod species in our data are largely within carnivorous trophic guilds, whereas bivalves are mainly filter feeders (Crampton et al. Reference Crampton, Cooper, Beu, Foote and Marshall2010: p. 213). The database on abundances does not include the relative numbers of articulated and disarticulated bivalves, which would be necessary to estimate how many individuals are represented by a given number of shells. It is likely that the count of bivalves needs to be adjusted downward (Gilinsky and Bennington Reference Gilinsky and Bennington1994; Kowalewski et al. Reference Kowalewski, Gürs, Nebelsick, Oschmann, Piller and Hoffmeister2002), but only the most pessimistic assumptions would lead us to divide the bivalve counts in half and conclude that bivalves and gastropods are equally abundant.
Our emphasis here has been on whether taxa are sampled within an interval during which they are known to have existed. We previously suggested (Crampton et al. Reference Crampton, Foote, Beu, Maxwell, Cooper, Matcham, Marshall and Jones2006a) that, because the proportion of aragonitic taxa does not trend markedly, aragonite loss does not shape the long-term biodiversity trajectory of Cenozoic mollusks in New Zealand. Our present conclusions differ from those of Crampton et al. (Reference Crampton, Foote, Beu, Maxwell, Cooper, Matcham, Marshall and Jones2006a: Fig. 5) because the earlier study did not specifically examine relative differences in sampling probabilities of aragonitic and calcitic taxa, and data were displayed only as the overall proportion of aragonitic taxa, a presentation that unfortunately mutes the signals described in the present study. We note, however, that Figure 5 of Crampton et al. (Reference Crampton, Foote, Beu, Maxwell, Cooper, Matcham, Marshall and Jones2006a) does reveal variation in the proportion of aragonitic species that is consistent with the patterns of sampling probability shown in the present study (Figs. 1A, 2). In particular, the difference between calcitic and aragonitic sampling probabilities (Fig. 2) is a strong predictor of the proportion of aragonitic species sampled in a stage (Crampton et al. Reference Crampton, Foote, Beu, Maxwell, Cooper, Matcham, Marshall and Jones2006a: Fig. 5) (Spearman r=−0.79, p≪0.001).
On the whole, the effects of aragonite sampling bias in New Zealand mollusks are consistent at the scale of spatiotemporally localized collections and at the regional- and stage- scales. Stage-level sampling probabilities (Fig. 1) suggest that aragonite bias is most pervasive during times of widespread carbonate deposition, and analysis of collection-level data (Table 1) supports this inference. The analysis of sampling at the collection scale, however, allows us to resolve the nature of bias in this system in more detail and to quantify the components of bias. In particular:
1. Mollusks living on siliciclastic substrates experience no significant sampling bias against aragonitic taxa.
2. There is a strong bias against aragonitic mollusks living on carbonate substrates; judging from the effect during carbonate-poor stages, this bias reduces the odds of sampling aragonitic taxa by about one-half (Table 1: line 24). This result is expected and was predicted by earlier studies at both temperate and tropical latitudes (e.g., Nelson Reference Nelson1978; Brachert and Dullo Reference Brachert and Dullo2000; Kidwell et al. Reference Kidwell, Best and Kaufmann2005; Best et al. Reference Best, Ku, Kidwell and Walter2007; Best Reference Best2008).
3. There is also a bias in favor of calcitic taxa, regardless of substrate and in addition to effects of lithology per se, during times of widespread limestone deposition; judging from the effect in clastic lithologies, this bias increases the odds of sampling calcitic taxa by ~170% (Table 1: line 21). Effects (2) and (3) combine to give odds of sampling calcitic taxa during limestone-rich intervals that are ~8 times as high as for aragonitic taxa (Table 1: line 27).
4. Relative to medium-sized mollusks, there is significant bias against small and for large mollusks in limestones, and bias against small taxa in siliciclastic lithologies deposited during carbonate-rich intervals. The size bias decreases the odds of sampling small mollusks by ~30% to ~60% and increases the odds of sampling large mollusks by ~80% (Table 1: lines 22, 25, 26, 29).
5. Gastropods are somewhat more poorly sampled than bivalves, even when we account for mineralogy and body size, a result that likely reflects lower numerical abundance. This last effect is generally small relative to the effect of shell composition (Table A9).
The preference of calcitic taxa for carbonate-rich times in general, not just for limestones, is an unexpected result. The higher absolute sampling rates of calcitic taxa, rather than reduced rates for aragonitic taxa (Table 2), point to an original ecological preference rather than a taphonomic effect. We can gain some insight into the ecological effect by looking at sampling rates of calcitic taxa family by family (Table 4). Weighing the sampling rates with the number of opportunities for sampling, it appears that the bivalve families Ostreidae and Pectinidae are the dominant contributors. This stands to reason given that widespread oyster banks and oyster-pecten-barnacle associations are known to be major features of the carbonate-rich intervals (Nelson Reference Nelson1978; Beu Reference Beu1995). More generally, Nelson (Reference Nelson1978: p. 758) reported a dominance of epifaunal versus infaunal bivalves in New Zealand Cenozoic limestones. Again we emphasize, however, that it is not simply limestones per se but carbonate-rich times more broadly that account for the higher sampling rates of calcitic taxa (Tables 1, 2). Mytilidae, which we have categorized as calcitic on account of their mixed mineralogy, have low sampling rates overall but especially in limestones. These results make sense in light of the generally high aragonitic component in this family (Carter Reference Carter1990b). High sampling rates of epitoniids partly reflect the fact that the Cenozoic record of calcitic gastropods in New Zealand is dominated by Cirsotrema, whose species are mainly large-bodied
Sampling statistics for principal calcitic families.
.
The general agreement we find between local- and regional-scale aragonite bias stands in contrast to recent studies reporting that aspects of shell durability for marine brachiopods, bivalves, and gastropods, as recorded in the Paleobiology Database, do not consistently and positively predict frequency of occurrence or temporal trends in occurrence (Behrensmeyer et al. Reference Behrensmeyer, Fürsich, Gastaldo, Kidwell, Kosnik, Kowalewski, Plotnick, Rogers and Alroy2005; Kosnik et al. Reference Kosnik, Alroy, Behrensmeyer, Fürsich, Gastaldo, Kidwell, Kowalewski, Plotnick, Rogers and Wagner2011). These studies differ from ours in three salient ways: in them, occurrence data were aggregated at the genus level, data were global in scope, and time intervals were longer than the stages we have used. These differences all tend in the same direction—toward increasing redundancy in the data, evening out temporal and spatial variation in sampling, and therefore mitigating the effects of compositional and structural bias. Given that we see some similar results at the genus and species level (Fig. 2) and that times of extensive limestone formation extend for several stages, we tentatively suggest that expanding from the regional to the global scale—where, in particular, spatial variation in carbonate versus clastic extent should be evened out—may have more of an effect than aggregating data at coarser taxonomic or temporal scales.
Our study has successfully linked the local scale with the regional scale, uncovering underlying reasons for regional-scale bias that could not have been detected without the finer-scale analysis. Likewise, dissecting the Paleobiology Database into subsets of regional species pools that are stratigraphically well-defined may bring us closer to documenting relationships between regional and global patterns and therefore to understanding the complexity of sampling at a hierarchy of scales.
Conclusions
Our key finding is that, among Cenozoic mollusks of New Zealand, the occurrence of aragonitic versus calcitic taxa reflects an interplay of both diagenetic loss of aragonite and original ecology. Specifically, whereas there is no bias against aragonitic taxa in siliciclastic lithologies, calcitic taxa are preferentially favored both in limestones and in carbonate-rich environments regardless of lithology. The former preference reflects preservational bias and doubles the sampling odds of calcitic taxa relative to aragonitic. The latter reflects original ecology and increases calcitic sampling odds by a factor of nearly three. In limestones deposited during carbonate rich times, the sum of these effects plus their interaction yields odds of sampling that are eight times as high for calcitic taxa.
If our results hold more generally, they imply that, with respect to aragonite dissolution, unbiased data on faunal composition at the local and regional scale in temperate settings can be extracted from dominantly siliciclastic marine rock records, whereas fossil assemblages from carbonate-rich settings must be interpreted with caution because of the conflation of ecological signals and taphonomic bias.
Our results allow us to draw a number of other conclusions. Data from living species yield no evidence for a systematic difference in numerical abundance between calcitic and aragonitic taxa, suggesting that mineralogy is not an alias for abundance. We do, however, find that gastropod species have median abundances about one-half as high as those of bivalves; this difference may help explain the result that, even controlling for shell mineralogy and body size, fossil gastropods have lower sampling rates than fossil bivalves. The general agreement we find between regional and local preservational effects complements recent studies at the genus level and global scale showing that shell composition is not an overriding factor in patterns of taxonomic occurrence. For the questions addressed here, we suggest that the difference between regional and global scales is more important than that between the species and genus levels or between shorter (~stage) and longer (~series) time scales.
Acknowledgments
We acknowledge use of data contained in the New Zealand Fossil Record File Electronic Database (FRED: http://www.fred.org.nz/); data were downloaded on 29 April 2012. For assistance in the data download, we thank R. Thomas. We also acknowledge the use of data on the distribution of living mollusks around New Zealand, which were kindly provided by B. A. Marshall at the Museum of New Zealand Te Papa Tongarewa, Wellington. For discussion and advice we thank D. Jablonski, S. M. Kidwell, N. D. Pierrehumbert, F. M. Richter, K. A. Ritterbush, P. D. Smits, M. Villarosa Garcia, and J. Walkowicz. S. M. Kidwell and K. A. Ritterbush kindly read the manuscript. A. M. Bush, S. Finnegan, and M. A. Kosnik provided helpful reviews. J. S. C. acknowledges funding from the University of Chicago to support visits to that institution, and M. F. acknowledges support from NASA Exobiology (NNX10AQ44G).
Appendix
Lithologic and taxonomic sampling statistics.
Summary of collection-level occurrence data.
Multiple regression results using only aragonitic taxa and comparing the model of Table 1 (lines 8–9) with one that also includes lithologic hardness (H) as a factor (unconsolidated versus moderately soft, moderately hard, and hard).

Multiple regression results using only calcitic taxa and comparing the model of Table 1 (lines 15–17) with one that also includes lithologic hardness (H) as a factor (unconsolidated versus moderately soft, moderately hard, and hard).
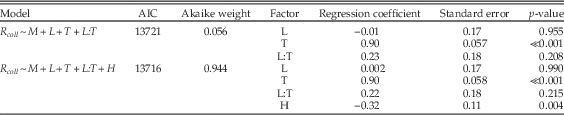
Multiple regression results using only siliciclastic lithologies during carbonate-poor stages, and comparing the model of Table 1 (lines 18–20) with one that also includes lithologic hardness (H) as a factor (unconsolidated versus moderately soft, moderately hard, and hard).
Multiple regression results using only siliciclastic lithologies during carbonate-rich stages, and comparing the model of Table 1 (lines 21–23) with one that also includes lithologic hardness (H) as a factor (unconsolidated versus moderately soft, moderately hard, and hard).
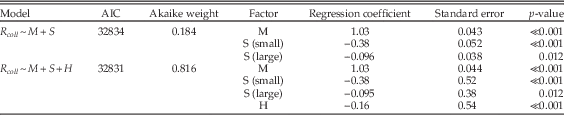
Multiple regression results using only limestone lithologies during carbonate-poor stages, and comparing the model of Table 1 (lines 24–26) with one that also includes lithologic hardness (H) as a factor (unconsolidated versus moderately soft, moderately hard, and hard).
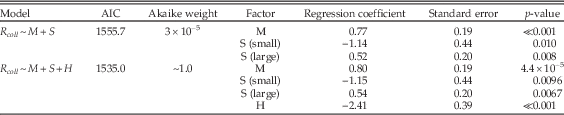
Multiple regression results using only limestone lithologies during carbonate-rich stages, and comparing the model of Table 1 (lines 27–29) with one that also includes lithologic hardness (H) as a factor (unconsolidated versus moderately soft, moderately hard, and hard).
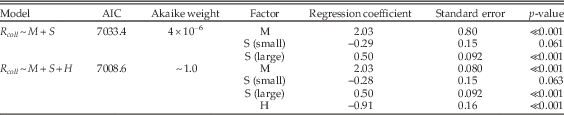
Multiple regression results using bivalves and gastropods only, and comparing the model of Table 1 (lines 4–7) with a model that also includes class (C) as a factor.
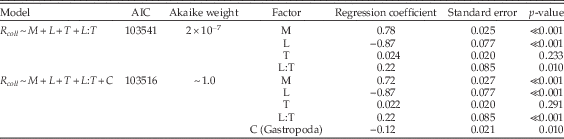
Multiple regression results using only bivalves, gastropods, and siliciclastic lithologies during carbonate-poor stages, and comparing the model of Table 1 (lines 18–20) with a model that also includes class (C) as a factor.
Multiple regression results using only bivalves, gastropods, and siliciclastic lithologies during carbonate-rich stages, and comparing the model of Table 1 (lines 21–23) with a model that also includes class (C) as a factor.
Multiple regression results using only bivalves, gastropods, and limestone lithologies during carbonate-poor stages, and comparing the model of Table 1 (lines 24–26) with a model that also includes class (C) as a factor.
Multiple regression results using only bivalves, gastropods, and limestone lithologies during carbonate-rich stages, and comparing the model of Table 1 (lines 27–29) with a model that also includes class (C) as a factor.
Difference in per-stage sampling probability for calcitic versus aragonitic bivalves (from Fig. A1), plotted against proportion limestone collections (from Fig. 1B). As indicated by Fig. A1, temporal variation in the difference between aragonitic and calcitic sampling transcends the difference in sampling between gastropods and bivalves.