Nanostructured materials typically possess superior mechanical properties compared with their bulk counterparts and thus are of great interest for the applied and fundamental scientific research. For example, Au nanopillars and nanowhiskers yield under uniaxial stress close to the theoretical strength at several GPa,[Reference Greer, Oliver and Nix1, Reference Sedlmayr, Bitzek, Gianola, Richter, Mönig and Kraft2] whereas bulk polycrystalline faced-centered cubic (fcc) metals yield at a few tens of MPa.[Reference Sanders, Eastman and Weertman3] These two very different examples constitute the boundaries of strength of a material. In between, strength values can scale with dimensions such as sample size or microstructural length,[Reference Kraft, Gruber, Monig and Weygand4, Reference Arzt5] a phenomenon that is known as the mechanical size effect.
In recent decades, the mechanical properties of small-scale materials, with dimensions well below 1 µm, have been intensively investigated using different nanomechanical tests, such as uniaxial deformation[Reference Peng, Zhan and Lou6] and bending.[Reference Schopf, Schamel, Strunk and Richter7] In this respect, monotonic uniaxial tensile or compression testing of cylindrical specimen geometries, such as pillars and whiskers, minimizes strain gradients and simplifies the interpretation of data. Supplementary insight into the influence of size effects on the deformation behavior is obtained by atomistic simulations.[Reference Bitzek8] Based on this research, it has been argued that the multiplication of dislocations becomes increasingly difficult in the submicrometer regime causing the size effect. To date, the behavior of nanoscale materials under cyclic load has only marginally been investigated. The data available include fatigue testing of different specimen geometries, e.g., nanocrystalline bulk materials,[Reference Agnew and Weertman9, Reference Witney, Sanders, Weertman and Eastman10] thin films,[Reference Schwaiger, Dehm and Kraft11] and microwires.[Reference Yang, Motz, Grosinger and Dehm12–Reference Hofbeck, Hausmann, Ilschner and Kunzi14] An overview is given in the literature.[Reference Zhang, Wang and Sih15, Reference Padilla and Boyce16] A common result of these studies is that nanostructured materials show an increased fatigue life, especially in the high-cycle regime. This can be related to their increased yield strength, which is typically accompanied by a reduced ductility.
Among the investigated materials, small-scale Cu is a focal point of interest, since Cu has been studied extensively as a bulk material with respect to fatigue, and it is a promising candidate for applications as interconnects due to its high electrical conductivity. Recent uniaxial tensile tests indicate a transition in the mechanical properties with decreasing sample size from a ductile behavior with little work hardening, to a brittle behavior.[Reference Peng, Zhan and Lou6, Reference Brenner17–Reference Richter, Hillerich, Gianola, Monig, Kraft and Volkert20] For smallest sample sizes even deviations in the deformation mechanisms may occur. For example, nanoscale mechanical experiments on Au show that stacking faults instead of full dislocations are the carriers of plastic deformation.[Reference Sedlmayr, Bitzek, Gianola, Richter, Mönig and Kraft2, Reference Kraft, Gruber, Monig and Weygand4, Reference Lee, Im, Yoo, Bitzek, Kiener, Richter, Kim and Oh21] Based on these observations, it is not clear how Cu nanowires behave under cyclic loading. In brittle materials, fatigue typically does not occur, whereas in ductile materials plastic deformation can accumulate leading to mechanical damage and failure. Cyclic deformation at loads close to the theoretical strength has not been investigated. This paper presents data from in situ tensile testing and fatigue tension–tension testing of Cu–Si nanowires in the GPa regime in order to assess the question if cyclic loads close to the theoretical strength can be sustained. Post-mortem transmission electron microscopy (TEM) was used in order to obtain insight in the microstructural evolution upon cyclic loading.
Cu–Si nanowires were prepared by physical vapor deposition of Cu under molecular beam epitaxy conditions. The Cu was deposited on Si substrates, which were covered by a C-layer. The substrate temperature was kept constant at ~600 °C. This temperature is sufficient for significant diffusion of Si into the Cu nanowires. Details about the fabrication process can be found in the literature.[Reference Richter, Hillerich, Gianola, Monig, Kraft and Volkert20, Reference Schamel, Schopf, Linsler, Haag, Hofacker, Kappel, Strunk and Richter22] The mechanical testing was carried out in a dual-beam focused ion beam/scanning electron microscope (SEM) workstation equipped with a gas injection system for depositing the Pt grips onto the specimens. The testing platform consists of three independently controlled piezo-actuators and a microforce sensor, which is capable of tracking forces in the nN range. Individual nanowires were harvested and transferred to the testing platform by the use of a nanomanipulator as described in literature.[Reference Boles, Sedlmayr, Kraft and Monig23, Reference Gianola, Sedlmayr, Monig, Volkert, Major, Cyrankowski, Asif, Warren and Kraft24]
The observation of the specimens in the SEM upon testing allows an in situ image-based strain measurement and the characterization of the fracture sites after the testing. The tensile tests were conducted at constant displacement rates, i.e., by increasing the piezovoltage until fracture and simultaneously tracking the force signal. The fatigue experiments were conducted at constant displacement rates and constant stress range. The first cycle was performed with the displacement being tracked by SEM imaging. Afterwards the frequency was increased to ~0.08–0.25 Hz. After a certain number of cycles, slow cycles were performed to monitor the deformation behavior in detail (see Supplementary material for details). After the mechanical testing, the specimens were investigated by TEM using an FEI Titan 80–300 operating at 300 kV, which is equipped with an energy-dispersive x-ray spectroscopy (EDX) detector for chemical analysis and a LEO922 OMEGA operating at 200 kV.
The Cu–Si nanowires tested contain ~7 at.% Si and consist of an fcc Cu(Si) solid solution as revealed by EDX and TEM analyses. Three individual nanowires were subjected to cyclic tension–tension loading in the stress range of 0.7–1.4, 0.2–0.7, and 0.3–1.0 GPa and sustained 2718, 17,493, and 18,302 cycles, respectively. The three tested specimens showed the same trends, which are illustrated by the results for “specimen 3”. The stress–strain plots of the selected fatigue cycles are shown in Fig. 1(a). These cycles were performed in situ, i.e., the strains were tracked by SEM. During the last cycle, the specimen was loaded beyond the upper stress level to induce fracture. For comparison, also the stress–strain curves of Cu–Si nanowires, which fractured upon their first monotonic loading, are shown. For all cases linear-elastic deformation is observed. The fatigued nanowire exhibits the highest tensile strength of roughly 1.4 GPa, while the strengths obtained from the monotonic tensile tests show significant scatter and lie below 1 GPa. After fracture, the force signal went back to ~0.1 µN which corresponds to a stress of ~6 MPa. This demonstrates the reliability of the force measurement.
Mechanical characterization: (a) Engineering stress σ versus engineering strain ε of a Cu–Si nanowire (“specimen 3”) upon cyclic loading. The experiment is load controlled. For comparison, monotonic tensile tests of pristine Cu–Si nanowires are shown. (b) Range of the piezovoltage versus cycle number. The piezovoltage correlates with the applied strain. The increased voltage range for given load range is due to a change in modulus as given on the right axis.

Although Young's moduli as determined in uniaxial testing scatter from wire to wire a clear decrease during fatigue was observed. In Figure 1(a) the modulus decreases from ~85 to ~68 GPa from the 501st to the 8150th cycle. The curves are linear and do not show a hysteresis or any other indication for inelastic behavior or fatigue damage. The decrease in stiffness is reflected in the applied amplitude of the piezovoltage. This voltage corresponds to the applied displacement and since the experiments are performed with constant force amplitudes, the increase in displacement amplitude indicates a decrease in stiffness [see Fig. 1(b)].
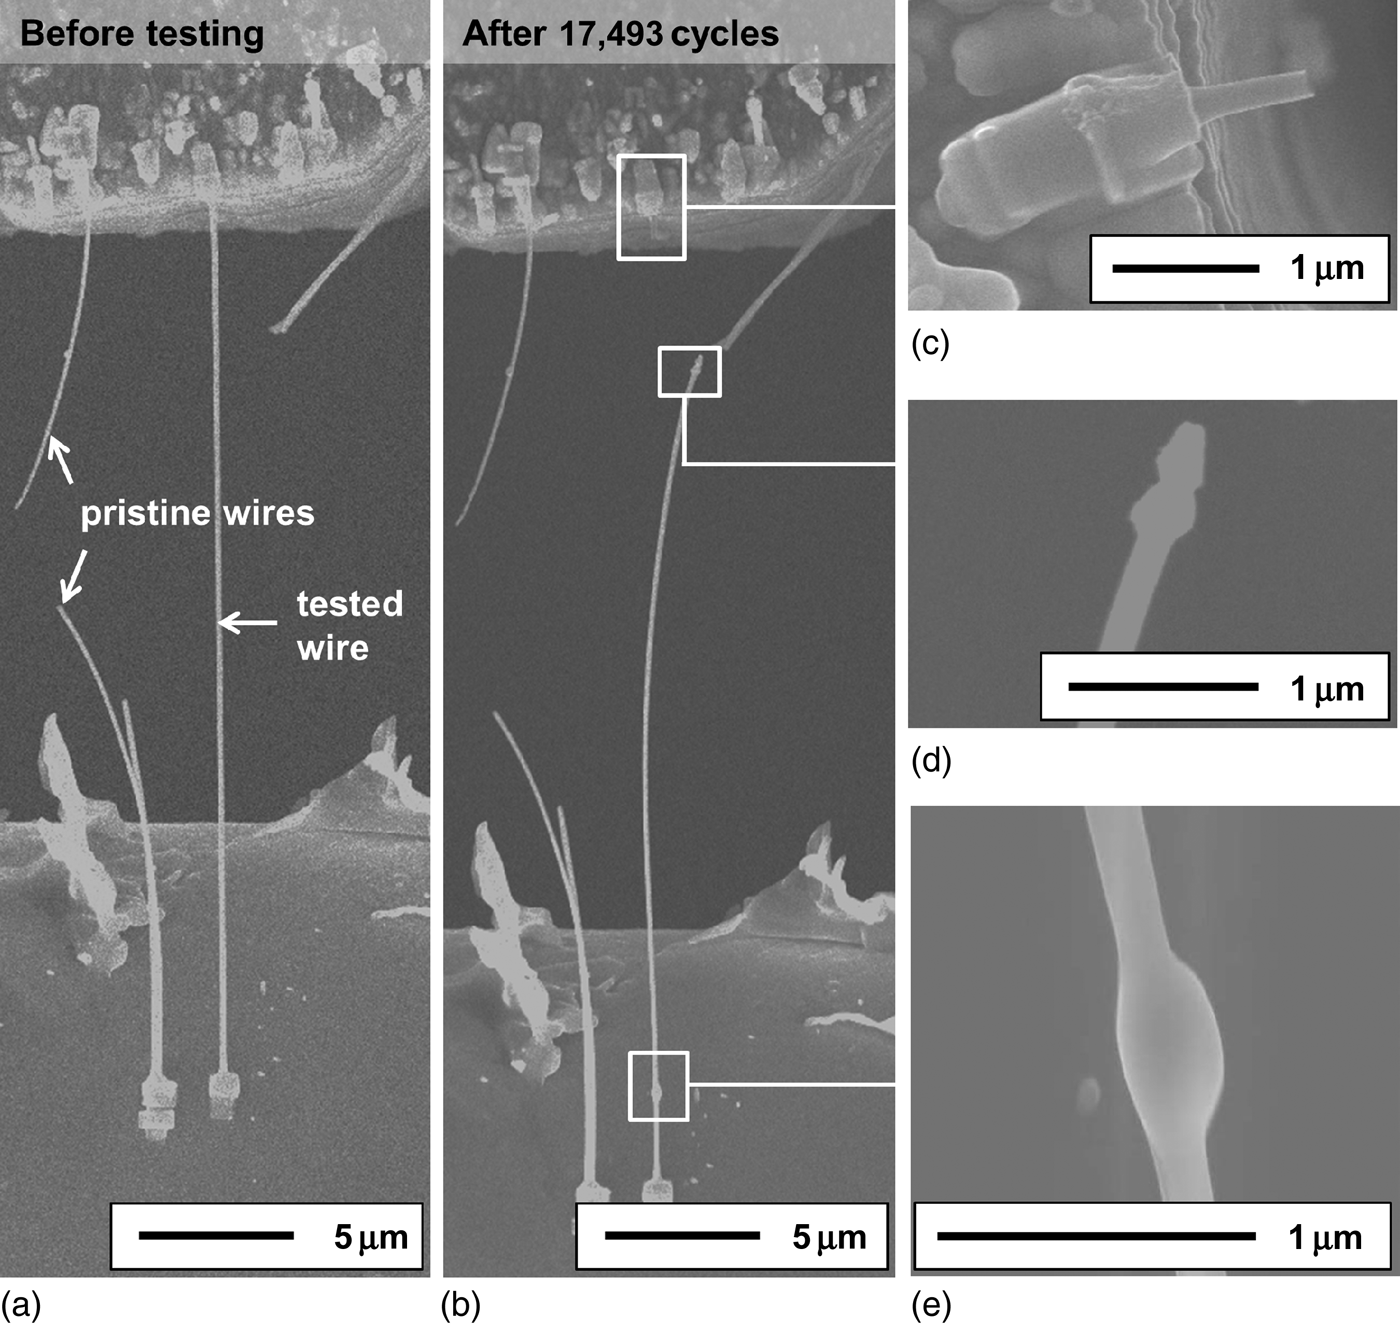
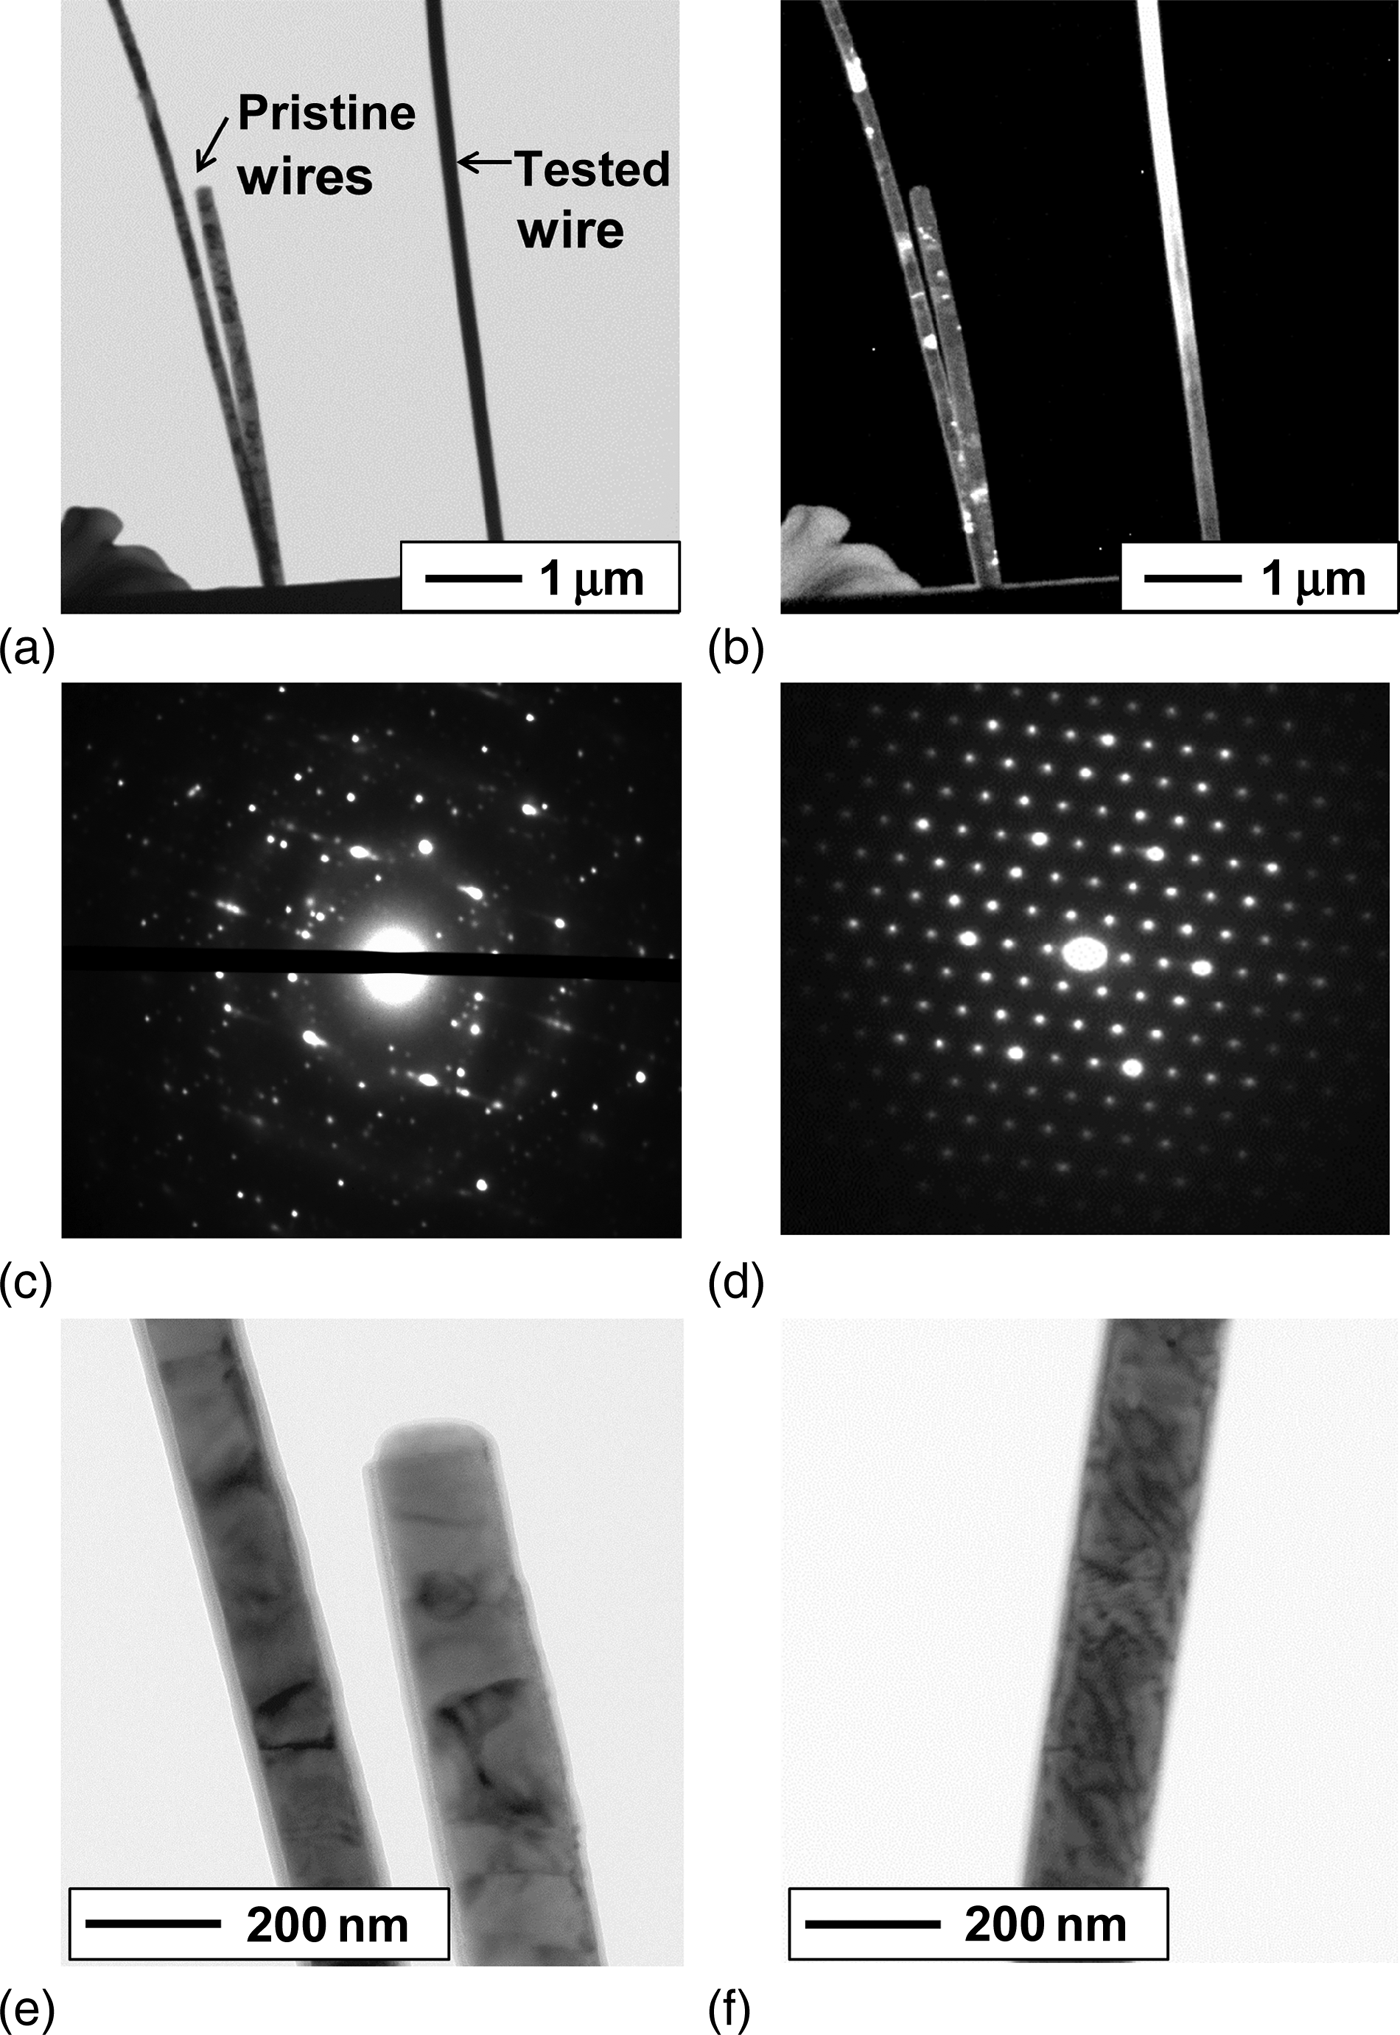
The morphological change of a nanowire (“specimen 2”) after cyclic loading is shown in Fig. 2. At a few locations, a thickening of the nanowire is observed. The nanowire failed close to such a region during cycling as shown in Figs. 2(d) and 2(e). The TEM analysis of this specimen reveals a drastic microstructural transition from polycrystalline near-bamboo grains to large grains as indicated by the bright–dark contrasts in Figs. 3(a) and 3(b). This observation is supported by the diffraction patterns shown in Figs. 3(c) and 3(d): the diffraction pattern of a pristine nanowire consists of a main pattern with additional reflections indicating the presence of nanocrystals at different orientations. In contrast, the diffraction pattern of the fatigued nanowire shows a highly ordered pattern of a single crystal oriented in the [111] zone axis. A detail image of the pristine nanowires is shown in Fig. 3(e). The micrograph shows clearly the polycrystalline nature of the nanowires with some dark contrasts within the grains, which might indicate the presence of individual dislocations. In contrast, Fig. 3(f) shows many dislocations in a part of the large grain at the upper end of the tested nanowire, i.e., the bright area in Fig. 3(b).
Mechanical testing of a Cu–Si nanowire (“specimen 2”) in an SEM chamber: (a) nanowire which is gripped by Pt-tapes on a force sensor (upper end) and a TEM grid (lower end) before the testing and (b) after the testing. (c) Detail image of the fracture site showing that the Pt tape is still intact after failure (d). (e) Thickened regions of the nanowire which have formed upon testing.
TEM analysis of Cu–Si nanowires: (a) Bright-field and (b) dark-field image of two pristine and one mechanically fatigued nanowire (“specimen 2” after 17,493 cycles). (c) Diffraction pattern of a pristine nanowire [note that this pattern was not taken from the pristine nanowires, shown in (a) and (b), but from another pristine nanowire from the same sample]. (d) Diffraction pattern of the fatigued nanowire [taken from the bright area in (b)]. A specimen area of about 150 nm in diameter contributed to the patterns shown in (c) and (d). (e) Detail bright-field image of the pristine nanowire shown in (a) and (b). (f) Detail bright-field image of the fatigued nanowire [taken from the lighter area in (b)].
For the first time, fatigue experiments on metallic nanowires with cycle numbers in the high-cycle fatigue regime and stress ranges of more than 1 GPa have been performed. The fatigue-related microstructural evolution has been analyzed by TEM. A comparison of the microstructure of pristine and fatigued Cu–Si nanowires revealed fatigue-induced grain growth as known from fatigue experiments in nanocystalline bulk materials.[Reference Witney, Sanders, Weertman and Eastman10, Reference Schwaiger, Dehm and Kraft11] Here, the pristine wires showed a nanocystalline near-bamboo structure, whereas in the nanowires subjected to cyclic loading, one large grain extended almost over the whole length of the nanowire. It can be argued that this change in the microstructure influences the mechanical behavior in several ways:
Tensile strength
The nanowire (“specimen 2”) which was subjected to cyclic loading showed a higher tensile strength as compared with the pristine nanowires. It should be mentioned, that only initially strong nanowires that could sustain the upper load amplitude were subjected to fatigue testing and weaker nanowires failed before the maximum load was achieved. Thus, the testing procedure is selective to nanowires with intrinsically high strengths, i.e., the strength is by definition higher than the upper stress level in the fatigue test. Also, it should be mentioned that the strength of metallic nanowires shows typically strong scatter,[Reference Sedlmayr, Bitzek, Gianola, Richter, Mönig and Kraft2, Reference Richter, Hillerich, Gianola, Monig, Kraft and Volkert20] and here we have only performed one test. Thus, for a more quantitative discussion, further tests are required. However, the strength of the nanowire tested monotonically after fatigue, significantly exceeds the strengths of the pristine wires and the upper stress level of the test. This might result from the reduction of defects, in this case the removal of grain boundaries upon cyclic loading. A similar effect at small scale has been found for Si beams.[Reference Boroch, Müller-Fiedler, Bagdahn and Gumbsch25] This effect also resembles the described “mechanical annealing”[Reference Shan, Mishra, Asif, Warren and Minor26] of nanopillars where dislocations are removed upon monotonic loading.
Increase in compliance
The Young's modulus of pure Cu can vary between E <100> = 67 GPa and E <111> = 192 GPa. Single-crystalline <110> oriented Cu nanowires, which were prepared by the same route, show Young's moduli in the range of 70–200 GPa.[Reference Richter, Hillerich, Gianola, Monig, Kraft and Volkert20] Compared with those values, our data show lower Young's moduli in the range of 30–88 GPa, which further decrease during cyclic loading. Note that experimental errors have been minimized, i.e., the strain was directly measured by digital image correlation (DIC) of the SEM micrographs, the cross-sectional area of the wires was measured by SEM/TEM analysis and the forces were measured by a calibrated force sensor. On the one hand, Boles et al.[Reference Boles, Sedlmayr, Kraft and Monig23] tested <111> oriented Si nanowires using the same testing setup and reported Young's moduli, which are approximately 40% of the literature value for the bulk material. Thus, it may be possible that the measurement of low Young's moduli is an experimental artifact. On the other hand, the Young's modulus has frequently been reported in the literature to be low at small length scales compared with the bulk values, for instance, for Co nanowires.[Reference Zhang, Breguet, Clavel, Philippe, Utke and Michler27] For thin films this behavior has been attributed to inelastic processes upon mechanical loading including reversible and irreversible dislocation microplasticity.[Reference Huang and Spaepen28] It may be possible that the dislocations found by TEM contribute to inelastic processes in the material but the origin of the low absolute values of the Young's moduli and their scatter even for the pristine nanowires remain unclear. Thus in the following, the focus is on the relative change in compliance upon cyclic loading. The Young's modulus, that was calculated based on the strain measurement by DIC, decreased by about 20% during cyclic loading. This loss in stiffness might be ascribed to a change in microstructure during cycling where compliant grains grow (e.g., <100> orientation along the wire axis) at the cost of stiffer grains.
Strain localization
The SEM images showed local thickening of the nanowire, which has formed during cyclic loading and indicate the presence of strain localization. From the rather soft and rounded shape of the damaged regions it may be concluded that diffusion plays a role. At room temperature volume diffusion is slow as compared with diffusion along grain boundaries and the surface. Since large grains exist, and no continuous boundary paths are present, surface diffusion may be the dominating mechanism. Considering two neighboring grains under tension with different orientations along the wire axis, a driving force exists that leads to atom motion toward the grain having the lower strain energy. If atoms accumulate on the surface of this grain, its diameter is increased and the stress level decreases so that this process can accelerate. Another possible explanation for the local thickening are processes that are more common to fatigue. In TEM, many dislocations were found inside the tested nanowire. At this length scale, the formation of typical cell or wall structures is not observed similar to the observation in fine-grained thin films.[Reference Zhang, Volkert, Schwaiger, Wellner, Arzt and Kraft29] Since an overall decrease in the nanowire diameter or length is not observed, it may be suggested that this local thickening is correlated to the formation of vacancies during cyclic loading due to the motion of dislocations, e.g., the annihilation of dislocations on adjacent slip planes.[Reference Schwaiger, Dehm and Kraft11, Reference Holzwarth and Essmann30] Another possible mechanism is the pile-up of dislocations at a grain boundary and the accumulation of local plastic strain. In any case, eventually the thickened portions of the wire will promote failure as they act as stress-concentration sites where cracks can be initiated.
In summary, metallic nanowires were tested under cyclic tension–tension loading with an upper stress in the GPa range. The nanowires failed after approximately 3000, 17,000 or survived more than 18,000 cycles. The results clearly show that the exceptional high strength of these nanomaterials is at least maintained or even improved during cyclic loading, which needs further clarification but is of both, scientific as well as technological interest. During cycling a drastic change in microstructure is observed from a polycrystalline near-bamboo structure to an almost single-crystalline state. The changes in microstructure and defects are believed to have significant impact on the mechanical behavior: First, a change in crystallographic orientation, i.e., growth of compliant grains in tensile direction, can explain the observed increase in compliance. Second, thickened regions form, where stress concentrations may occur and where the wires eventually fail. Third, the reduction of grain boundaries may lead to increased strengths in cyclically loaded nanowires.
Supplementary materials
For supplementary material for this article, please visit http://dx.doi.org/10.1557/mrc.2014.18
Acknowledgments
The authors thank Wenting Huang and Gunther Richter (Max Planck Institute for Intelligent Systems, Stuttgart, Germany) for preparation of the nanowires. This work has been supported by the Robert Bosch Foundation which is gratefully acknowledged. Furthermore, the work was supported by the Project Based Personnel Exchange Program between the China Scholarship Council (CSC) and the German Academic Exchange Service (DAAD).