Introduction
Durum wheat (Triticum durum Desf.) is tetraploid wheat that represents approximately 5% of the global and Australian wheat production. Although durum constitutes only a small portion of the wheat production, it is an economically important crop because of its unique characteristics and its use in making important food products such as pasta. Grain of durum wheat is hard, vitreous and amber coloured with high protein content. Grain quality of durum from Northern New South Wales (NSW) is considered to be world-class and is sought after by the European buyers (Kneipp, Reference Kneipp2008). It is often used to blend with locally grown durum to improve the quality of the grist (Anonymous, 2011). However, a series of droughts in recent decades (Chenu et al., Reference Chenu, Cooper, Hammer, Mathews, Dreccer and Chapman2011 and Reference Chenu, Deihimfard and Chapman2013a) and recent severe droughts (2018 and 2019) have produced large fluctuations in production. Such fluctuations together with a lack of orderly marketing and market development (Kadkol and Sissons, Reference Kadkol, Sissons, Wrigley, Corke, Seetharaman and Faubion2016) have impeded the expansion of the Australian durum industry. Another factor limiting the growth of the durum industry is the major impact of crown rot, which is often worsened due to poor crop rotations and the increasing frequency of drought seasons. This has contributed to lower on-farm performance of the durum crops relative to bread wheat which possesses superior resistance to crown rot. Durum wheat is also grown under high input irrigated conditions in NSW. This sector is growing in importance due to high yields as well as the major fluctuations in production in the rainfed sector mentioned earlier. Whilst official statistics are not available, approximately 10–15% of the normal durum area (approximately 120 000 ha) in NSW is irrigated.
As a species, durum wheat is adapted to a wide range of conditions from temperate climates to warm tropical and semiarid conditions. A significant portion of the world production of durum wheat occurs under rainfed conditions in semiarid regions with relatively dry climate, warm days and cool nights during crop growth. Drought stress occurs frequently in these regions (Kadkol and Sissons, Reference Kadkol, Sissons, Wrigley, Corke, Seetharaman and Faubion2016). However, the current Australian durum varieties are reputed to be adapted to the relatively good rainfall and high fertility conditions, which are regularly obtained in regions such as the Liverpool and Moree Plains regions in Northern NSW and the mid-North region of South Australia (SA). This reputation is presumably due to the high grain quality requirements for obtaining the best price for durum grain and this can be achieved more easily in the above traditional durum growing regions. However, severe drought, affecting crops at ear emergence, anthesis and/or grain filling occurs regularly in these traditional durum production zones (Chenu et al., Reference Chenu, Cooper, Hammer, Mathews, Dreccer and Chapman2011 and Reference Chenu, Deihimfard and Chapman2013a; Liu et al., Reference Liu, Searle, Mather, Able and Able2015).
To stabilize and increase production, particularly in the context of climate change, it is imperative to develop tolerance to drought and heat stresses (Lobell et al., Reference Lobell, Hammer, Chenu, Zheng, McLean and Chapman2015; Watson et al., Reference Watson, Zheng, Chapman and Chenu2017; Ababaei and Chenu, Reference Ababaei and Chenu2020). Understanding variation in yield, yield components and associated traits is an essential step in this process and in developing future breeding strategies. However, field-based studies of productivity traits and drought tolerance in durum wheat are limited.
In a field-based study of 24 Italian and Spanish durum varieties from three different periods, higher yields of modern varieties resulted from linear increases over time in the number of grains/m2 and harvest index (HI) without any significant changes in thousand grain weight (TGW) and biomass (Royo et al., Reference Royo, A´lvaro, Martos, Ramdani, Isidro, Villegas and Garcı´a del Moral2007). The modern high yielding varieties were also shorter due to the presence of the Rht-B1 allele. In another study, conducted in a glasshouse, consisting of 20 durum lines grain number was the main yield component affected by the pre-anthesis drought stress (Liu et al., Reference Liu, Searle, Mather, Able and Able2015). Lines with greater tolerance to water stress possessed a higher photosynthesis rate, taller stature and higher number of effective tillers.
It is important that studies of yield and its components are conducted such that there is good correspondence between the growing conditions of the research trials and those for the commercial crops (Rebetzke et al., Reference Rebetzke, Fischer, van Herwaarden, Bonnett, Chenu, Rattey and Fettell2014; Passioura, Reference Passioura2020). Whilst it is attractive to use glasshouse facilities for studies of stress tolerance on the basis of being able to impose precise stress conditions, the relevance of such studies to the field situation is doubtful. However, field evaluation of germplasm for performance is difficult because the environments are variable and unpredictable and genotypes × environment interactions are difficult to interpret, especially if environments are not well characterized (Chenu, Reference Chenu, Sadras and Calderini2015). To improve the relevance of phenotyping in a restricted set of environments, Rebetzke et al. (Reference Rebetzke, Chenu, Biddulph, Moeller, Deery, Rattey, Bennett, Barrett-Lennard and Mayer2012) proposed a set of managed environment facilities (MEFs) consisting of field sites representing the main pedo-climatic conditions encountered across the Australian wheat belt. Each MEF manages soil moisture stress through irrigation to target drought environment types representative of the region (Chenu et al., Reference Chenu, Doherty, Rebetzke and Chapman2013b and Reference Chenu, Doherty, Brider, Rebetzke, McDonald, Mayfield, Bechaz, Pattison, Murfit and Mayer2016). Protocols have been standardized for an essential core set of measurements so that phenotyping traits including yield is consistent across sites and seasons (Rebetzke et al., Reference Rebetzke, Chenu, Biddulph, Moeller, Deery, Rattey, Bennett, Barrett-Lennard and Mayer2012). The current work was conducted in one of these MEFs, located in the Plant Breeding Institute, Narrabri, which has suitable growing conditions for durum wheat.
This study aimed to evaluate a set of elite durum lines in field-based experiments, incorporating rainfed and watered conditions, to (a) characterize and benchmark durum germplasm against bread wheat and durum wheat checks for key physiological and agronomic traits, to (b) evaluate genetic variation in durum wheat for drought adaptation and to (c) assess the value of physiological traits on durum productivity. This paper presents results on agronomic traits benchmarking of the durum material against the check varieties.
Materials and methods
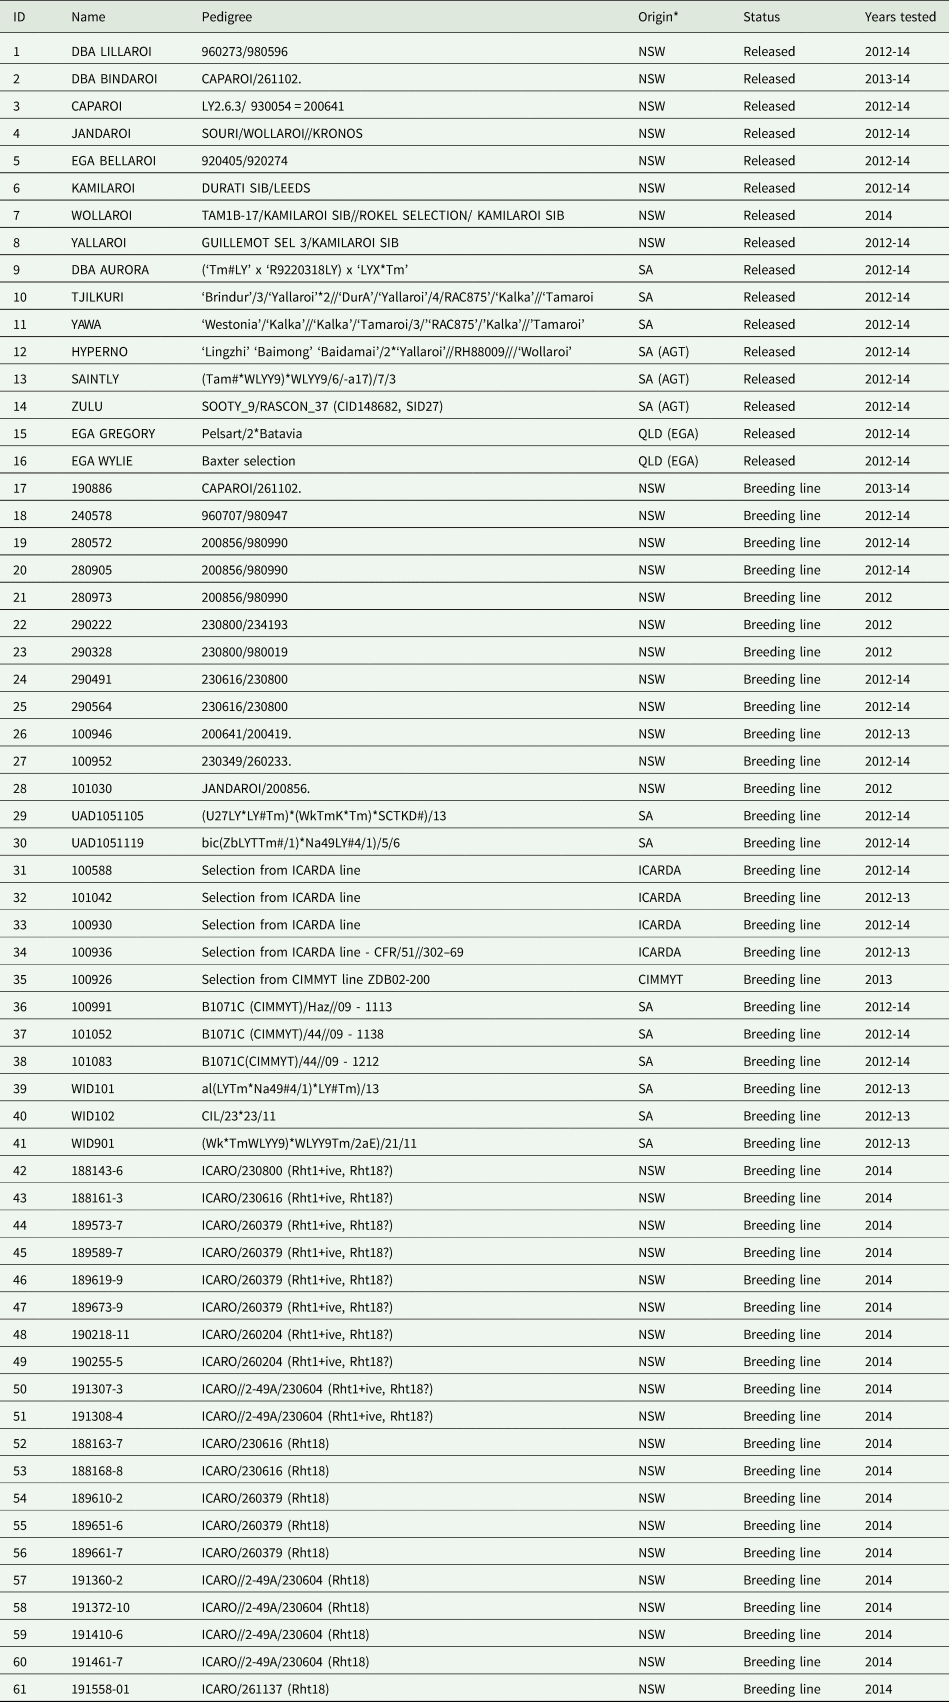
This work was conducted under both rainfed and watered conditions in a MEF (Rebetzke et al., Reference Rebetzke, Chenu, Biddulph, Moeller, Deery, Rattey, Bennett, Barrett-Lennard and Mayer2012) site located in Narrabri, NSW, Australia, on grey cracking clay loam soils. The fertile soils and the prevailing seasonal conditions of Narrabri are well suited to grow durum wheat, making it a major durum production centre in Australia. The trials included a total of 61 lines (Table 1) grown over three seasons from 2012 to 2014.
Pedigree and origin of durum and bread wheat genotypes tested. The ID number has been used to annotate the genotypes in the figures.

*NSW - Durum Breeding Australia program based in NSWDPI, Tamworth; CIMMYT – International Maize and Wheat Improvement Centre, Mexico; ICARDA – International Centre for Agricultural Research in the Dry Areas, Morocco; QLD (EGA)- Enterprise Grains Australia; SA - DBA program based in The University of Adelaide; SA (AGT) - Australian Grain Technologies, Adelaide.
Durum wheat lines
A set of durum lines of diverse origin, chosen based on their yield potential in Durum Breeding Australia trials (DBA, a Grains Research and Development Corporation funded breeding project) were grown over the three seasons. This group of lines included elite DBA breeding lines from the northern and southern nodes (based in NSW Department of Primary Industries, Tamworth and The University of Adelaide, SA, respectively), released varieties and also promising lines from CIMMYT and ICARDA (International Centre for Maize and Wheat Improvement and International Centre for Research in Dryland Agriculture, Table 1). Three newly developed high-yielding lines were added to the study in the 2013 season. In 2014, 20 promising lines derived from crosses of Northern DBA lines with Icaro, a gibberellic acid (GA) sensitive semi-dwarf durum line that carries Rht18 gene (Condon, Hare and Rebetzke, Reference Condon, Hare and Rebetzke2004) were included in the trials. All these lines were semi-dwarf in stature but 10 of these lines did not possess the Rht-B1 allele (G. Mekuria and D. Mather, personal communication) and were later confirmed to possess the Rht18 allele (D. Mather and A. Binney, personal communication), as a diagnostic marker became available (Ford et al., Reference Ford, Foo, Sharwood, Karafiatova, Vrána, MacMillan, Nichols, Steuernagel, Uauy, Dolezel, Chandler and Spielmeyer2018). These Rht18 lines were sensitive to GA (data not presented).
EGA Gregory, an Australian Premium Hard (APH) bread wheat variety, was used as the main yield benchmark due to its reputation for high yield. This variety was widely adopted in NSW and Queensland. It formed a substantial portion of grain receivals by GrainCorp, in particular in 2011/12 season (Anonymous, 2012).
Caparoi was chosen as the durum benchmark given its good adaptation to Northern NSW. This variety has a good yield potential under both dry and wet seasons in the National Variety Trials (NVT online – www.acasnvt.com.au). In addition, Caparoi formed a substantial portion of the durum grain receivals by GrainCorp (Anonymous, 2012).
Field trials
The trials were conducted at the MEF site at the Plant Breeding Institute, Narrabri (Latitude: 30.34°S; Longitude: 149.76°E; Elevation: 212 m; Mean annual rainfall: 644 mm; Mean annual maximum temperature: 26.7°C; Mean annual minimum temperature: 11.6°C) on a grey cracking clay loam soil of 1.8 m depth and with a plant available water holding capacity (PAWC) of 295 mm. Fertilizer application included 100 kg N pre-drilled as urea and 5.5 kg N, 10.9 kg P, 2 kg S, 0.5 kg Zn per hectare applied at sowing as Granulock Z (Incitec Pivot). No major disease incidence was recorded. Details of sowing date, initial soil moisture, planting density and watering are provided in Table 2. The MEF comprised two adjacent blocks. One of which was watered and the other rainfed. It is important to note that watering was applied to the same block every year, namely, the block located on the western side of the MEF site although every year the site was moved to a different part of the paddock.
Trial management details including plant available water at sowing (figures in bracket are the percentages of field capacity) and timing and quantity of watering of the watered blocks

Plots were 4 m long and consisted of six rows spaced 26.5 cm apart. The rate of sowing was equivalent to 100 seeds/m2. To avoid border effects, only the inner four rows were harvested for yield (Rebetzke et al., Reference Rebetzke, Fischer, van Herwaarden, Bonnett, Chenu, Rattey and Fettell2014). Within each block, plots were arranged in rectangular arrays indexed by columns and rows.
The treatments comprised the factorial combinations of irrigation regimes (rainfed and watered) and genotypes. The treatments were allocated to plots in such a way that each irrigation regime was allocated to all plots in a single block and genotypes were allocated to plots within blocks using ‘Row-column’ designs (Coombes, Reference Coombes2006). Alternative designs, such as, split plot or strip plot, were not used due to the limitation from watering equipment which could only water large sections of the trial area. In 2012 and 2013, there were two replicate plots of all genotypes per block (and an additional two plots of Caparoi in 2012). The replicates did not form resolvable blocks. In 2014, most genotypes in Block 1 (the block allocated the rainfed regime) had three replicate plots, whereas in Block 2 (watered regime) some genotypes had only two plots. The level of replication for varieties within blocks is summarized in Table 3.
Experimental design information for each trial. In 2014, the block sizes were unequal so where information differs it is presented for each block, separated by a comma (i.e. rainfed and watered blocks, respectively)

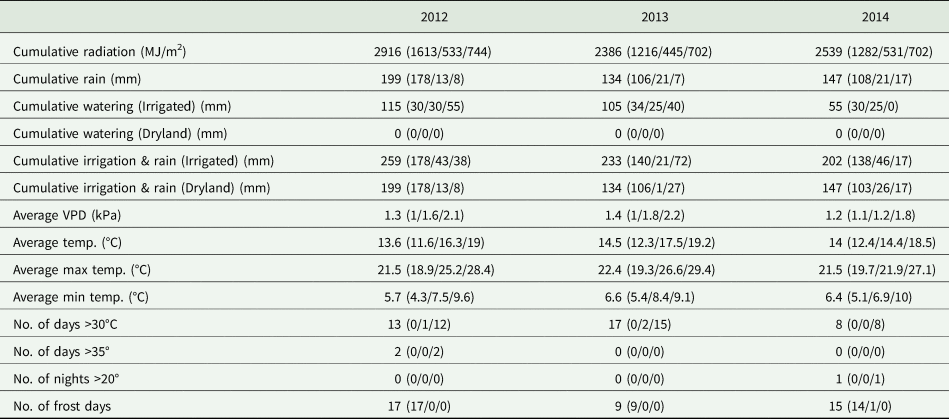
Irrigation was applied to the watered block using an overhead lateral-move system. Adequate precautions were taken to separate the rainfed block from the watered block with a buffer area. Water scheduling for the watered block was managed with the use of the StressMaster application (Chenu et. al., Reference Chenu, Doherty, Rebetzke and Chapman2013b) in an attempt to obtain the type of drought environments that typically occur in the region, i.e., a low-stress environment in the watered block (‘Environment Type 1’; Chenu et al., Reference Chenu, Deihimfard and Chapman2013a) and a mild to severe stress in the rainfed block. Given the amount of rainfall during the three seasons, no water was applied to the rainfed block. Environmental characteristics for the trials are presented in Table 4 and Fig. 1.
Environmental characteristics (temperature, radiation, rainfall and watering) for the growing seasons of 2012–2014

Data are presented for the entire crop cycle (from sowing to end of grain filling) with data in brackets for ‘vegetative period’ (from sowing to 300°Cd before flowering), ‘around flowering period’ (from 300°Cd before flowering to 100°Cd after flowering), and ‘grain filling period’ (from 100°Cd after flowering to the end of grain filling).
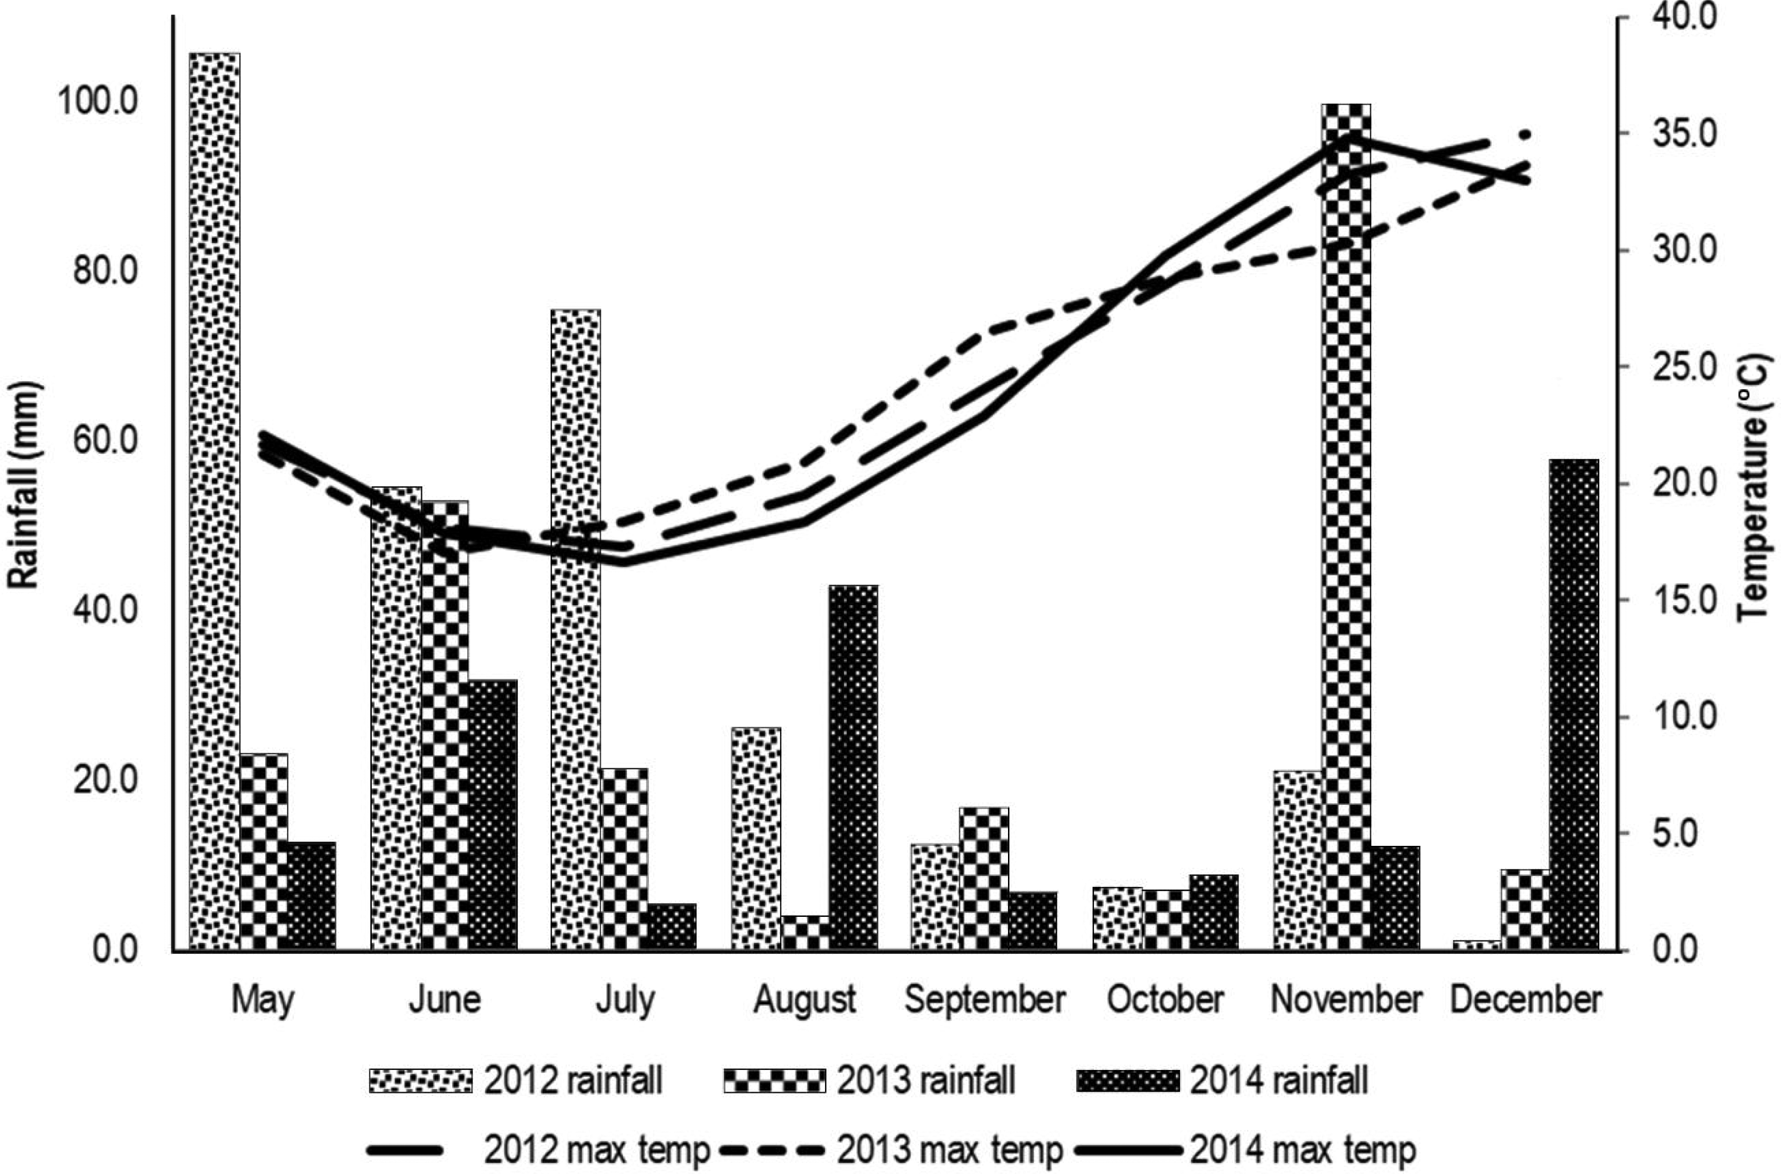
Monthly cumulated rainfall (mm) and average maximum temperatures (°C) during the growing season at Narrabri for 2012–2014.

Plant measurements
Days to maturity (DTM) was assessed as the number days from sowing to yellowing of ears for approximately 50% of the plants. Plant height (PLHT) was recorded as canopy height after anthesis: the length from the base of the plants to the tip of the ears in a representative part of the plot was recorded. Quadrats consisted of three inner rows of 40 cm length with the total area of 3180 cm2. Dry matter at maturity (final dry matter (FDM)) was assessed on a quadrat as the weight of total above-ground plant matter. At maturity, plot ends were trimmed and the outer two rows were removed before machine harvesting. The harvested grain from all plots was weighed after equilibration to ambient moisture content for at least 6 weeks and recorded as grain yield (PYLD). Harvest index was calculated as the weight of grain from the quadrat expressed as a percentage of the weight of the total above-ground plant matter from the quadrat. Screenings (SCR) were recorded using a certified 2 mm sieve. A sample from machine harvested grain was weighed and then was sieved by shaking 40 times. Weight of grain passing through the sieve as a percentage of the total grain weight was recorded as SCR. Thousand grain weight was determined using the weight of 100 whole grains from the machine harvested grain.
Statistical analysis
The investigation of the data on various traits required a multi-environment trial (MET) analysis of the data combined across years. Given the complexity of this analysis, an important first step is to consider separate analyses of individual trials.
Analysis of individual trials
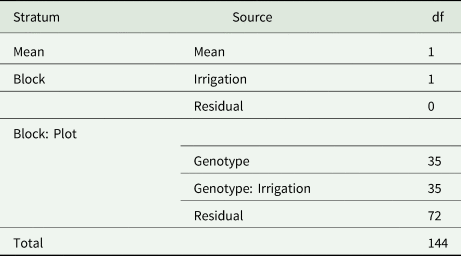
The classical analysis of a field trial is based on the randomization employed in the experiment design. In the current study, the use of row-column designs means the overall experiment design for any trial was non-orthogonal. This was initially ignored so that an ANOVA can be used to highlight some key points. Without loss of this generality, we consider the 2013 trial as an example. Given the treatment structure (the factorial combination of two irrigation regimes and 36 genotypes) and the randomization procedure (described previously), the first three columns of the ANOVA table for any trait for 2013 was as given in Table 5. Two key characteristics of this table were that:
1. There was no valid test for the main effect of irrigation regimes since the appropriate residual has zero degree of freedom (due to the aliasing of irrigation and block effects)
2. There was a valid test for the interaction of irrigation regimes and genotypes but the aliasing cautions against assigning effects to irrigation regimes when these effects may (at least in part) be due to block effects. Therefore, the terminology of ‘genotype by irrigation block’ interaction has been adopted in the remainder of the paper. The individual blocks were designated ‘rainfed’ and ‘watered’ to avoid any confusion.
. First three columns of the ANOVA table for simplified analysis of 2013 trial

These points, in particular the second, must be borne in mind as the analysis progresses from the ANOVA into more complex linear mixed model (LMM) analyses that are required for an appropriate analysis.
In the move from the ANOVA to an LMM analysis for individual trials, random row and column effects were included as necessary and spatial models were used for the trait of grain yield (see the online Supplementary material for further details). In terms of the treatment effects, the assumption of random genotype main effects and random irrigation block by genotype interactions was adopted as this was consistent with the aim of examining genetic variability. The variance structure that arises from these assumptions involves a correlation between the genotype effects in the two blocks, which will henceforth be called the genetic correlation between irrigation blocks. It measures the strength of agreement in genotype predictions between irrigation blocks. Further details are provided in the Supplementary material.
Combined analysis across trials
The analysis of data combined across trials is also known as a MET analysis. In a standard MET dataset, individual trials have a single treatment factor, namely genotypes, so that the genetic effects can be regarded as comprising a two-way table indexed by genotypes and trials. In the current study, individual trials have a factorial treatment structure so that in the MET analysis, the genetic effects comprise a three-way table indexed by genotypes, irrigation blocks and trials. This is, therefore, an example of a multi-treatment MET dataset, so the LMM approach of Smith et al. (Reference Smith, Borg, Gogel and Cullis2019) was used to fit a three-way separable variance model for the genetic effects. This required stipulation of three-component matrices:
• a factor analytic matrix with one factor (denoted FA1) for the trial dimension, which provides a ‘between trial genetic variance matrix’ that comprises a separate genetic variance for each trial and separate genetic covariances (thence correlations) between pairs of trials,
• a correlation matrix for the block dimension, which provides a genetic correlation between irrigation blocks,
• an identity matrix for the genotype dimension.
This is a generalisation of the model considered for individual trials that allow not only for a genetic correlation between irrigation blocks but also genetic correlations between trials. The fixed effects in the model comprised the main effects of trials, the irrigation blocks and their interactions. Random effects for columns and rows were included where deemed appropriate, that is, as identified in the individual trial analyses. A separate residual variance was assumed for each trial. The data comprised individual plot measurements so that this is a single-stage MET analysis. Full details of the model are provided in the supplementary material.
Fitting this model provided residual maximum likelihood (REML) estimates of the variance parameters, in particular those described above, and empirical best linear unbiased predictions (EBLUPs) of the genetic effects. These may be regarded as a three-way (genotype by trial by irrigation block) table. Given the factor analytic component matrix for the trial dimension, the EBLUPs can be summarized using the tools described in Smith and Cullis (Reference Smith and Cullis2018). Three types of summaries were formed, namely (a) across trials to obtain genotype EBLUPs for each irrigation block, (b) across irrigation blocks to obtain genotype EBLUPs for each trial and (c) across trials and irrigation blocks to obtain a single set of genotype EBLUPs that measure overall performance (OP) for each trait. The latter was used to empirically examine relationships between traits at the genetic level. Details on the summaries of the EBLUPS are given in the Supplementary material.
All analyses were conducted using the statistical software ASReml-R Version 4 (Butler et al., Reference Butler, Cullis, Gilmour, Gogel and Thompson2017).
Results
In the following sections, the genotype ID number (from Table 1) has been provided in brackets after each mention of a genotype that has been labelled in this way in the graphs.
Analysis of individual trials
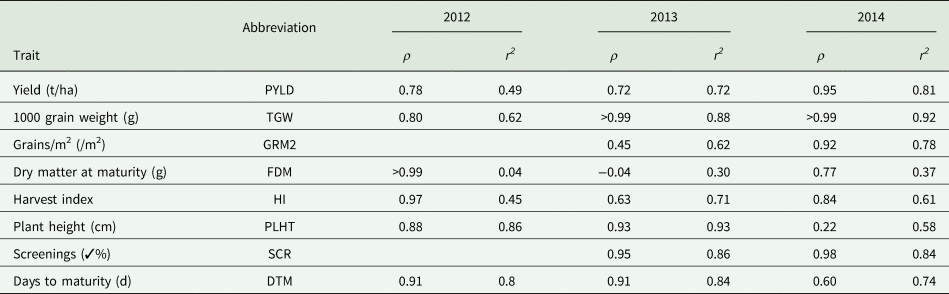
The REML estimate of the genetic correlation between irrigation blocks is given for each trial and each trait in Table 6. The high correlations in Table 6 suggest that genotype by irrigation block interaction is small but this interaction will be better explored in the combined analysis across trials.
Key results from the analysis of individual trials for each trait: estimated genetic correlation, ρ, between watered and rainfed blocks and mean reliability, r 2, of genotype EBLUPs in each block

A value of >0.99 for ρ indicates the estimate was on the boundary of the parameter space so was constrained to be less than 1.0. Grains/m2 and screenings were not recorded in 2012 season. The screenings trait required a square root transformation to better approximate the assumptions of the analysis.
Table 6 also includes an estimate of the reliability of the EBLUPs of the genotype effects in each block. This measures the squared correlation between the true genetic value and predicted effects for individual genotypes (Mrode, Reference Mrode2005). These values have been averaged across genotypes and blocks to obtain mean reliability for each trial. There was a wide range of reliabilities. FDM had very low reliability in all 3 trials, indicating no genetic variance, and for this reason, the combined analysis was not conducted for this trait.
Combined analysis across trials
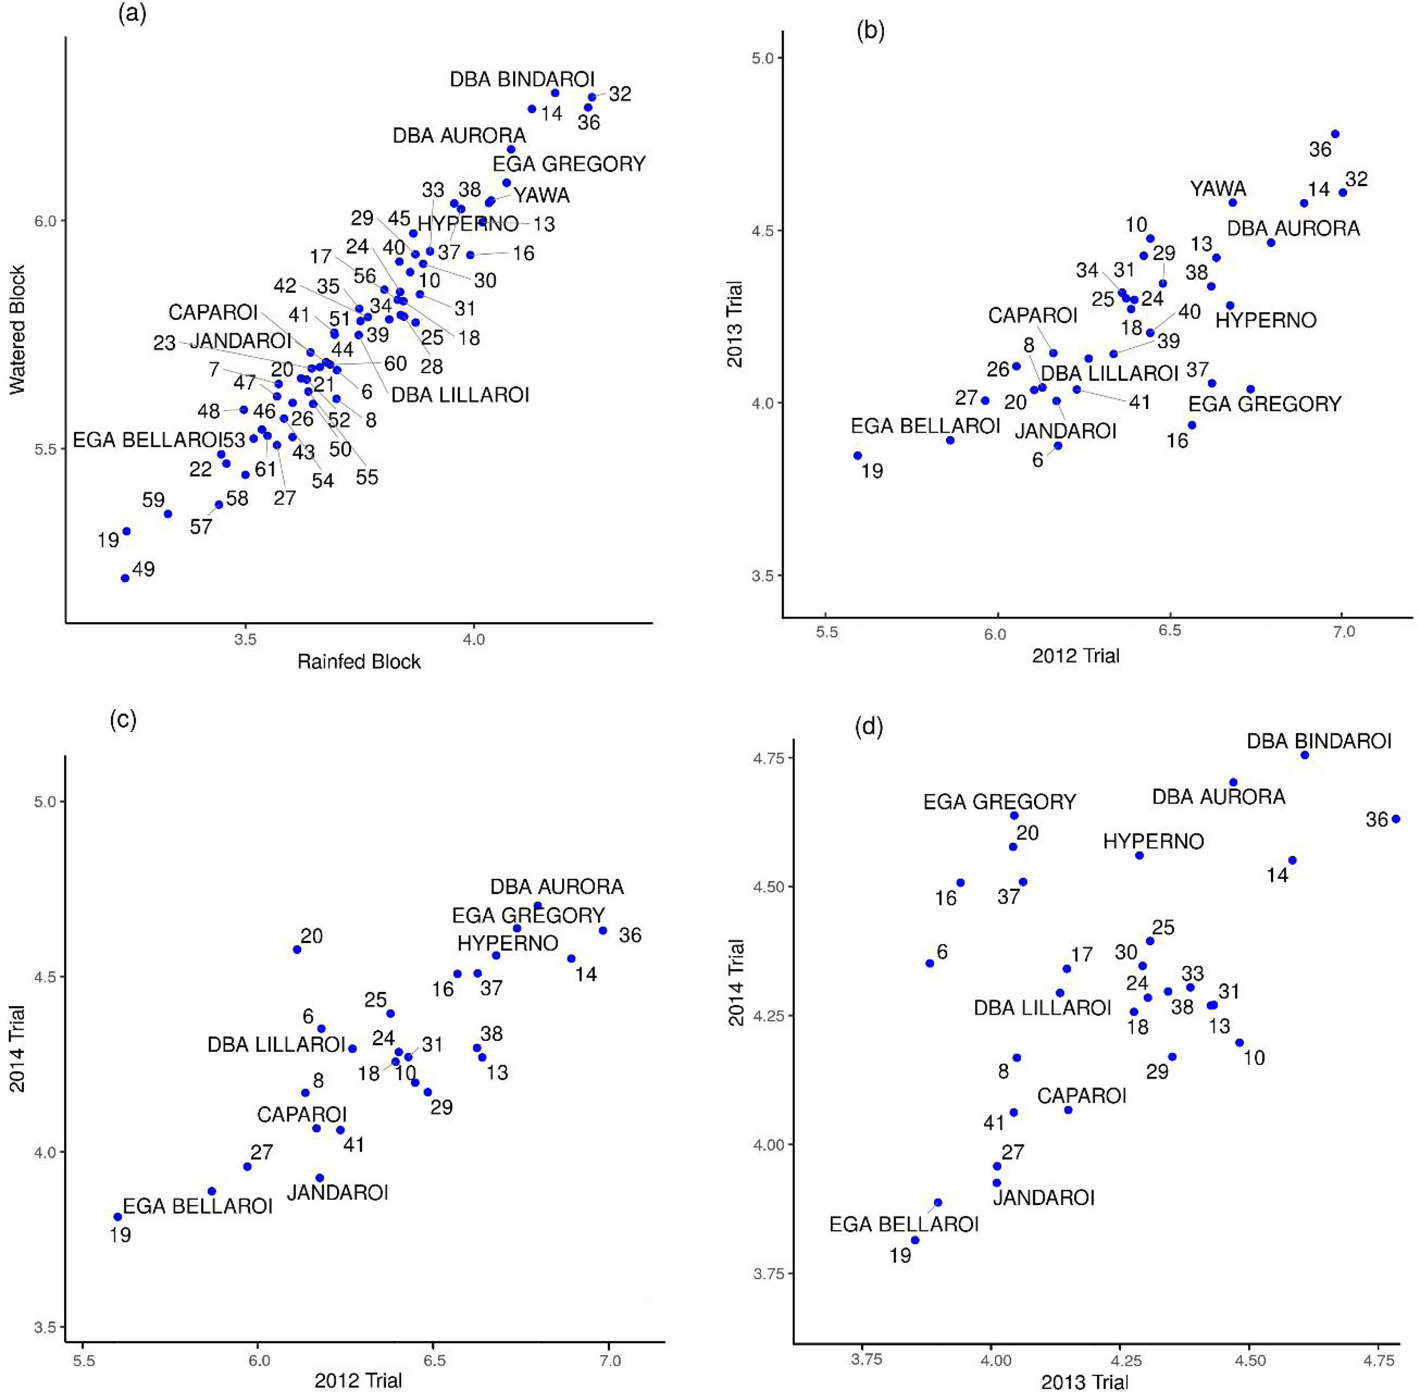
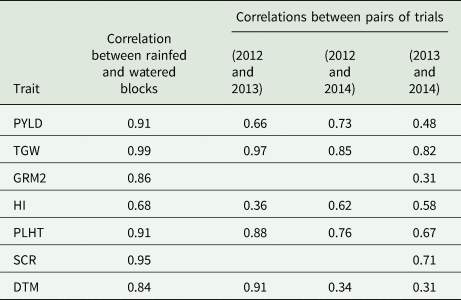
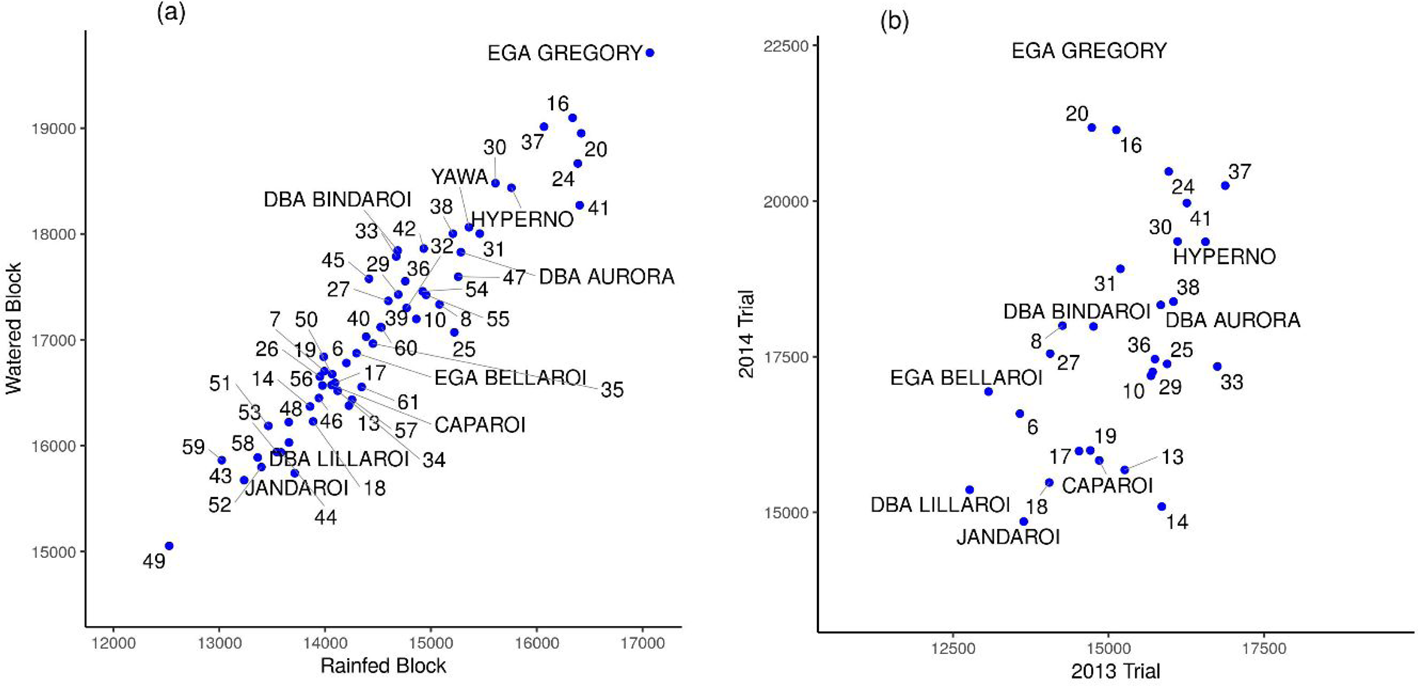
The REML estimates of the genetic correlations between rainfed and watered blocks from the combined analysis (Table 7) show that genotype by irrigation block interaction was small for most traits, with the between block correlation estimates being very high (>0.90 for 4 out of the 7 traits). The notable exception was HI with an estimated genetic correlation between blocks of 0.68. A number of traits exhibited substantial variety by trial interaction as evidenced by the low estimated pairwise genetic correlations. Estimates as low as 0.4 or less were found in 4 cases (Table 7). These low genetic correlations reflected substantial changes in genotype rankings. These genetic correlations have been investigated in more detail, using a series of graphs involving the variety EBLUPs for each block and the variety EBLUPs for each trial (Figs 2 to 8).
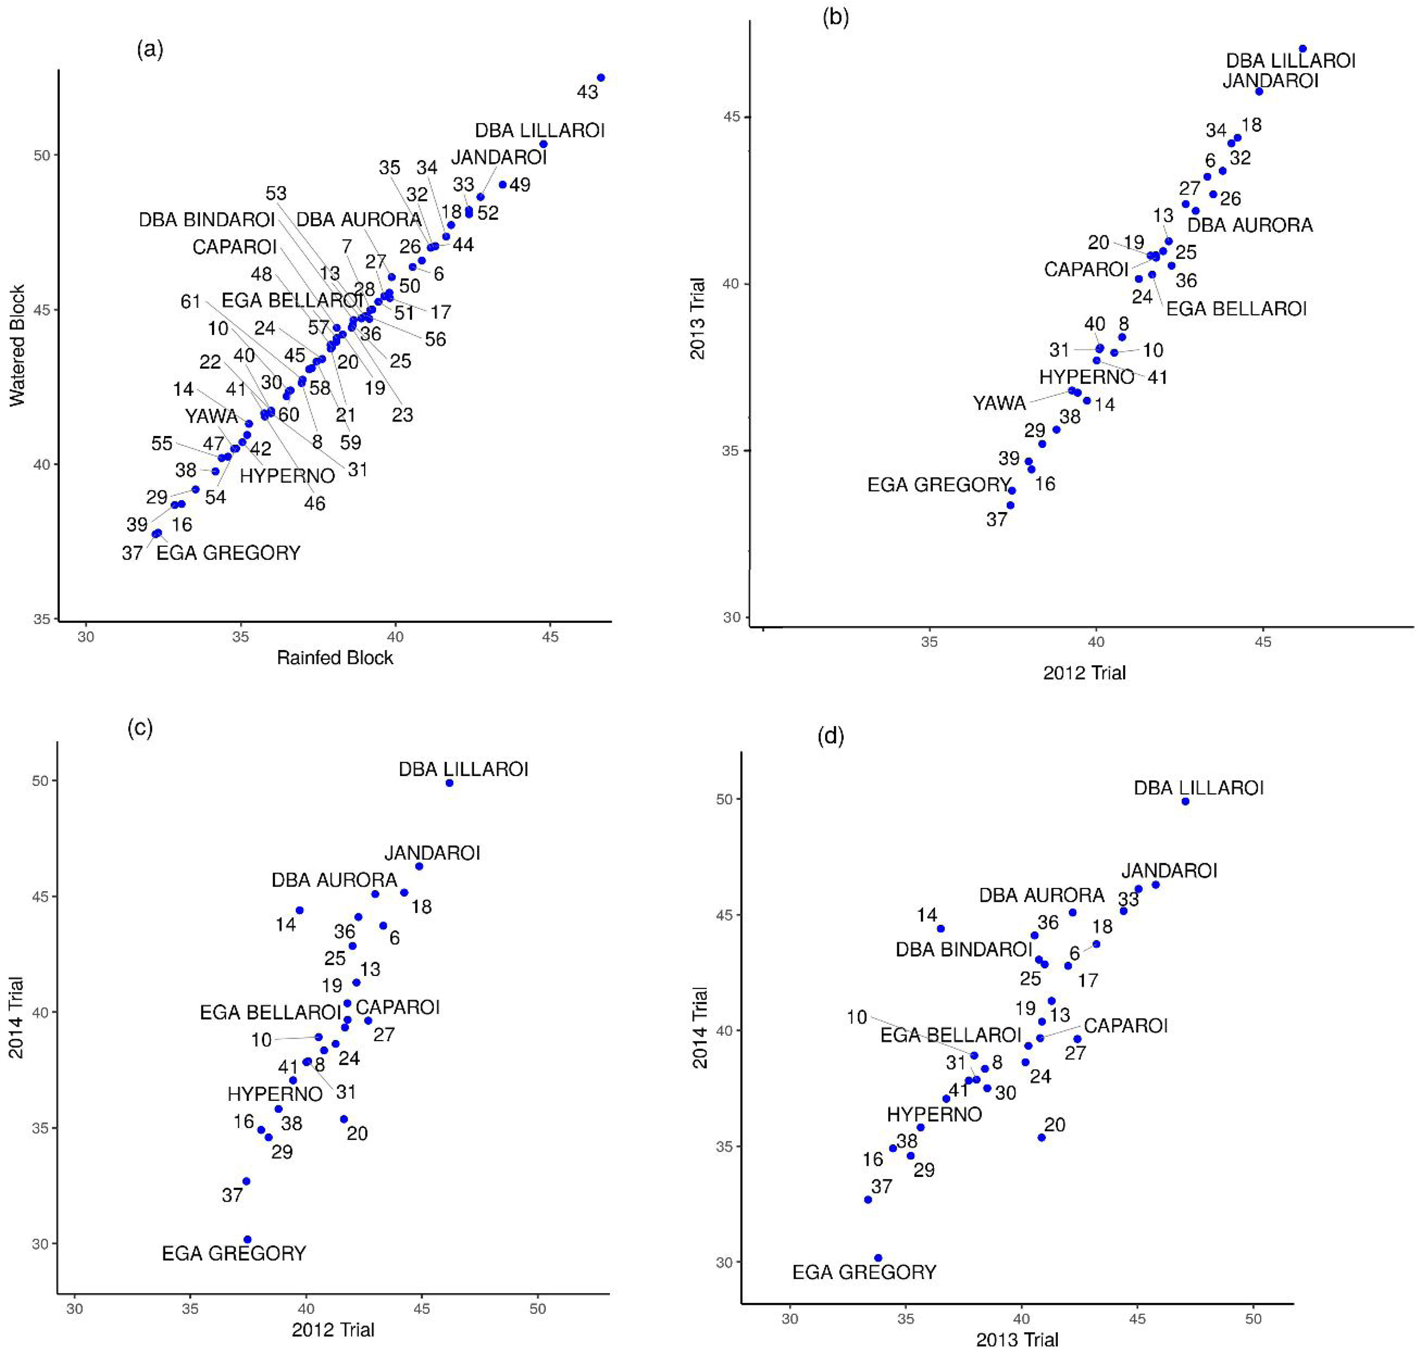
Genetic variation and correlation for yield across trials and blocks: (a) genotype EBLUPs for rainfed and watered blocks across all trials; (b), (c) and (d): genotype EBLUPs in individual trials presented as pairwise plots. Points are labelled with genotype names (control varieties) or ID numbers assigned to them in Table 1. Points in (b), (c) and (d) relate only to genotypes grown in both trials under consideration.

REML estimates of genetic correlations from MET analysis for each trait: correlations between irrigation blocks and between pairs of trials (GRM2 and SCR were not recorded in 2012 season).

Trait expression in watered and rainfed blocks
The environments tested over 2012–2014 were sufficiently diverse to provide good differences between irrigated and rainfed blocks. Whilst no severe terminal drought was experienced, the degree of stress was sufficient to produce higher screenings in several lines in the rainfed blocks. In all three seasons, the crops began with an almost full soil profile providing a reserve of more than 225 mm of moisture in the soil profile (Table 2). As a result, despite typical dry springs, the crops did not experience any of the most severe water stress that can occur in the region (Chenu et al., Reference Chenu, Cooper, Hammer, Mathews, Dreccer and Chapman2011 and Reference Chenu, Deihimfard and Chapman2013a) but only milder terminal stress typical of this region.
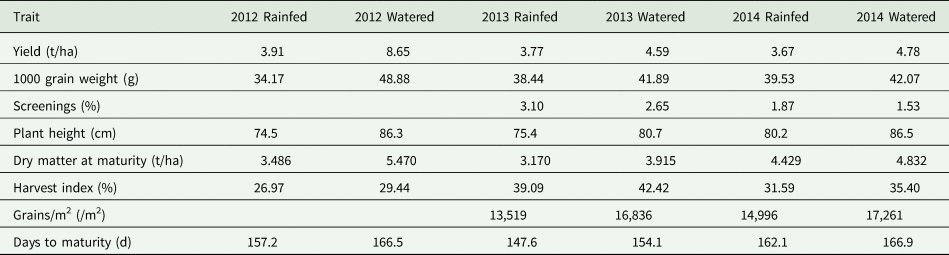
A wide range of yields was recorded, ranging from 4.59 to 8.65 t/ha in watered blocks and 3.67 to 3.91 t/ha in rainfed blocks (Table 8). Both durum and bread wheat varieties performed better under watered conditions, as expected. The highest differences between watered and rainfed blocks were observed in 2012 for all traits except for HI. The HI values in 2012 were the lowest but the difference between watered and rainfed blocks was consistent with the other years.
Trait expression (mean values) in watered and rainfed blocks in 2012–2014 MEF trials

Whilst yield from 2012 watered block was the highest, the rainfed yield was similar to the other years. This could be due to excellent growth until ear emergence from timely winter rainfall (May–August) resulting in high biomass and high GRM2 (not recorded) but poor grain filling due to terminal drought stress (Table 4 and Fig. 1). The high performance of the 2012 watered block was most likely due to a better moisture regime during all critical growth stages including grain filling due to supplementary watering. In addition, the temperature was lower whilst radiation was high resulting in a longer crop duration.
Grain yield
Combined analysis of the three years’ data showed that several durum lines, namely, DBA Bindaroi, 100991 (36), 101042 (32), Zulu (14) and DBA Aurora, out yielded the bread wheat check EGA Gregory and many more lines out yielded the durum check, Caparoi, in both watered and rainfed blocks (Fig. 2a). Whilst DBA Bindaroi from NSW was the highest yielder under watered conditions, 101042 from ICARDA and 100991 of CIMMYT and SA origin produced the best yield under rainfed conditions. The lines from crosses with Icaro were generally not competitive for yield in these trials, except for one Rht1 line, 189589-7 (45), and one Rht18 line 189661-7 (56) which produced better yield than Caparoi in both watered and rainfed blocks (Fig. 2a).
Graphs of EBLUPs comparing yield performance between years (Figs 2b–2d) showed a majority of the durum lines produced a more consistent yield than EGA Gregory, the bread wheat check which was a poor yielder in 2013. Caparoi, the durum check variety, had good yield consistency but its OP was low. The higher yielding durum varieties and lines also produced a more consistent performance than EGA Gregory. Zulu (14), a CIMMYT durum line released in Australia as a feed variety, and 101042 (32), an ICARDA line showed a combination of high overall yield performance and a relatively high level of consistency. 280905 (20), a sister line to DBA Vittaroi, had the highest level of inconsistency in its performance.
Thousand grain weight
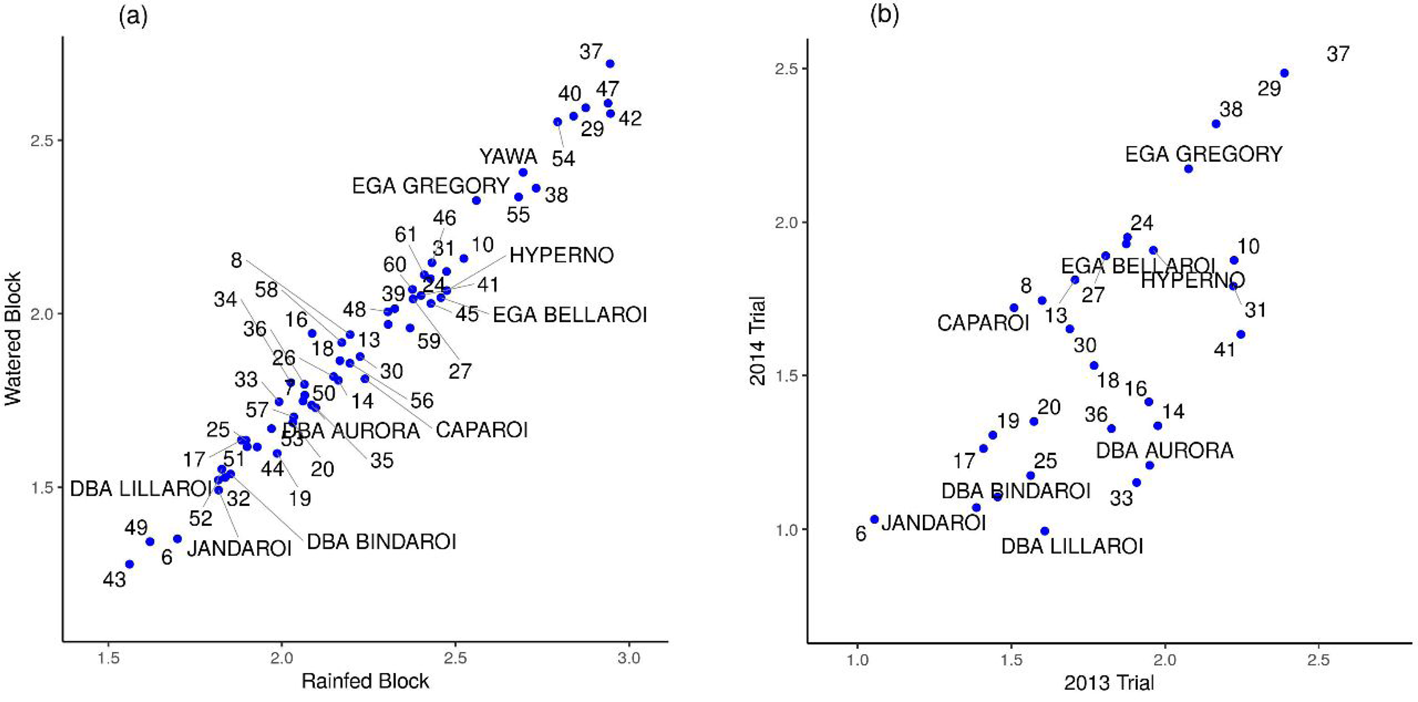
Analysis of TGW revealed a high degree of correlation between rainfed and watered blocks as well as between years. A large range of variation was apparent for the trait in the durum material (Fig. 3a–3d) and most genotypes were superior to EGA Gregory and many lines were superior to Caparoi which was, the better check for this trait. DBA Lillaroi and Jandaroi possessed the highest TGW in 2012 and 2013. In 2014, two newly added Rht1 lines derived from crosses with Icaro (188161-3 (43) and 190255-5 (49)) showed very high TGW, comparable to DBA Lillaroi. 188161-3 (43) was superior to DBA Lillaroi. A Rht18 line, 188163-7 (52) performed well for TGW although lower than DBA Lillaroi and Jandaroi. DBA Bindaroi and 100991 (36), which performed strongly for grain yield showed a relatively low TGW and mapped just above Caparoi.
Genetic variation and correlation for thousand grain weight (TGW) across trials and blocks: (a) genotype EBLUPs for rainfed and watered blocks; (b), (c) and (d): genotype EBLUPs of individual trials are shown as pairwise plots. Points are labelled with genotype names (control varieties) or ID numbers assigned to them in Table 1. Points in (b), (c) and (d) relate only to genotypes grown in both trials under consideration.

Some ICARDA (100930 (33), 100936 (34), 101042 (32)) and CIMMYT (100926 (35)) lines showed better performance for TGW than Caparoi and were comparable to Jandaroi. In general, the NSW material showed high TGW relative to the material of SA origin with the exception of DBA Aurora which performed better than Caparoi.
Zulu (14) and 280905 (20) showed substantial inconsistency in their performance with Zulu performing better in 2014 than in the previous two seasons and 280905 performing the worst in 2014.
Screenings
Screenings (SCR) data were recorded in 2013 and 2014. There was a strong correlation between rainfed and watered blocks for this trait. Correlation between 2013 and 2014 was high but not as strong as the correlation between blocks (Figs 4a and 4b).
Genetic variation and correlation for screenings (SCR) across trials and blocks: (a) genotype EBLUPs for rainfed and watered blocks; (b): genotype EBLUPs of individual trials are shown as a pairwise plot. Points are labelled with genotype names (control varieties) or ID numbers assigned to them in Table 1. Points in (b) relate only to genotypes grown in both trials under consideration.

Caparoi was the better check for SCR and there were many mainly NSW durum lines showing lower EBLUPs than it. DBA Aurora from SA, lines from ICARDA (101042 (32), 100930 (33), 100936 (34)), lines of CIMMYT origin 100926 (35), 100991 (36 – SA/CIMMYT) also showed lower SCR relative to Caparoi. Amongst the released varieties, Kamilaroi (6), DBA Lillaroi and DBA Bindaroi showed the best low SCR EBLUPs. The best SCR results were recorded for two Rht1 lines from crosses with Icaro, 188161-3 (43) and 190255-5 (49) which were also the highest TGW lines (Fig. 3a). Several Rht18 lines also showed low SCR, notably 188163-7 (52), 191308-4 (51) and 188168-8 (53).
Plant height
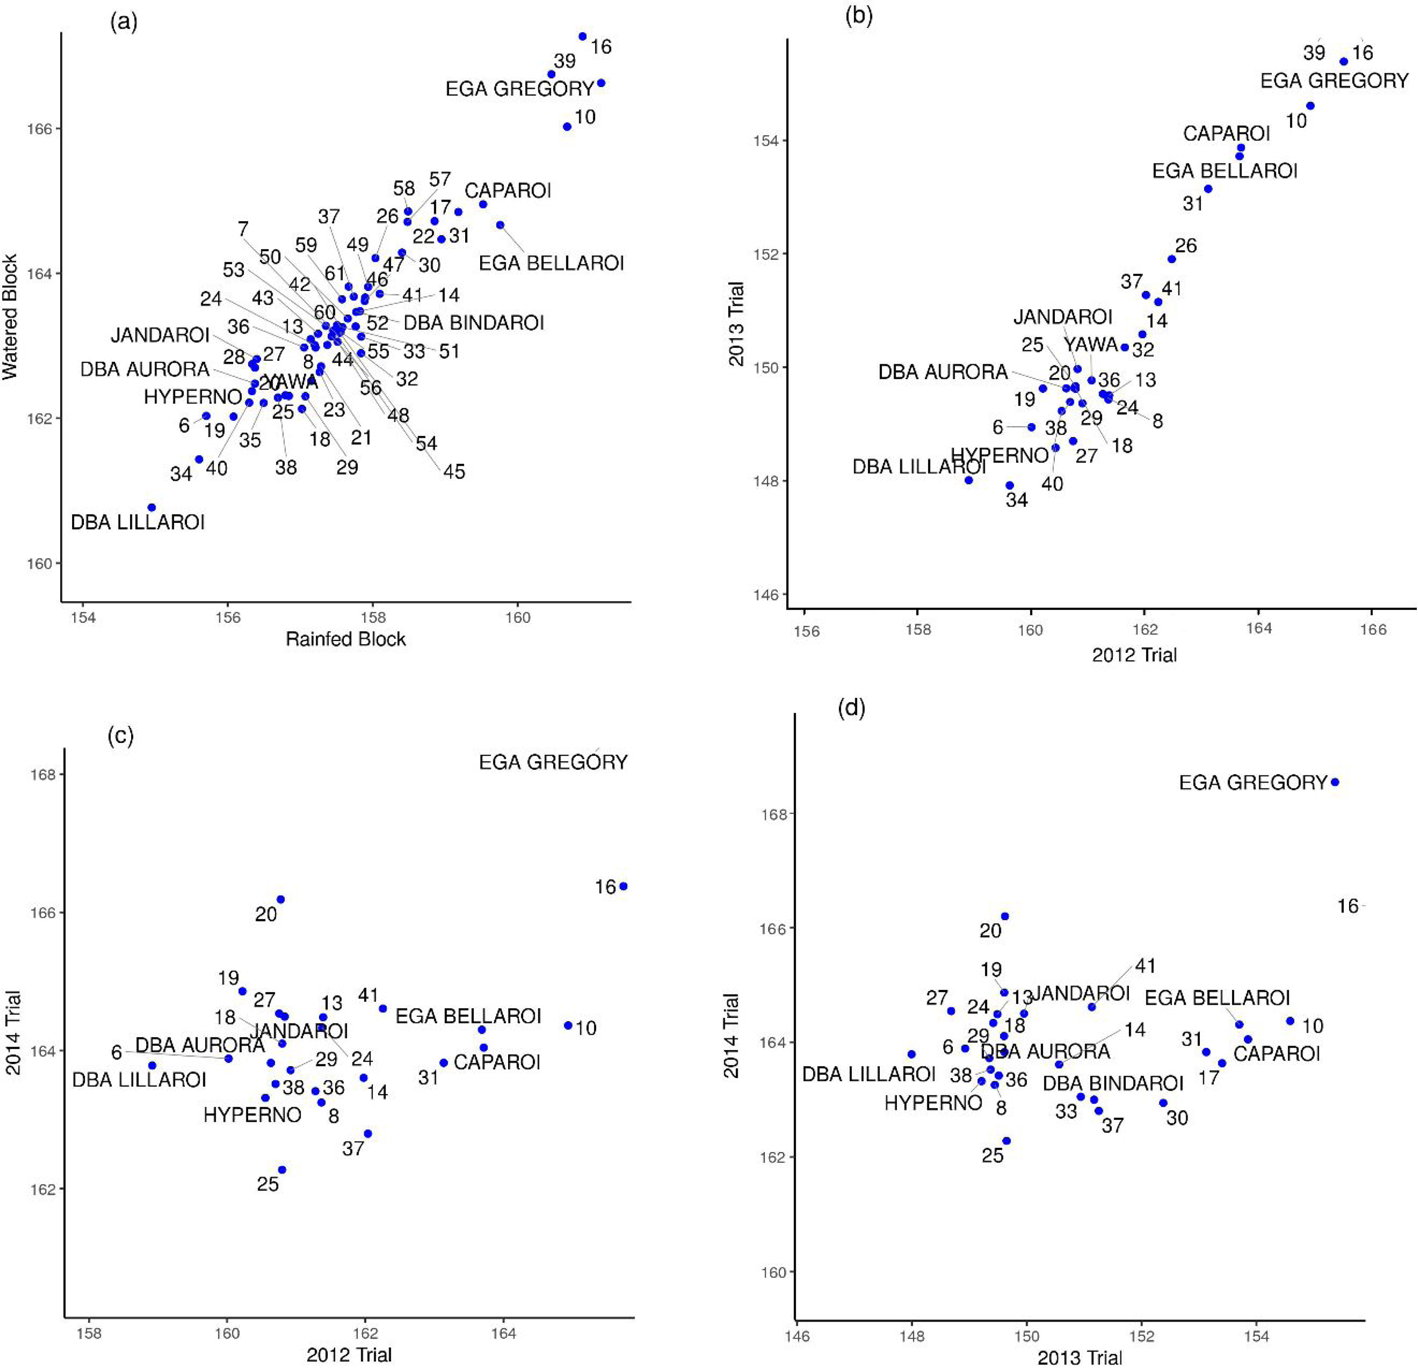
There was a strong correlation between the OP of genotypes for rainfed and watered blocks. There was also a high degree of correlation (Fig. 5a–5d) between trials. The correlation between 2012 and 2013 trials was stronger than that of 2014 trial with 2012 and 2013.
Genetic variation and correlation for plant height (PLHT) across trials and blocks: (a) genotype EBLUPs for rainfed and watered blocks; (b), (c) and (d): genotype EBLUPs of individual trials are shown as pairwise plots. Points are labelled with genotype names (control varieties) or ID numbers assigned to them in Table 1. Points in (b), (c) and (d) relate only to genotypes grown in both trials under consideration.

The bread wheat check EGA Gregory was the tallest line but lines of ICARDA and SA origin were some of the tallest durum lines in these trials. SA released varieties, Hyperno, Yawa and DBA Aurora were taller than all other released durum varieties in the study. The shortest lines, 280572 (19) and 280905 (20) are of NSW origin and all NSW released varieties were shorter than the SA released varieties. Except for 189610-2 (54), the Rht18 lines (52-61) were shorter than the shortest released genotype in the study, Jandaroi.
Harvest index
As commented earlier, the correlation between years for this trait was low but the correlation between watered and rainfed blocks was high.
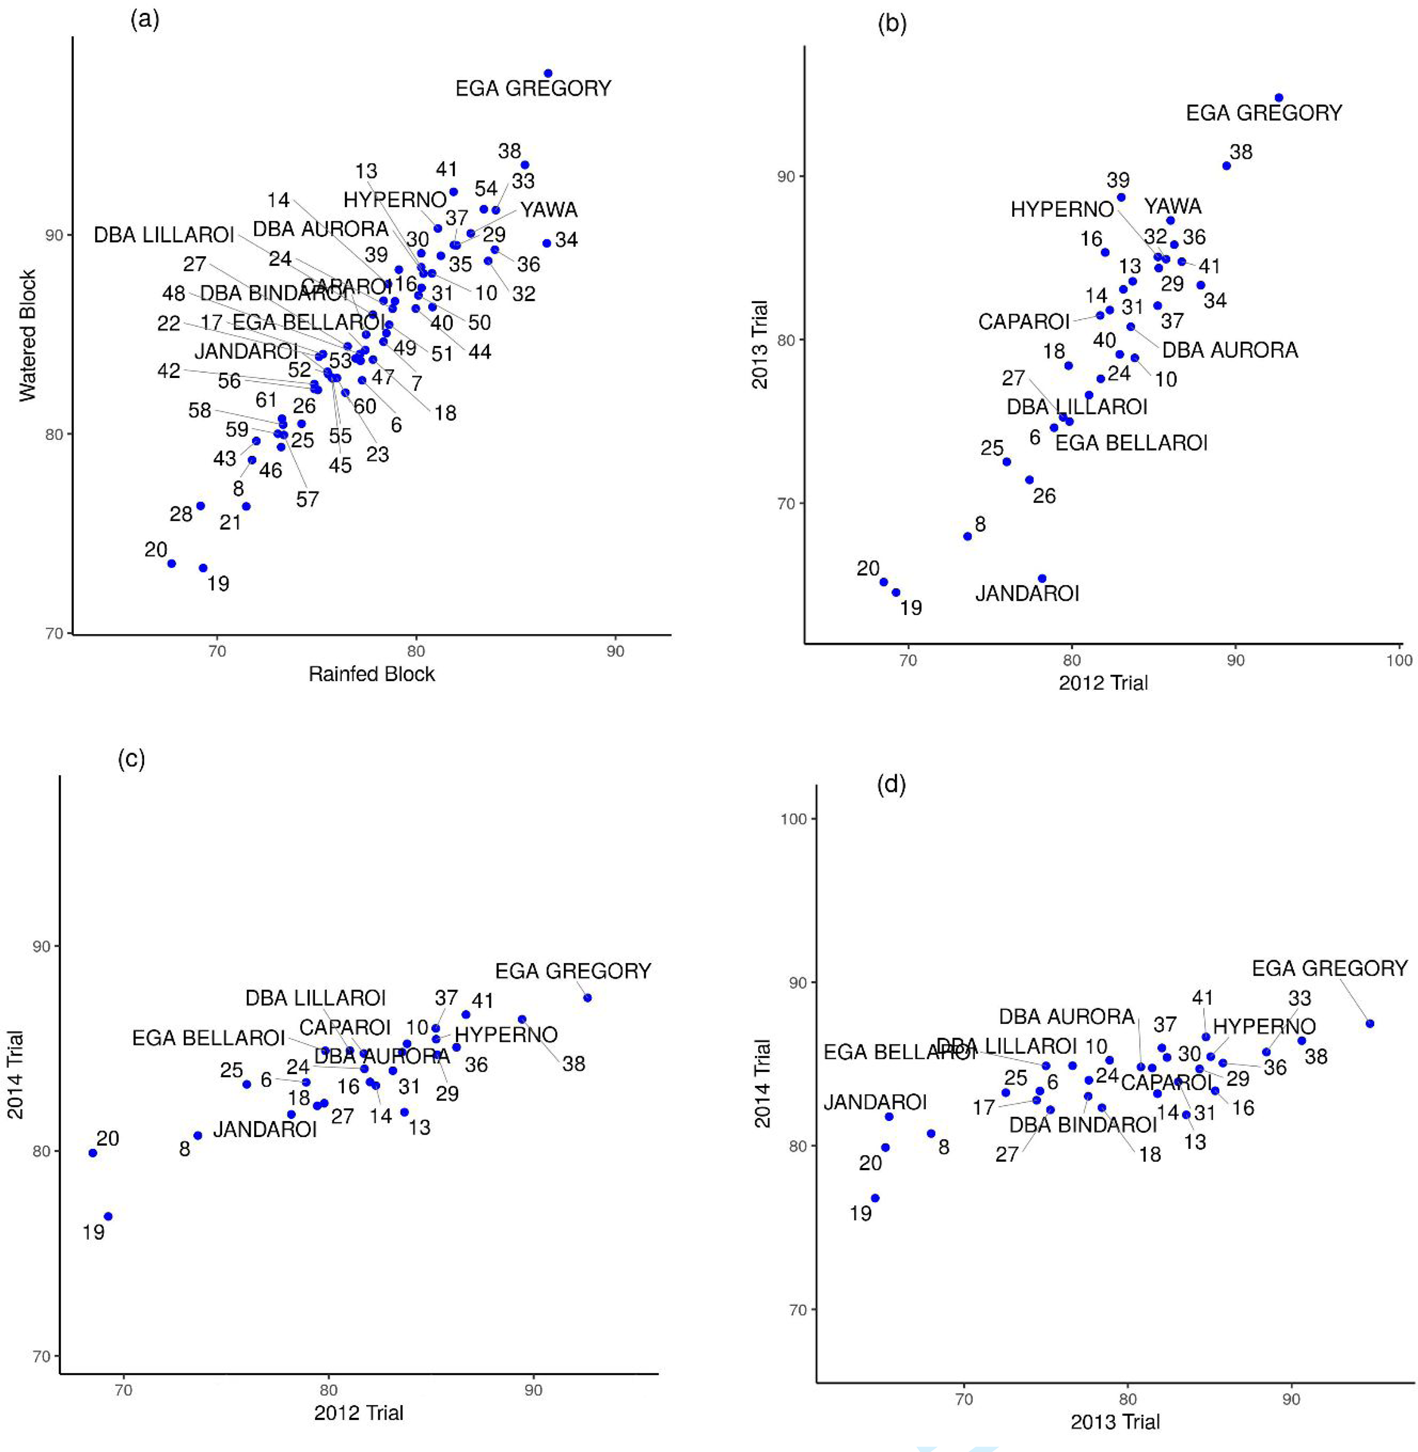
DBA Aurora had the highest HI of all lines. The other high performers for this trait were DBA Bindaroi, 280905 (20), Hyperno, 100991 (36), 188161-3 (43) 290491 (24) and EGA Wylie (16). Out of the two checks, Caparoi showed a higher OP for HI but its performance was substantially lower than that of the above lines. The bread wheat check, EGA Gregory generally showed a poor performance for HI, and it mapped at the bottom of the range of OP values together with EGA Bellaroi. EGA Wylie performed very well in 2012 and 2014 but was a poor performer in 2013.
Grains per square metre
Comparison of data for the number of grains/m2 showed durum varieties to be generally producing a lower number of grains/m2 than EGA Gregory and EGA Wylie (16) although there were some notable exceptions (Fig. 7). Compared to EGA Gregory and EGA Wylie, 101052 (37, a CIMMYT-based SA line), 290491 (24), 280905 (20, both from NSW) as well as Yawa and Hyperno produced a slightly lower but similar number of grains/m2. The high TGW genotypes, 188161-3 (43), 192055-5 (49), DBA Lillaroi, Jandaroi produced a very low number of grains/m2. The high-yielding lines DBA Aurora, 100991 (36) and DBA Bindaroi produced a substantially lower number of grains/m2 than EGA Gregory but these lines were substantially superior to the durum check, Caparoi.
Comparison of performances in 2013 and 2014, showed that many lines performed relatively better in 2013 (Fig. 7b). However, EGA Gregory, 280905 and EGA Wylie were exceptions to this and they produced a very high number of grains/m2 in 2014 but were average in 2013. On the other hand, Zulu (14) performed relatively better in 2013
Days to maturity
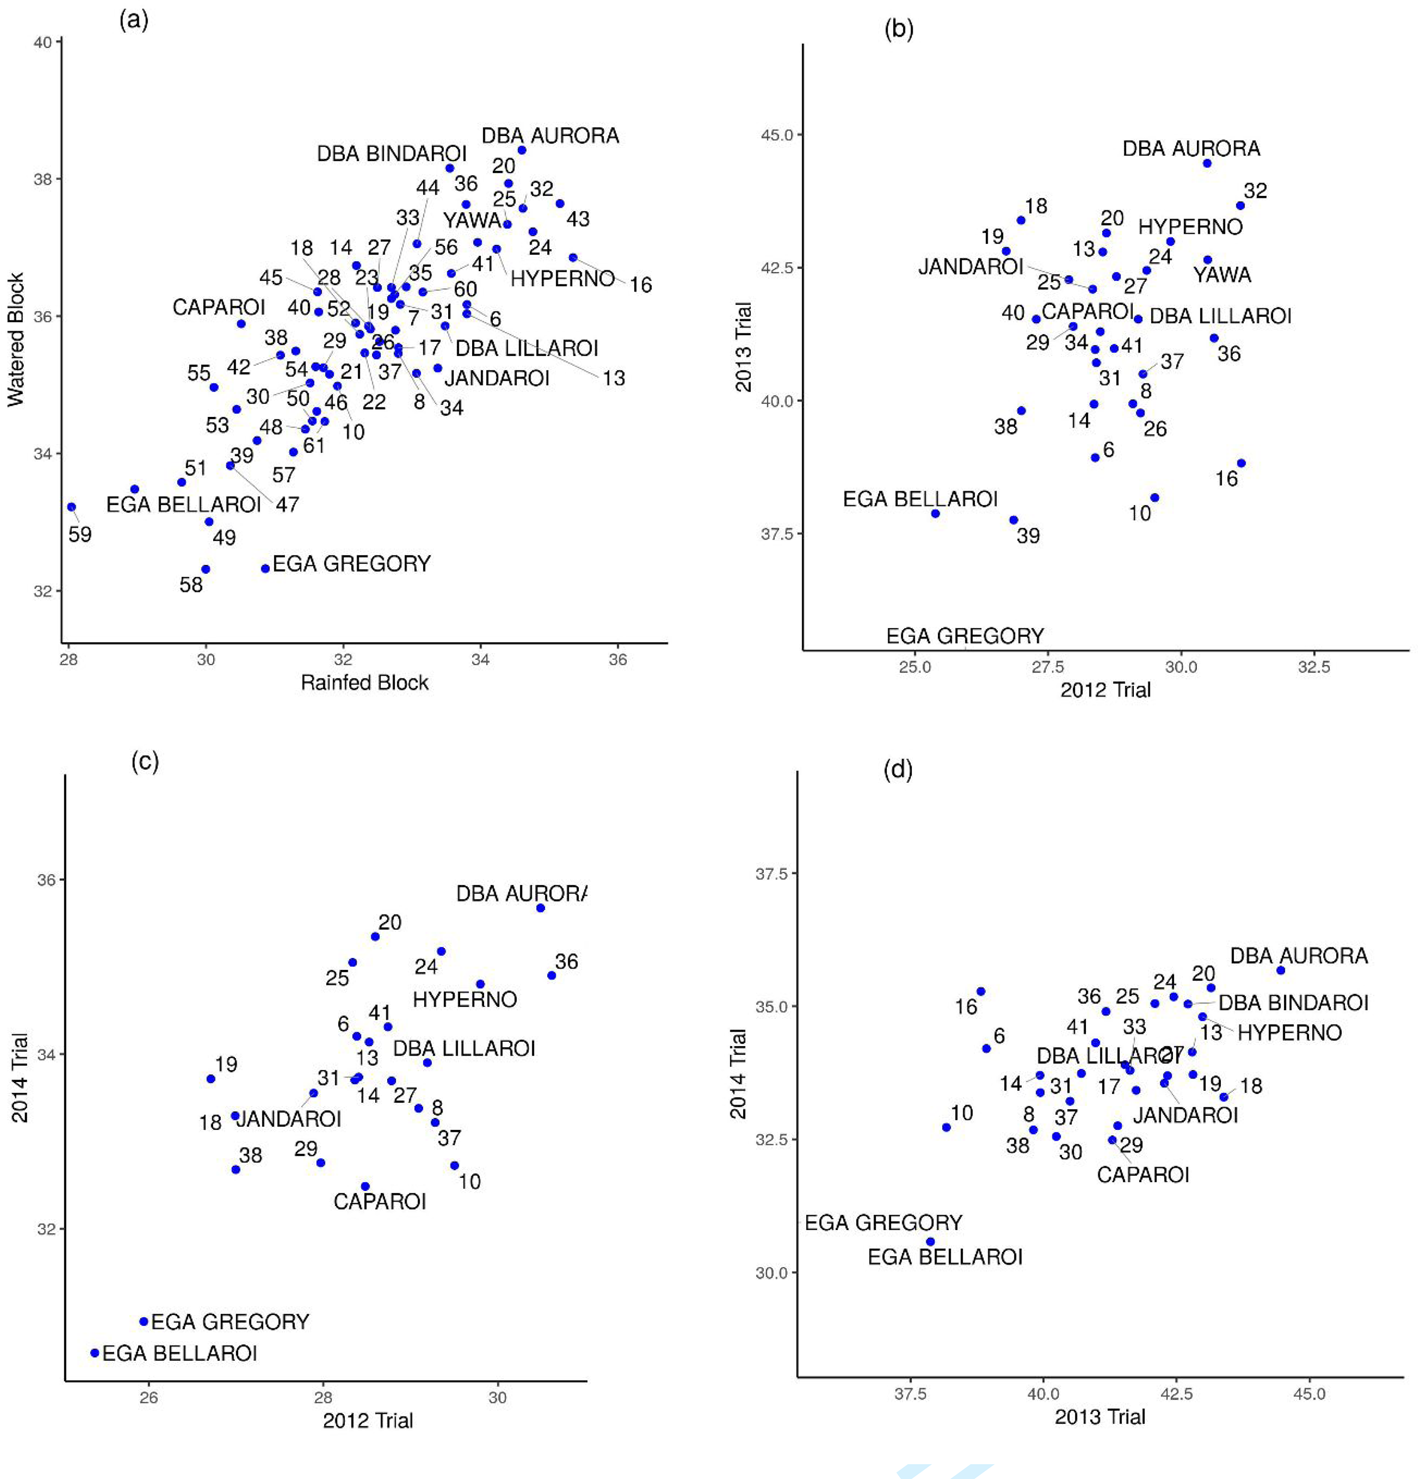
As with several other traits, there was a high degree of correlation between rainfed and watered blocks for DTM in this study. The 2012 and 2013 trials were strongly correlated. However, the 2014 trial did not correlate well with the previous trials (Fig. 6).
Genetic variation and correlation for harvest index (HI) across trials and blocks: (a) genotype EBLUPs for rainfed and watered blocks; (b), (c) and (d): genotype EBLUPs of individual trials are shown as pairwise plots. Points are labelled with genotype names (control varieties) or ID numbers assigned to them in Table 1. Points in (b), (c) and (d) relate only to genotypes grown in both trials under consideration.

Genetic variation and correlation for grains/m2 (GRM2) across trials and blocks: (a) genotype EBLUPs for rainfed and watered blocks; (b): genotype EBLUPs of individual trials are shown as pairwise plots. Points are labelled with genotype names (control varieties) or ID numbers assigned to them in Table 1. Points in (b) relate only to genotypes grown in both the trials.

The bread wheat check EGA Gregory and EGA Wylie (16) were the longest maturing lines (Fig. 6) together with WID101 (39) and Tjilkuri (10). The durum check Caparoi appeared to take as long to ripen as EGA Bellaroi which is an acknowledged late maturing genotype. DBA Bindaroi appeared to be later to ripen than DBA Aurora, Hyperno and Yawa, which take longer to head than DBA Bindaroi (data not presented). DBA Lillaroi was consistently the earliest maturing in all trials. A large majority of the durum lines mapped between Caparoi and DBA Lillaroi for this trait.
Relationships between traits
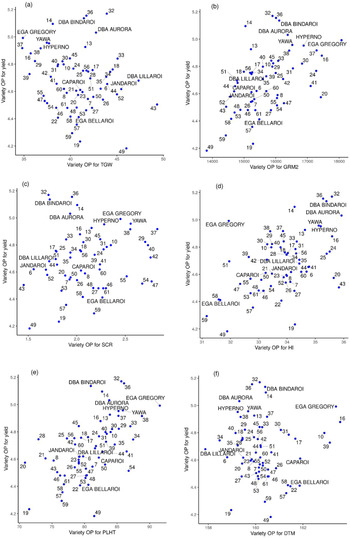
Relationships between yield performance and the other traits are presented for overall EBLUPs (Fig. 9). Whilst no strong relationships were found, some general trends could be identified. There was a negative but weak relationship between yield and TGW (Fig. 9a). The best TGW lines (DBA Lillaroi, Jandaroi, 188161-3 (43) and 190255-2 (49)) were poor yielders. However, DBA Bindaroi, DBA Aurora and 100991 (36) provided a good combination of high overall yield and acceptable TGW. Similarly, a weak positive relationship between yield and SCR was observed with the above best TGW lines also being the best SCR lines with poor yield. Importantly, DBA Bindaroi, DBA Aurora and 100991 also had an interesting combination of low SCR and high yield.
Genetic variation and correlation for days to maturity (DTM) across trials and blocks: (a) genotype EBLUPs for rainfed and watered blocks; (b), (c) and (d): genotype EBLUPs of individual trials are shown as pairwise plots. Points are labelled with genotype names (control varieties) or ID numbers assigned to them in Table 1. Points in (b), (c) and (d) relate only to genotypes grown in both trials under consideration.

Relationship between overall performance (OP) for yield and (a) TGW, (b) GRM2, (c) SCR, (d) HI, (e) PLHT and (f) DTM in durum genotypes and bread wheat checks grown in 2012–2014 MEF trials.

The yield was strongly and positively related to GRM2 (Fig. 9b). However, the high yielding lines, DBA Bindaroi, 100991 (36), 101042 (32) and Zulu (14) did not show a high expression for GRM2.
The graph of overall yield against HI showed that the high yielding genotypes generally also had high HI (Fig. 9d). The bread wheat check, EGA Gregory, was an exception as it yielded fairly well whilst its HI was lower than a majority of the durum lines.
PLHT was positively related to yield (Fig. 9e) with DBA Bindaroi providing the best exception. The relationship between yield and DTM (Fig. 9f) was weak but the highest yielders were medium in their maturity time. The two bread wheats, EGA Gregory and EGA Wylie (16) were the longest maturing lines in the trial but were reasonably high yielding.
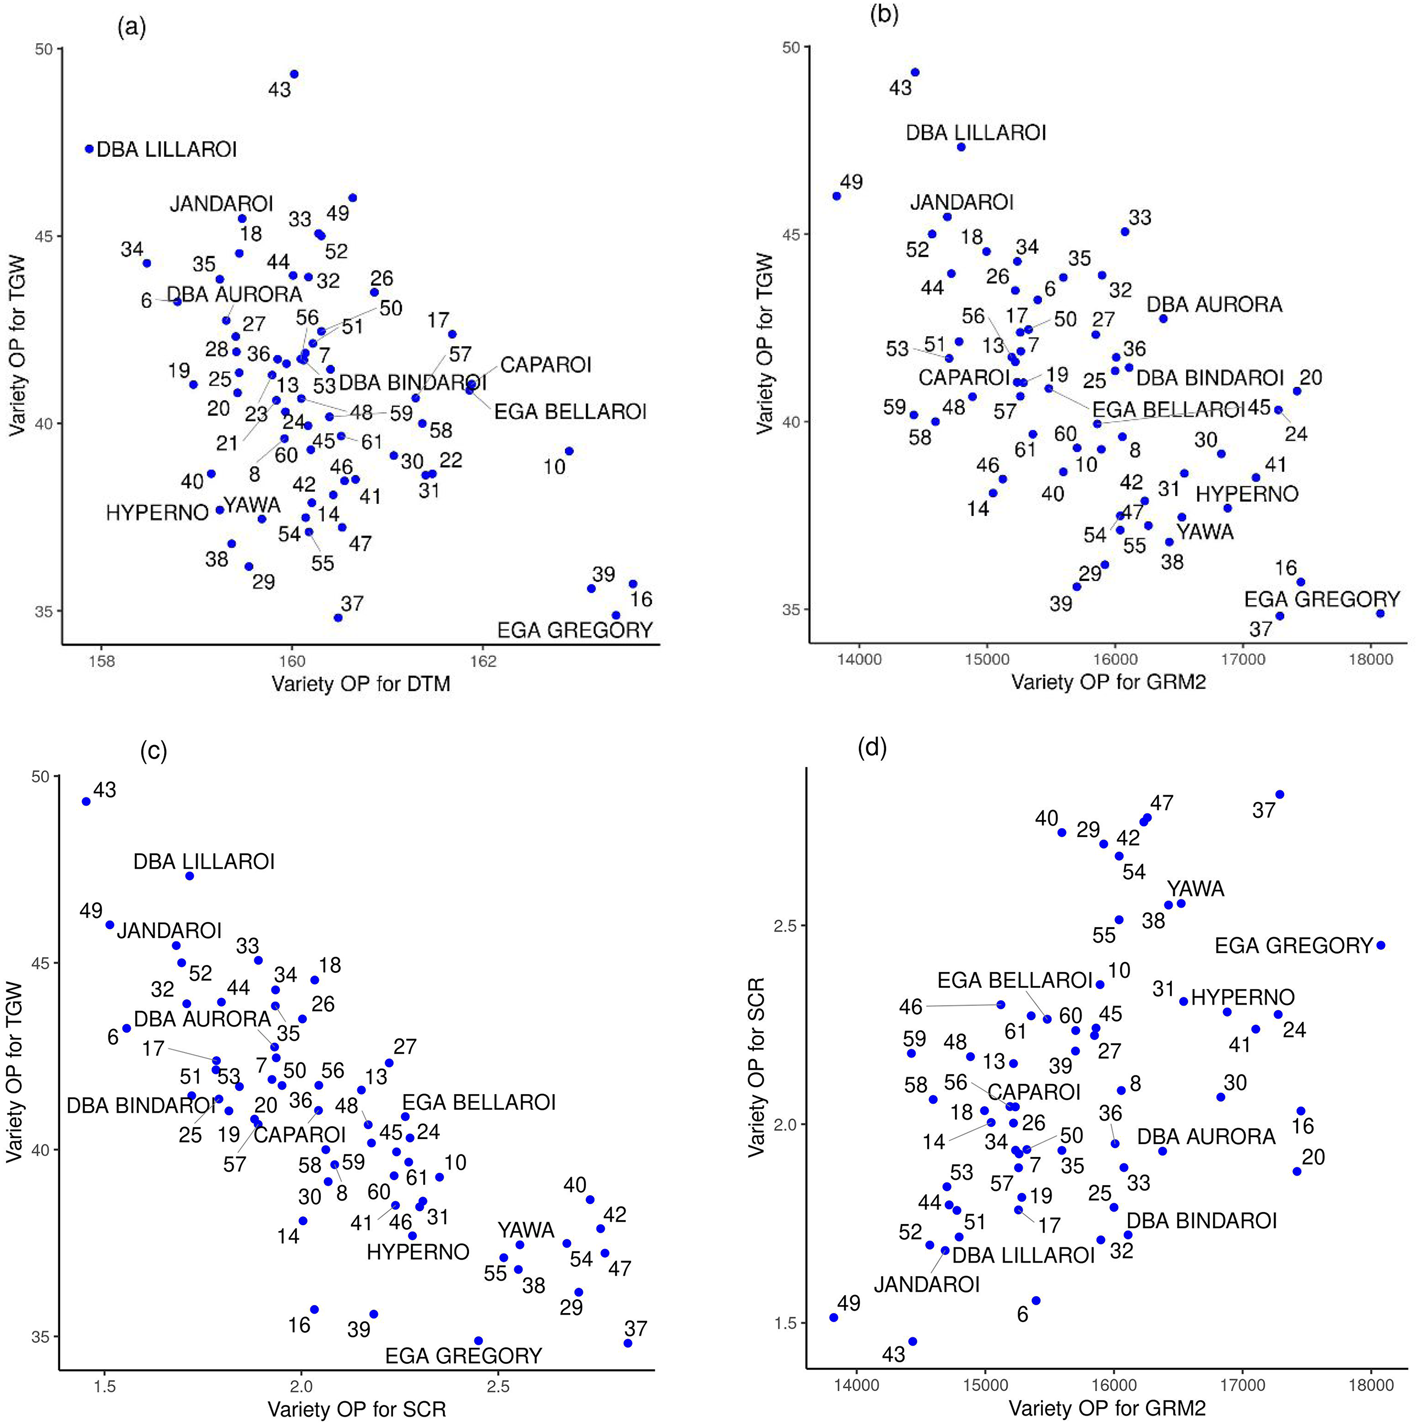
TGW showed a negative relationship with DTM, GRM2 and SCR (Fig. 10a–10c). The relationship between TGW and SCR was relatively strong but the relationships with DTM and GRM2 were weak. The relationship between SCR and GRM2 was positive with line 101052 (37) showing the highest SCR and high GRM2. Amongst the released varieties, DBA Bindaroi had the best combination of GRM2 and low SCR.
Relationship between TGW and (a) DTM, (b) GRM2, (c) SCR and (d) the relationship between SCR and GRM2 in durum genotypes and checks grown in 2012–2014 MEF trials.

Discussion
The experiments in this study were conducted at the MEF at Narrabri. As mentioned in the Materials and Methods section, the experimental design employed within the MEF did not involve proper replication of the irrigation regimes, either within or across trials (since the watered/rainfed block was always the western block within the facility). This meant that any apparent effects associated with irrigation regimes, including interactions with genotype (a key aspect of the study), had to be interpreted with caution as they may have been due to other physical differences between the blocks on which they were applied. This has been recognized by referring to, for example, ‘genotype by irrigation block’ effects. The rationale of the MEF approach was to mimic long-term regional environments, as much as possible, by managing a range of conditions in these sites to enable meaningful phenotyping and enable the identification of most relevant traits and/or parent lines, for crop improvement. This can only be achieved, however, with the use of experimental designs that provide a valid inferential framework. A split plot or a strip plot design would have been ideal for this work but the irrigation equipment available for this work was a large lateral move overhead irrigation system, which watered the entire irrigated block in one pass, and it precluded the use of such designs.
For some traits (GRM2 and DTM), there was little correlation between results from 2014 and the previous years. This could have been due to differences in temperature patterns, which could have affected the phenological development of the plants (Fig. 1, Table 4 and Fig. 8). The year 2014 was cooler from July to September and warmer from October to November in contrast to 2013 which was warmer from July to September and cooler in the October to November period. Also, unlike the previous seasons, there was good rain in August 2014.
The high estimated genetic correlations between irrigation blocks for most of the traits implied there was very little interaction between genotypes and irrigation blocks. It is likely that these high genetic correlations could be due to the level of yield in the rainfed blocks being relatively high (in the 3–4 t/ha range) which was most likely due to the good starting stored moisture levels in the fertile grey clay soils. The results could have been different if the yields were much lower as suggested by Ceccarelli (Reference Ceccarelli1989). These results suggest that selection for productivity in rainfed conditions could also result in productivity under watered conditions but further research using a valid inferential framework is required to confirm this. However, considering there is no targeted breeding work for the irrigated durum industry this is an important result.
In this study, we added newly developed promising germplasm and/or new higher-yielding genotypes to the trials every year. However, there was only a fixed amount of trial space that was available in the MEF site. This is why a portion of the genotypes was tested just for one season. However, the genotypes (except for some older released varieties) were from the Stage 4 multi-environment breeding trials conducted in the DBA durum breeding program and the predictions in this work are in line with results from the DBA data.
High yield and high grain quality in durum wheat
The durum genotypes in this study were competitive with the bread wheat yield benchmark, EGA Gregory, and the durum benchmark, Caparoi. For almost all the traits studied, with the exception of GRM2 (for watered blocks) and DTM, EGA Gregory mapped in the middle or lower portion of the distribution with several durum breeding lines and released varieties performing better for each of the traits in both rainfed and watered blocks.
The superior yield of several durum lines compared with the bread wheat check was established in a MET analysis covering both watered and rainfed blocks. This result is consistent with the observation that durum is generally the best yielding crop in Northern NSW, particularly in the Liverpool and Moree Plains regions, under average conditions (Kadkol and Sissons, Reference Kadkol, Sissons, Wrigley, Corke, Seetharaman and Faubion2016). Whilst the dominance of the benchmark variety, EGA Gregory, in Queensland and northern NSW has reduced significantly in the recent years, it continues to be a significant APH variety (Anonymous, 2018) and it generally appears to perform competitively in National Variety Testing in the region (http://www.grdc-nvt.com.au) and thus remains a useful benchmark variety.
In terms of drought adaptation, the performance of several durum varieties and breeding lines in rainfed blocks confirmed the superiority of the durum germplasm relative to the bread wheat and durum checks. All three seasons of this project were characterized by no effective rainfall (the Vertosols in Narrabri require in excess of 10 mm rain per rainfall event to produce a significant difference to moisture status) in the September/October period (Fig. 1), which generated terminal drought in the rainfed blocks. Whilst terminal droughts were not severe (as the crops started with good soil moisture), better performance of durum lines under these conditions still confirmed their superior drought tolerance. Similar results indicating genetic variation for durum adaptation to pre-anthesis drought were reported by Liu et al. (Reference Liu, Searle, Mather, Able and Able2015). High level of drought tolerance was also observed in trials conducted in drier Western NSW locations such as Coonamble, Walgett and Trangie (Kadkol et al., Reference Kadkol, Sissons, Gardner, Brooke, Jenkins and Harden2014), where released NSW varieties, Jandaroi, DBA Lillaroi and DBA Bindaroi produced high yields combined with low screenings and high grain protein in 2013 and 2014 seasons.
No specific adaptations for watered conditions were observed and there was a high degree of correlation between watered and rainfed blocks (as commented earlier), although EGA Bellaroi, has historically produced excellent yields in wet seasons (e.g. NVT 2010 and 2016, http://www.grdc-nvt.com.au) whilst being a poor yielder in dry seasons.
Promising lines for use in breeding
All germplasm groups contained high yielding genotypes e.g. 101042 (ICARDA), 100991 (SA/CIMMYT), DBA Bindaroi (NSW), Zulu (AGT/CIMMYT), DBA Aurora and Yawa, (SA). However, some of these lines had higher SCR and lower TGW. Screenings is a key trait that decides the price of the durum grain under the Australian grain classification system (Anonymous, 2018). Higher levels of screenings result in lower milling and semolina yield because shrunken, small grains have less starch (Sissons et al., Reference Sissons, Ovenden, Adorada and Milgate2014). In trade, grain exceeding 5% screenings is downgraded to DR3 grade (www.graincorp.com.au/_literature_173743/Durum_GrainCorp_Standards_2016-17) regardless of the protein content. This could lead to a substantial loss of income to the growers because the price difference between DR1 and DR3 grades could be in excess of 10% (N. Eather, GrainCorp, personal communication). Therefore, the high yield of the ICARDA, CIMMYT and SA lines needs to be combined with higher quality in terms of higher TGW, lower SCR and some traits that were not included in this study, such as, higher grain protein, higher semolina yellow colour, etc (unpublished data).
In terms of grain quality, the best lines tested came from NSW. But, as a group, they were generally lower yielding than the SA, CIMMYT and ICARDA origin lines with some notable exceptions including DBA Bindaroi. Most NSW lines showed lower screenings than Caparoi which was the best check for the trait in both rainfed and watered blocks. In particular, Jandaroi and DBA Lillaroi have consistently shown low screenings and high TGW over many years in internal DBA trials (Kadkol et al., Reference Kadkol, Sissons, Gardner, Brooke, Jenkins and Harden2014) as well as in NVT testing (http://www.grdc-nvt.com.au). Results presented in this study are consistent with these observations. Additionally, this study has identified 188161-3 and 190255-5, derived from crosses with Icaro, as likely sources of further improvements in SCR and TGW. Intercrossing to combine high yield of the SA, CIMMYT and ICARDA lines with the high quality of NSW lines could be the best way forward to develop better durum varieties for the Australian durum industry.
Whilst the performance of the best Rht18 lines for yield was similar to Caparoi, it was interesting that the genotypes demonstrated effective height reduction due to Rht18. Further breeding to enhance yield and adaptation of this material could be worthwhile considering other traits, such as longer coleoptile length (Condon et al., Reference Condon, Hare and Rebetzke2004) that this material could offer.
Trait interrelationships and prospects for improving yield and quality
Overall, there were positive relationships between yield and PLHT, HI and GRM2. The best yielding lines generally tended to be tall, possessed a high HI and smaller grains. The relationship between PLHT and yield could be due to SA, CIMMYT and ICARDA genotypes being taller in stature. The relationship of yield with TGW was weak in this study although some high yielding genotypes in this study possessed smaller grains (e.g. Yawa) and the high TGW genotypes from the Northern DBA group were all relatively lower yielding. The high yielding genotypes tended to show high GRM2 which was in agreement with the observation by Royo et al. (Reference Royo, A´lvaro, Martos, Ramdani, Isidro, Villegas and Garcı´a del Moral2007) that, higher yield in modern Italian and Spanish durum varieties was due to higher grain number relative to older varieties. Similar results were reported in bread wheat by Dolferus et al. (Reference Dolferus, Xuemei and Richards2011). GRM2 in turn had a weak negative relationship with TGW (Fig. 8b) and a weak positive relationship with SCR in this study.
The NSW cohort typically had higher grain weight combined with lower GRM2 and low SCR. By contrast, the South Australian, ICARDA and CIMMYT genotypes typically possessed a higher GRM2, but had relatively lower TGW and were prone to higher SCR. However, substantial genotypic variability was observed for these traits and some genotypes combined high grain number per spike with relatively high (or similar to the durum check) TGW (e.g. DBA Aurora, DBA Bindaroi, 280905, 290491, 100991). On the basis that the interrelationships between yield, GRM2, TGW and SCR were weak and the observed variation for these trait combinations among the genotypes, it appears possible to develop high yielding lines by optimising TGW and maintaining SCR whilst increasing GRM2 as evidenced by the development of lines such as DBA Aurora and DBA Bindaroi. This observation is also consistent with Royo et al. (Reference Royo, A´lvaro, Martos, Ramdani, Isidro, Villegas and Garcı´a del Moral2007) who reported improved GRM2 and HI in modern Spanish and Italian durum varieties without affecting TGW.
Whilst all the genotypes (except for the Rht18 lines) possessed the Rht-B1 dwarfing gene, there was significant variation for PLHT between the germplasm groups and there was a positive relationship between PLHT and yield. This observation suggested that it could be possible to improve yield by breeding for ‘taller dwarfs’ (Gale et al., Reference Gale, Marshall, Gregory and Quick1981), provided lodging is not an issue. The NSW germplasm, which is typically of shorter stature and good lodging tolerance (unpublished data), could be improved for yield by crossing with the taller and higher-yielding Southern DBA, CIMMYT and ICARDA germplasm groups (Fig. 7e) and selecting for taller types whilst avoiding lodging susceptible lines.
In conclusion, the durum germplasm evaluated in this study contains substantial variation for yield and other agronomic traits, which can be exploited to develop varieties that perform well under both watered and rainfed conditions. Genotypes from SA, CIMMYT and ICARDA germplasm groups could be used to improve the NSW germplasm for productivity whilst maintaining grain quality. The results discussed in the study offer a physiological framework for improving the yield potential of the NSW germplasm by selecting for higher biomass lines with higher grain number, whilst maintaining lodging tolerance, grain, semolina and pasta making quality. The results also suggest that durum wheat is a good, competitive, alternative crop to bread wheat, due to its higher yield potential.
Supplementary material
The supplementary material for this article can be found at https://doi.org/10.1017/S0021859620000817
Acknowledgements
The authors gratefully acknowledge the assistance provided by the MEF site managers, Dr Angela Pattison and her team members at the Narrabri MEF, The University of Sydney and the DBA North Program team. We also acknowledge marker results for the genotypes from crosses with Icaro from the late Dr Genet Mekuria, Mr. Allan Binney and Prof. Diane Mather.
Financial support
Funding for this study was provided by the Grains Research and Development Corporation (projects DAN000162 (G. Kadkol) and UQ00064 (Karine Chenu)).
Conflicts of interest
The authors declare there are no conflicts of interest.
Ethical standards
Not applicable