I. INTRODUCTION
Knowledge of the mechanisms by which plastic deformation occurs is the key to improving structural materials and pushing them to their performance limits. Although continuum descriptions of plasticity are well suited to describing the bulk mechanical response of materials, plastic deformation at small scales is often dominated by discrete events that are not yet well understood (e.g., dislocation processes, surface interactions, and test geometry effects).Reference Uchic and Dimiduk1–Reference Pharr, Herbert and Gao10 Experimental methods for characterizing and observing small-scale deformation phenomena have advanced significantly in recent years, largely as a result of new in-situ mechanical testing methods (see, e.g., Gianola and EberlReference Gianola and Eberl11). However, our understanding of the mechanisms of small-scale plasticity is still at an early stage and requires further experimental observations, microstructural analyses, and development of new models that can account for the discrete and often stochastic nature of the deformation.
This work reports new observations of the tensile mechanical behavior of Mo-alloy single-crystal fibers with dimensions in the submicron range. Although the compressive deformation behavior of this material has been examined in previous studies,Reference Bei, Shim, George, Miller, Herbert and Pharr12, Reference Bei, Shim, Pharr and George13 tension differs from compression in several important respects, in particular, the failure modes associated with fracture and plastic instability and their influences on the stress–strain behavior. As in previous examinations of the compression behavior of small pillars of this material,Reference Bei, Shim, George, Miller, Herbert and Pharr12, Reference Bei, Shim, Pharr and George13 the fibers were produced by directional solidification of a Mo–NiAl eutectic and subsequently extracted from the matrix by selective chemical etching. For pillar sizes ranging from 360 to 1000 nm (the fibers had nearly square cross sections, therefore size refers to the length of a side), Bei et al.Reference Bei, Shim, George, Miller, Herbert and Pharr12 showed that the as-grown Mo pillars exhibit extraordinary strengths of about 10 GPa (maximum shear stress of 5 GPa). This is very close to the theoretical strengthReference Ogata, Li, Hirosaki, Shibutani and Yip14 and suggests that the pillars are dislocation free. Subsequent scanning transmission electron microscopy (STEM) studies by Sudharshan Phani et al.Reference Phani, Johanns, Duscher, Gali, George and Pharr15 showed that this is indeed the case, although it was also found that dislocations can occasionally be found in some of the fibers when a long segment is examined (∼100 μm). After yielding, the specimens undergo rapid plastic deformation in a manner consistent with the strain softening that would result from the nucleation and rapid multiplication of dislocations at stresses near the theoretical strength. Lowry et al.Reference Lowry, Kiener, LeBlanc, Chisholm, Florando, Morris and Minor16 recently reported similar observations for annealed, dislocation-free, pure Mo pillars with diameters of about 100 nm. They confirmed the initial absence of dislocations and examined the dislocation nucleation processes by means of in-situ transmission electron microscopy (TEM).
Another attractive feature of the directionally solidified Mo-alloy fibers is that they can be prestrained in the NiAl matrix to alter the starting dislocation structure from essentially dislocation-free to dislocation densities in excess of 4.4 × 10¹³ m−2.Reference Phani, Johanns, Duscher, Gali, George and Pharr15 Bei et al.Reference Bei, Shim, Pharr and George13 showed that prestraining the NiAl–Mo composite before pillar testing results in dramatic decreases in yield and flow strength. Pillars with 11% prestrain exhibited size-independent yield strengths of about 1 GPa followed by stable work hardening and very little scatter for sample sizes ranging from 360 to 1500 nm. The low strengths, as compared to those of the as-grown pillars, were attributed to a high dislocation density, as later confirmed by electron microscopy.Reference Phani, Johanns, Duscher, Gali, George and Pharr15 On the other hand, pillars with only 4% prestrain were weaker than the as-grown pillars, but exhibited an increase in strength for smaller pillars, in addition to a pronounced increase in scatter and stochastic behavior. Bei et al.Reference Bei, Shim, Pharr and George13 proposed that the scatter increases when the pillar size is on the order of the dislocation spacing, in which case the number of dislocations would be very limited and the behavior would depend sensitively on the specific nature of the dislocations and their slip geometry. However, subsequent STEM examination of the 4% prestrained fibers showed that the scatter is due to large spatial variations in the local dislocation density; some fibers were essentially dislocation-free, whereas others had a very high density.Reference Phani, Johanns, Duscher, Gali, George and Pharr15 Thus, the increased scatter for the 4% prestrained pillars is not due to the statistics associated with a small number of dislocations in the test volume, but rather to large spatial inhomogeneities in the starting dislocation structure.
In this paper, we present new experimental results that help to advance our understanding of the mechanisms of small-scale deformation and plasticity in the Mo-alloy fibers. The observations were made by conducting in-situ tensile tests in a high-resolution dual beam focused ion beam (FIB) and scanning electron microscope (SEM). A micromanipulator was used for harvesting individual fibers which were cut with the FIB and attached to the mechanical testing platform using electron beam-induced deposition. The nanomechanical testing system used in this study (Hysitron Incorporated, Minneapolis, MN) is, in principle, displacement controlled through PID feedback and can thus be used to examine strain-softening behavior, which is thought to play a key role in the deformation behavior of the as-grown fibers.Reference Bei, Shim, George, Miller, Herbert and Pharr12 The SEM was used to directly observe important deformation events and correlate them with features in the stress–strain curves. Results of the new tensile tests are compared to the pillar compression results of Bei et al.Reference Bei, Shim, George, Miller, Herbert and Pharr12, Reference Bei, Shim, Pharr and George13 and interpreted in light of the STEM microstructural characterization of Sudharshan Phani et al.Reference Phani, Johanns, Duscher, Gali, George and Pharr15 We also report results of a brief study of the influence of localized Ga+ ion damage induced by rastering the FIB on a small region of the gauge section of the as-grown fibers in the SEM chamber just before tensile testing. These results shed some light on the possible role that FIB damage may play in the mechanical behavior of FIB-prepared samples.Reference Greer, Oliver and Nix2, Reference Maaß, Van Petegem, Borca and Van Swygenhoven17–Reference Greer and Nix19
II. EXPERIMENTAL METHODS
A. Material description
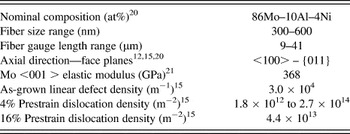
The fibers were <001> single crystals with a nominal composition of 86Mo–10Al–4Ni (at.%) made by etching away the matrix of a directionally solidified NiAl–Mo eutectic.Reference Bei and George20 A complete description of the growth technique and microstructure has been provided by Bei and George.Reference Bei and George20 Prestraining, which resulted in a significant change in the dislocation structure,Reference Phani, Johanns, Duscher, Gali, George and Pharr15 was accomplished by compressing the NiAl–Mo eutectic in the growth direction to engineering strains of 4 and 16%. The fibers, which were extracted from the NiAl matrix with an 80H20–10HCl–10H2O2 solution (vol%), were from the same batch of material whose dislocation structures were examined by Sudharshan Phani et al.Reference Phani, Johanns, Duscher, Gali, George and Pharr15Table I lists the fibers’ nominal composition,Reference Bei and George20 range of sizes, gauge lengths, orientations,Reference Bei, Shim, George, Miller, Herbert and Pharr12, Reference Phani, Johanns, Duscher, Gali, George and Pharr15, Reference Bei and George20 elastic modulus of Mo in the <001> direction,Reference Dickinson and Armstrong21 and dislocation densities.Reference Phani, Johanns, Duscher, Gali, George and Pharr15 The dislocation densities varied from 3 × 10⁴ m−1 for the as-grown material to 4.4 × 10¹³ m−2 for the 16% prestrained fibers.Reference Phani, Johanns, Duscher, Gali, George and Pharr15 The methods for measuring the dislocation densities are described elsewhere.Reference Phani, Johanns, Duscher, Gali, George and Pharr15 A linear defect region density (i.e., the number of defect regions per unit length) was used to characterize the as-grown fibers because it provided a more accurate portrayal of the defect distribution than the standard dislocation density (i.e., the number of dislocations per unit area). In the as-grown fibers, dislocations were observed to be clustered in small groups separated on average by 37 μm of dislocation-free material.Reference Phani, Johanns, Duscher, Gali, George and Pharr15 A total of nineteen as-grown, eight 4% prestrained, and eleven 16% prestrained individual fibers were tested. Those that failed at or near the grip sections were sometimes remounted and tested again.
Mo-alloy fiber properties.

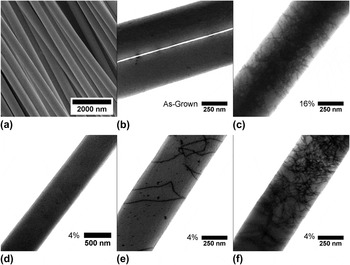
An SEM image of the as-grown Mo-alloy fibers is given in Fig. 1(a). STEM images of representative dislocation structures are shown in Fig. 1(b) (as-grown), Fig. 1(c) (16% prestrain), and Figs. 1(d)–1(f) (4% prestrain). For the intermediate prestrain (4%), the dislocation structures varied considerably from one fiber to the next, so three separate regions are shown.
Electron-microscope images of the Mo-alloy fibers tested in this study: (a) scanning electron microscope (SEM) image of as-grown Mo-alloy fibers extracted from the NiAl matrix; (b) scanning transmission electron microscopy (STEM) image of an as-grown fiber; (c) STEM image of the 16% prestrained fibers showing the high dislocation density; (d)–(f) STEM images of the 4% prestrained fibers showing the inhomogeneous distribution of dislocation densities.

B. Testing equipment
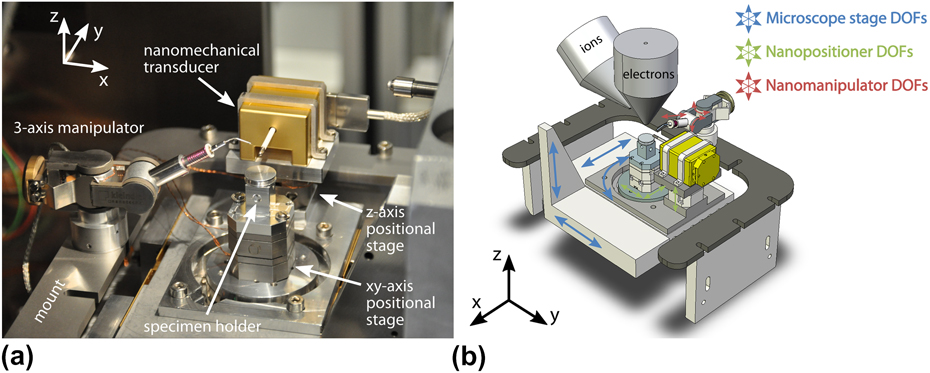
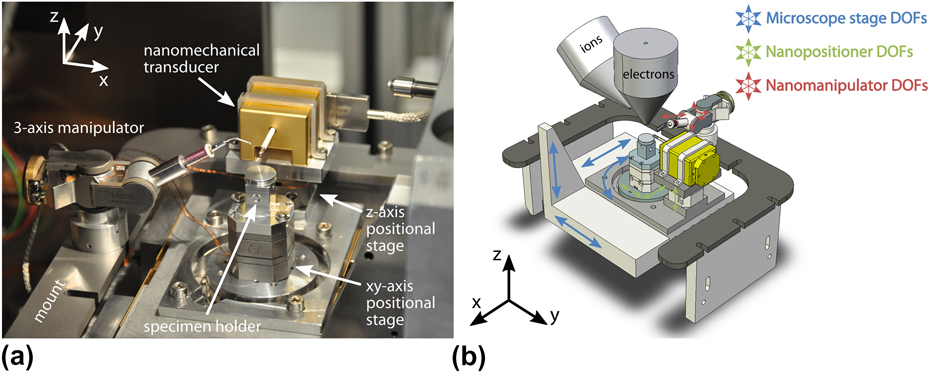
Tensile tests were conducted in a FEI Nova Nanolab 200 dual beam FIB/SEM (FEI, Eindhoven, Netherlands) equipped with a Pt-organometallic gas for attaching the specimens to the grips. The tensile testing apparatus, which is shown in Fig. 2, was mounted entirely inside the FIB/SEM. The primary components of the apparatus were nanopositioners with degrees of freedom in x, y, and z (Attocube Systems AG, München, Germany), a MM3A-EM 3-axis nano-manipulator to move, position, and manipulate the fibers (Kleindiek Nanotechnik GmbH, Reutlingen, Germany), and a nanomechanical transducer (Hysitron Incorporated). The transducer was used to apply tensile forces and measure tensile displacements. Therefore, the fiber was attached to a transducer mounted tip that had a diamond cube at its end. A Si cantilever was used for gripping the fiber at the other end. It was attached to a specimen holder mounted on the z-axis positional stage, which was in turn mounted on the x–y nanopositioner. This combination allowed the operator to pick up, move, align, and attach fibers to the grips in situ. A more detailed description of the test equipment has been given by Gianola et al.Reference Gianola, Sedlmayr, Monig, Volkert, Major, Cyrankowski, Asif, Warren and Kraft22
(a) The nanomechanical system used to perform tension testing in situ in the focused ion beam (FIB)/SEM; (b) a schematic showing the orientation of the electron and ion beams with respect to the test system, as well as the degrees of freedom of movement in the FIB/SEM chamber.
C. Fiber mounting
Fibers were mounted in a manner similar to that described in Gianola et al.Reference Gianola, Sedlmayr, Monig, Volkert, Major, Cyrankowski, Asif, Warren and Kraft22 Most of the as-grown fibers and all of the 4% and 16% prestrained fibers were lifted from holey carbon TEM grids on which the fibers had been deposited by dispersion in alcohol.Reference Phani, Johanns, Duscher, Gali, George and Pharr15 A few as-grown fibers were taken directly from a side of an etched composite perpendicular to the growth direction.
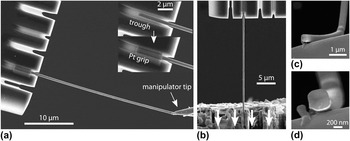
Figure 3 provides a pictorial summary of the mounting process. Trenches were FIB milled on both the Si cantilever and the diamond tip to provide better adherence after Pt deposition. Each fiber was first carefully positioned so that it would lie inside the trench in the silicon cantilever [Fig. 3(a)], and Pt was deposited with the electron beam at the fiber ends to hold the sample in place [Fig. 3(b)]. The fibers were then cut free from the manipulator with the ion beam, and the process repeated for attachment to the transducer. Before testing, the fiber gauge length after welding was measured in addition to measurements of the fiber size at multiple locations along the length. The regions of the fiber damaged by the FIB due to cutting (i.e., the ends of the fiber) were not within the gauge length and therefore not likely to affect the mechanical behavior. Fibers were generally found to be square in cross section with rounded corners, but occasionally rectangular cross sections were observed. For this reason, after testing, fibers were bent with the manipulator so that the fracture surface could be imaged when possible, as shown in Figs. 3(c) and 3(d). After imaging, the ion beam was used to section the fiber at a location away from the fracture to accurately measure the cross-sectional area.
A pictorial representation of the fiber mounting procedure, final test configuration, and postmortem analysis. (a) Trenches were FIB milled in both the silicon cantilever and the diamond platen attached to the load–displacement transducer. A fiber was positioned with the manipulator so that it would lie inside a trench in the silicon cantilever. Pt was then deposited to attach the fiber to the silicon. (b) The final test configuration showing the direction of platen motion. (c, d) Postmortem analysis including fiber manipulation for accurate measurements of cross-sectional area.

D. Tensile testing conditions
Although the Hysitron nanomechanical transducer is inherently a load-controlled device, all tensile tests were carried out under displacement-rate control by means of a tuned PID feedback loop. The nominal strain rate was 1 × 10⁻⁴ s−1, and data were recorded at a rate of 100 Hz. The reported electronic feedback rate and response time of the controller were 7.8 × 10⁴ Hz and 1.3 μs, respectively, but the inertia of the system slowed the mechanical response time considerably during sudden displacement excursions. SEM images were acquired at a rate of 1 Hz during the course of the test. When accurate measures of strain were needed, a digital image correlation (DIC) technique (see, e.g., Eberl et al.Reference Eberl, Gianola and Hemker23) was used in preference to measurements of total displacement to avoid inaccuracies caused by system compliance and slip in the grips.
III. RESULTS
A. General observations
1. Experimental challenges
Measuring the stress–strain response of the Mo-alloy fibers in tension was fraught with experiment difficulties. These included fiber cross-sectional area measurements, accurate strain measurements, and controlling the displacement during sudden plastic strain bursts. Although accurate measurements of stress depended on careful examination of cross-sectional areas, it was not possible to section every tested fiber with the ion beam because some of the fibers broke from the grips in the process of positioning them with the manipulator. In those cases, the only possible measurement was the initial fiber size. Strengths calculated from the fiber size assuming a square cross section could be in error by nearly a factor of 2 since the largest observed aspect ratio of cross sections was roughly 2:1.
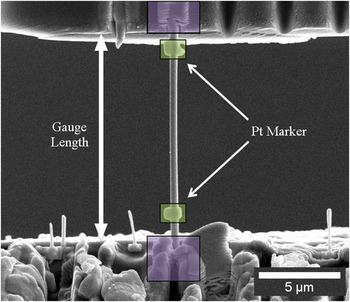
Strain measurements from the displacements measured by the nanomechanical transducer suffered from parasitic displacements due to system compliance and slip at the grips. This was first observed in elastic modulus measurements that were too low in comparison to the reported values, so a special effort was made to use DIC techniques to correct the displacements for modulus measurement. Figure 4 shows a mounted, as-grown fiber for which DIC techniques were used to measure strain based on displacement of the grips and also at two Pt markers deposited directly on the gauge sections before testing. The elastic modulus calculated from the strain measured between the Pt markers was 320 GPa, whereas the modulus obtained from the displacement of the grips was 295 GPa, suggesting the possibility of slip and compliance at the grips during testing. Elastic modulus measurements also suffered from possible errors in the cross-sectional area as previously mentioned. It is also possible that the cross-sectional areas were affected by the build up of carbon in the SEM. In such cases, the cross-sectional area may be overestimated leading to low values for the elastic modulus.Reference Gianola, Sedlmayr, Monig, Volkert, Major, Cyrankowski, Asif, Warren and Kraft22
An as-grown fiber loaded in the linear-elastic regime for elastic modulus measurement. Digital image correlation techniques were used to measure the strain based on the relative displacements of the grips and Pt markers deposited on the gauge section.

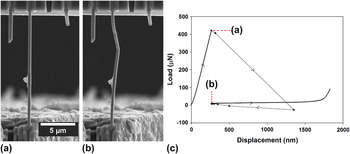
In addition to difficulties in stress–strain measurements, it was also observed that the testing system was not able to adequately control the displacement of the nanomechanical transducer during plastic deformation bursts. Evidence of unstable displacement control is presented in Fig. 5, in which a plot of the load–displacement behavior of a 4% prestrained fiber exhibiting a displacement burst of nearly 1 μm at the initial yield point is shown next to SEM images of the tested fiber immediately before and after the burst. The inability of the PID controller to maintain control at the rapid plastic excursion resulted in 1-2 μm of uncontrolled displacement and extra plastic extension of the specimen. When the transducer returned to the control point, point “b” in Fig. 5(c), the overelongated specimen buckled [Fig. 5(b)].
(a, b) In-situ SEM images of a 4% prestrained fiber just before and just after a plastic strain burst. The fiber kinked due to a temporary loss of displacement control. (c) The load–displacement response of the fiber. The inability of the Proportional-Integral-Derivative (PID) controller to control around the strain burst resulted in 1-2 μm of uncontrolled displacement followed by the return of the transducer to the control point as the PID regained control.

The lack of control has three important implications for the tensile testing. First, due to overextension, fibers may break prematurely at points where they may not have if true displacement control was maintained. Second, fracture surfaces of fibers that break in this manner are not necessarily representative of the material behavior; thus, post-test interpretations of fracture modes may be misleading. Third, it may be difficult to observe and measure the strain-softening behavior that is thought to play an important role in as-grown fiber deformation.Reference Bei, Shim, George, Miller, Herbert and Pharr12
2. Load–displacement behavior
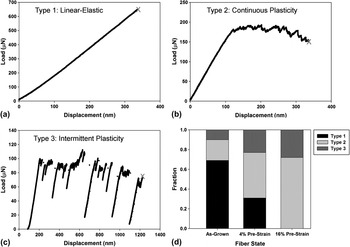
In light of the experimental difficulties in accurately measuring stress and strain, the Mo-alloy deformation behavior will be presented primarily on the basis of the loads and displacements measured by the nanomechanical transducer. In the course of testing, it was found that there were three general types of load–displacement behavior, as illustrated in Fig. 6. The first type, Fig. 6(a), is characterized by linear-elastic deformation followed by abrupt failure at relatively large loads. This is not brittle fracture, since most of the fracture surfaces exhibited ductile features. Rather, the abrupt failure is more likely due to lack of proper displacement control at the sudden onset of yielding. Linear-elastic loading to failure was observed in 69% of the as-grown fibers and 31% of the 4% prestrained samples, but none of the 16% prestrained samples.
The three types of load–displacement responses observed during testing: (a) linear-elastic loading followed by abrupt failure; (b) linear-elastic loading followed by continuous plasticity with little or no strain hardening; and (c) linear-elastic loading followed by intermittent plasticity with discrete load drops. (d) The relative fractions of each type for as-grown, 4% prestrained, and 16% prestrained fibers.

The second type of load–displacement behavior is shown in Fig. 6(b). It is characterized by linear-elastic loading followed by stable, continuous plasticity with little or no strain hardening and often a slow decrease in load with displacement associated with the slow growth of a neck. This is similar to the behavior of a highly work-hardened metal that undergoes slow necking immediately after yielding. This was observed mostly in the 16% prestrained fibers (71% of them) but also in 21% of the as-grown fibers and 46% of the 4% prestrained fibers.
The third type of load–displacement behavior, shown in Fig. 6(c), is characterized by linear-elastic deformation followed by intermittent plasticity with numerous load drops. This was observed in 10% of the as-grown, 23% of the 4% prestrained, and 29% of the 16% prestrained fibers.
Figure 6(d) summarizes the relative percentages of each type of load–displacement behavior. The as-grown fibers mostly exhibited linear-elasticity to failure, which would be expected in a material that is nearly dislocation free [see Fig. 1(b)] and deforms very locally and catastrophically when the first dislocations are activated. The 16% prestrained fibers mostly exhibited continuous plasticity with a few instances of intermittent plasticity. Since they have very high starting dislocation densities [see Fig. 1(c)], and therefore, little opportunity to strain harden, plasticity is highly localized and necking commences shortly after yielding, with the neck growing rather slowly. The 4% prestrained fibers were observed to have an almost equal distribution of each type of load–displacement behavior, as might be expected from a material with an inhomogeneous dislocation density distribution that ranges from essentially dislocation free to very highly dislocated [see Figs. 1(d)–1(f)].
It is also instructive to compare the three types of load–displacement behavior observed here in tension to the behavior observed by Bei et al.Reference Bei, Shim, George, Miller, Herbert and Pharr12, Reference Bei, Shim, Pharr and George13 in compression. In pillar compression, the as-grown Mo-alloy fibers (pillars) exhibited linear-elastic loading up to the yield point, followed by a large displacement burst and unstable plasticity that is caused by testing a strain-softening material in a load-controlled testing apparatus. This is also what is observed in tension, with the majority of the tension tests exhibiting linear elasticity followed by abrupt ductile failure due to the lack of displacement control at the sudden onset of yielding. As in the tension tests, compression of 4% prestrained pillarsReference Bei, Shim, Pharr and George13 resulted in a variety of behaviors including both strain bursts and stable plasticity, as would be expected from a material with an inhomogeneous dislocation distribution. Compression of the more highly strained 11% prestrained pillars produced stable plastic deformation with very little scatter and a limited amount of work hardening. In tension, the 16% prestrained fibers also exhibited reproducible plasticity, but it was usually associated with a mild softening rather than hardening. This is due to the fact that necking takes place in tension and commences shortly after yielding in the highly prestrained, highly dislocated material. Similar behavior has been observed in in-situ tests of single crystal Mo with high dislocation densities.Reference Kim and Greer24, Reference Kim, Jang and Greer25
3. In-situ deformation and fracture observations
Fiber deformation and fracture were examined in situ. A few observations were general to all fibers. First, plastic deformation events were always spatially inhomogeneous, that is, deformation occurred at discrete locations on the fiber rather than uniformly, sometimes spreading out from the original deformation site and sometimes nucleating at multiple locations. Second, deformation usually initiated at the thinnest region along the length of the fiber, but occasionally near the grips. Third, failure did not always occur in the fiber gauge length but instead at or near the grips, suggesting the possible influences of local stress concentrations. With these general observations in mind, observations of deformation and fracture specific to each load–displacement type and level of prestrain are now detailed.
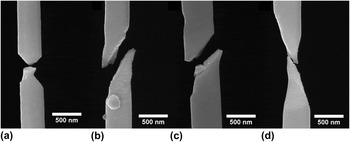
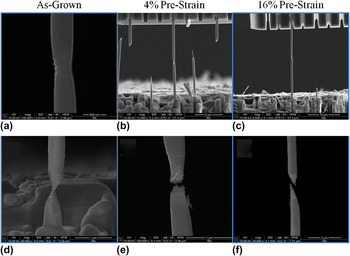
For fibers that deformed linear-elastically to failure (Type 1 behavior in Fig. 6), deformation was limited to a small change in fiber length with no observations of plasticity except near the fracture site. Images of fiber fracture for as-grown and 4% prestrained fibers (no 16% prestrained fibers exhibited this type of behavior) are provided in Fig. 7. Some fibers exhibited shear failure with limited plasticity [Figs. 7(b) and 7(c)] and others necking [Figs. 7(a) and 7(d)]. Interpretation of these tests is complicated because of the possible lack of control in the testing system at the yield point.
SEM images of fracture modes for specimens exhibiting linear-elastic loading to failure, Type 1 behavior. (a, b) as-grown fibers; (c, d) 4% prestrained fibers. No 16% prestrained fibers exhibited this type of behavior.

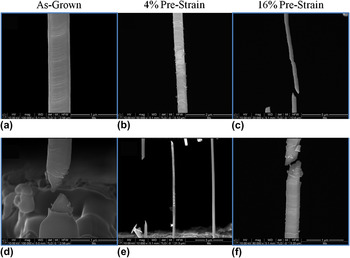
Images of deformation and fracture for fibers that exhibited continuous plasticity (Type 2 behavior in Fig. 6) are presented in Fig. 8. Deformation after yielding was limited to necking in a single localized region, giving rise to a slow decrease in load with continued straining. The amount of necking before failure varied from fiber to fiber and was not dependent on the level of prestrain.
SEM images of deformation and fracture observed in the case of continuous plasticity, Type 2 behavior. (a)–(c): Deformation initiated and remained localized at a single neck for all three levels of prestrain. (d)–(f): Different types of necking.

The deformation and fracture modes for the third type of load–displacement behavior, intermittent plasticity (Type 3 behavior in Fig. 6), are summarized in Fig. 9. In this case, deformation usually started in one region and propagated away from the initiation site, as in the formation of a Lüders band, but would sometimes stop and reinitiate at other locations. Load drops in the load–displacement curves were associated with discontinuous propagation of localized plasticity or formation of another plastic deformation site. Fracture modes for this type of behavior were mixed between necking and shear failure with limited plasticity. As in the other types of load–displacement behavior, the mode of deformation and failure was generally independent of the level of prestraining. However, the frequency of each mode of deformation was a strong function of the level of prestrain in the fiber.
SEM images of deformation and fracture for intermittent plasticity, Type 3 behavior. (a)–(c) show that deformation initiated locally and then propagated along the length of the fibers at all three levels of prestrain. (d)–(f) demonstrate that failure modes were mixed between shear with limited plasticity and different types of necking.

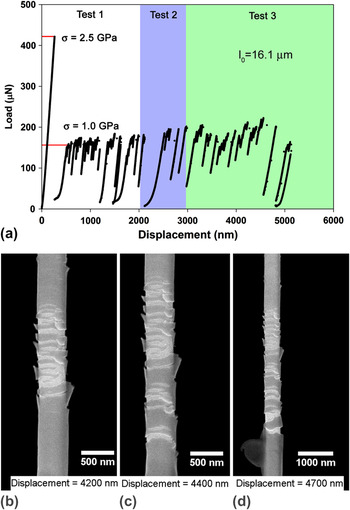
In a limited number of tests, classic Lüders band formation was observed with distinct upper and lower yield point phenomena and Lüders band propagation at a relatively constant stress. Observation of the propagation of the Lüders band was sometimes aided by a thin layer of material that spalled from the surface in the region of plastic deformation (see Fig. 10). Although the exact nature of the layer is not understood, it is possibly a thin oxide layer formed during the etching performed to extricate the fibers from the matrix. Indeed, a Ni–Al–Mo Pourbaix diagram suggests that the etchant used for fiber extraction (pH ≈ 1, no applied voltage) should create an oxide passivation layer on Mo.Reference Frankel, Milenkovic, Smith and Hassel26 However, the possibility of carbon deposition on the fibers during observation in the SEM cannot be ruled out.Reference Roediger, Wanzenboeck, Hochleitner and Bertagnolli27, Reference van Dorp and Hagen28 The thin layer was observed on some but not all fibers, suggesting that the formation of the layer is probably sensitive to exposure time to the etchant and the electron beam, or other variables associated with fiber extraction and observation in the SEM.
The mechanical response of a 4% prestrained fiber where PID feedback control was successful in controlling at a yield drop, and upper and lower yield points with of Lüders band propagation were observed. (a) The load–displacement curve showing distinct upper and lower yield points followed by intermittent plasticity at a nearly constant upper load. (b)–(d): In-situ SEM images of Lüders band propagation with increasing displacement. Spallation of a surface layer is clearly evident and helps to define the location and extent of the Lüders band.

Figure 10 presents the results of a test on a 4% prestrained fiber in which classical Lüders band formation was observed. A careful, post-test examination of the fiber cross section was conducted so that the stresses could be accurately quantified. These engineering stresses are indicated on the load–displacement curve shown in Fig. 10(a). The fiber exhibited a distinct upper yield stress of ∼2.5 GPa, followed by a sudden load drop that the testing system was able to control without abrupt failure. The material then flowed at a lower, constant stress of about 1 GPa with intermittent load drops while the Lüders band, seen in Figs. 10(b)–10(d), extended along the gauge length. The fiber was unloaded before fracture (test 1 in the figure) and then reloaded (test 2). Again, the fiber had a flow stress of ∼1 GPa, but this time fractured near the grips shortly after the test started. The longer part of the fractured fiber was remounted and tested for a third time (test 3). As in the first and second tests, the fiber flowed at a stress of 1 GPa with further propagation of the Lüders band [see Figs. 10 (b)–10(d)]. This clearly shows that when displacement control is maintained and the specimen does not abruptly fail due to lack of control, strain-softening and classic Lüders band activity do indeed occur in the material.
B. Yield strength
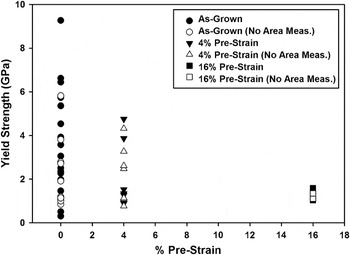
Estimates of the yield strengths of the fibers as a function of prestrain are given in Fig. 11. The cross-sectional areas used to compute the yield strengths were calculated from actual cross-section measurements where possible, or from initial fiber sizes assuming a square cross section when actual measurements were not available. As discussed previously, when the area was not directly measured, the strength could be in error by as much as an estimated factor 2 depending on the actual shape of the cross section. As shown in the figure, the as-grown fibers were generally the strongest but exhibited a considerable scatter with strengths ranging from ∼1 to nearly 10 GPa. On the other hand, the 16% prestrained fibers were the weakest with a yield strength of about 1 GPa and very little scatter. The behavior of the 4% prestrained fibers was intermediate both in terms of strength and scatter.
The yield strengths measured in tension for Mo-alloy fibers as a function of prestrain. Filled symbols denote strengths where the cross-sectional area was measured. For the open symbols, the cross-sectional area was estimated from a measured side dimension and the assumption of a square cross section.

In most respects, these results are very similar to the pillar compression data of Bei et al.Reference Bei, Shim, George, Miller, Herbert and Pharr12, Reference Bei, Shim, Pharr and George13 In particular, the observed levels of strength are close to the same (up to 10 GPa in the as-grown fibers and about 1 GPa in the highly prestrained fibers) and there is a tendency toward smaller scatter at higher levels of prestrain compared to the intermediate prestrains. There is, however, one significant difference: in the as-grown material, the compressive yield strengths are uniformly high and near the theoretical strength with very little scatter, whereas in tension the strengths are both high and low and there is a great deal of variability. As will be discussed later, this probably due to the longer gauge lengths used for the tensile tests and thus the greater probability of the specimen containing a strength-reducing defect.
C. Influences of FIB damage on strength
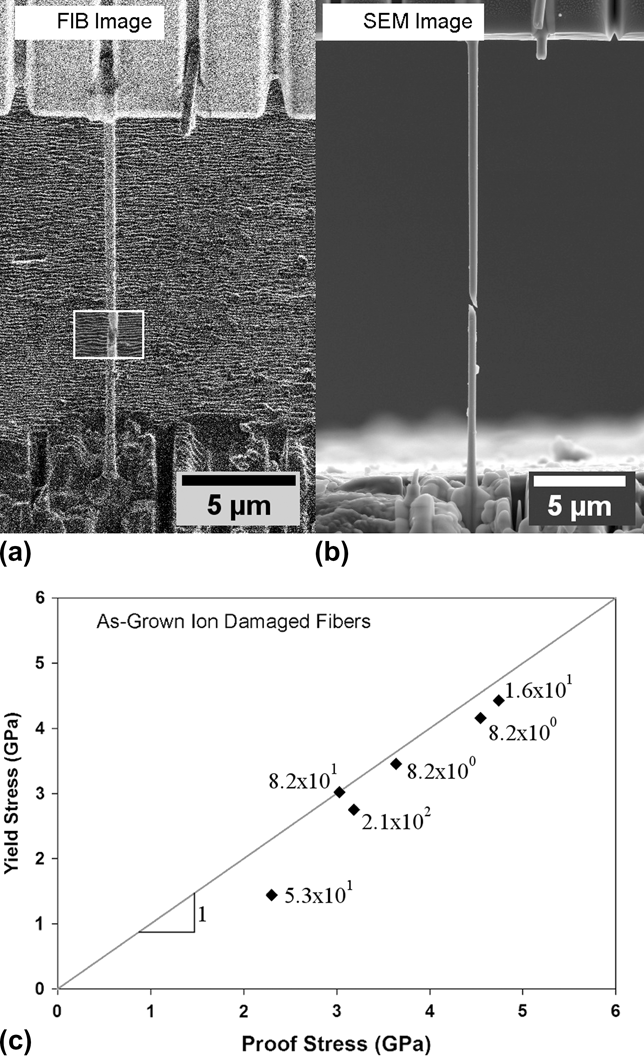
In addition to regular tensile testing, a limited number of tests were performed on as-grown fibers to evaluate the effect of FIB damage within the gauge length on their strength. As shown in Fig. 12, this was accomplished by mounting the fiber in the test system, loading to a given proof stress within the linear-elastic regime (the proof-stress varied from fiber to fiber since the yield stresses of as-grown fibers were unpredictable), and then unloading prior to the FIB treatment. A small section of the fiber, as shown by the white outlined box in Fig. 12(a), was then dosed with Ga+ ions by rastering the FIB across the area of the box at an ion beam current of 10 pA and a dwell time of 1 μs (a beam current of 50 pA was used in two fibers after a number of passes with the low current did not result in fiber failure), and the total ion dose was calculated. Fibers were then reloaded to the same proof stress and unloaded. The process was repeated until the fiber yielded or failed [see Fig. 12(b)], thus establishing the theoretical ion dose needed to reduce the yield or failure strength below that of the proof stress. Yielding/failure always occurred in the FIB damaged region and FIB damage was visibly apparent when ion doses neared 100 ions/nm2.
Influences of ion beam damage on fiber strength. (a) Representative FIB image of the as-grown Mo-alloy fibers. The white box shows the area rastered with the FIB to damage the fiber. (b) A post-test SEM image showing fiber failure within the rastered region. (c) Yield (failure) stress of damaged fibers plotted against the proof stress. The number of ions/nm2 causing the failure is listed next to the symbols.
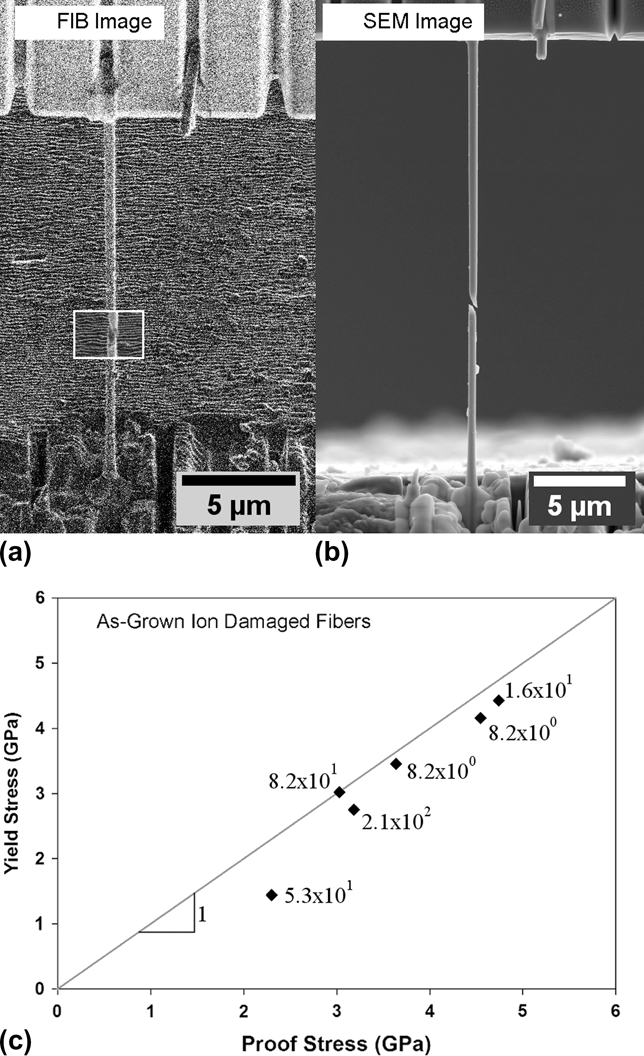
The resulting yield/failure strengths are plotted as a function of proof stress in Fig. 12(c) along with the number of ions/nm2 (ion dose) needed to cause failure. All of the fibers yielded/failed at strengths lower than the proof stress, and plastic deformation and fracture always occurred within the area dosed with Ga+ ions. More statistics are needed to draw firm conclusions about the effect of ion dose on the strength of the Mo-alloy fibers. However, the fact that each FIB-damaged fiber failed in the dosed region suggests that doses in the range 10–100 ions/nm2 do indeed reduce the strength. Similar behavior has been observed in pillar compression experiments by Shim et al.Reference Shim, Bei, Miller, Pharr and George29 and indentation experiments by Bei et al.Reference Bei, Shim, Miller, Pharr and George30 It is important to note here, that these results reflect the effects of FIB damage on nearly pristine fibers while the effect of FIB damage on prestrained fibers has not been explored.
IV. DISCUSSION
One of the main goals of this work was to identify differences in mechanical behavior of the Mo-alloy fibers between tension and compression. In that regard, the most significant difference is the large scatter in yield strengths of the as-grown fibers tested in tension (between 1 and 10 GPa; see Fig. 11) as compared to the relatively constant value of ∼10 GPa observed in the pillar compression tests performed by Bei et al.Reference Bei, Shim, George, Miller, Herbert and Pharr12 The larger yield strength is close to the theoretical strength, suggesting that essentially all of the compressed pillars are dislocation free, whereas most of the fibers tested in tension are not. This can be understood based on the recent STEM observations of the dislocation structures in the fibers in conjunction with the different gauge lengths used in the two tests. The compressed pillars were typically less than 3 μm in length, whereas the fibers used for tension were much longer, in the range of 9–41 μm, and thus more likely to contain a dislocation. As a result, the scatter can be explained by simple weak-link concepts and the probability of finding a preexisting dislocation in the gauge length. Here, we develop this concept more quantitatively using a simple probability analysis which is confirmed by Monte Carlo approximations.
The key to developing the model is the dislocation densities and distributions in the as-grown fibers. Sudharshan Phani et al.Reference Phani, Johanns, Duscher, Gali, George and Pharr15 found that the as-grown material is not dislocation free, but rather contains small groups of dislocations separated on average by 37 μm of dislocation-free material.Reference Phani, Johanns, Duscher, Gali, George and Pharr15 On the other hand, the dislocation density in the highly prestrained material (11% in compression and 16% in tension), is so high (∼1014 m−2), that even the smallest compression specimens contain a large number of dislocations, and the behavior in both tension and compression approximates to that of the bulk with relatively low scatter. To develop a model for this behavior, it is convenient to think of the material as having two intrinsic strength levels–a high theoretical strength, σ o, of ∼10 GPa, for shorter dislocation-free specimens, and a lower bulk strength, σ bulk, for specimens containing dislocations. We assume here, for the sake of development, that σ bulk is ∼1 GPa based on the pillar compression results for highly prestrained specimens. We note, however, that the bulk strength for the as-grown fibers may be less than this due to the lower dislocation densities.
In the limit of a large number of tests, the average yield strength, σ avg, for a given specimen gauge length, L, and dislocation density, ρ, is given by:

where p o is the probability of not finding a dislocation within a gauge length for a given dislocation density. Since the probability of not finding a dislocation decreases with increasing gauge length in the as-grown specimens, the average strength transitions from the theoretical strength, σ o, at small specimen lengths to the bulk strength, σ bulk, at large specimen lengths.
Although this simple statistical model incorporates the basic features observed in the tension and compression tests, yield strengths between the theoretical and bulk strengths are not included, except in an averaged sense. A simple way to incorporate intermediate strengths is to imagine that each dislocation in a given gauge length has a random Schmid factor, s. The dislocation having the largest Schmid factor, s*, would then control the initial yield point such that the yield strength, σ y, of the fiber is given by:

Here, τ crss is the critical resolved shear stress required for dislocation activation, which is directly related to the maximum possible Schmid factor for the given material system, s max, and the bulk yield stress (i.e., σ bulk is given by τcrss/s max). Note that in a more general model, the bulk yield stress may depend on the initial dislocation density.
All of these ideas can be used to develop an analytical model incorporating the randomness in defect spacing and the randomness in yield strength that accounts for the interplay between gauge length and dislocation density. Such a model is currently under development and will be presented in a future article (P.S. Phani et al., work in progress). However, for the purposes of this work, a simple Monte Carlo approach based on these concepts was used to simulate the yield strengths of as-grown fibers in both tension and compression. The randomness in defect spacing was accomplished by assigning n dislocations to random positions along a specimen gauge length, L, such that the average dislocation free lengths were 37 μm, or equivalently, the linear dislocation density of the as-grown fibers was 3 × 10⁴ m−1, as measured by Sudharshan Phani et al.Reference Phani, Johanns, Duscher, Gali, George and Pharr15 The randomness in strength was incorporated by assigning each dislocation a random Schmid factor between 0 and 0.5. The yield strength of a given fiber was then calculated based on Eq. (2) in the presence of dislocations, or set equal to the theoretical strength in the absence of dislocations. If the largest Schmid factor in a given gauge length resulted in a strength greater than the theoretical strength, then the theoretical strength was taken as the yield strength since it would be easier to nucleate a dislocation rather than activate such an unfavorably oriented dislocation.
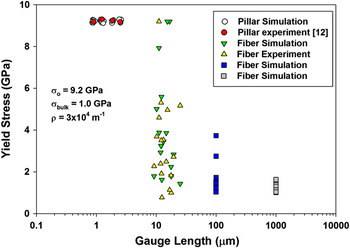
Simulation predictions for yield strengths are compared to experimental observations in Fig. 13, where one Monte Carlo simulation has been included for every experimental data point at the corresponding specimen length. Note that the small-scatter behavior of the yield strength at the small specimen lengths used in compression testing (∼1-3 μm) is well-predicted, as is the highly scattered, stochastic behavior for specimen lengths like those in the tensile tests (9–41 μm). The simulations also show that measurable scatter would be observed in specimens 100-μm long, and only when the specimen length approaches ∼1000 μm is the scatter reduced to the bulk-like, deterministic behavior.
Yield strengths of the as-grown Mo-alloy as a function of gauge length showing the results of Bei et al. from pillar compression testing,Reference Bei, Shim, George, Miller, Herbert and Pharr12 the current results from tensile testing, and Monte Carlo simulations using the dislocation densities measured by Sudharshan Phani et al.Reference Phani, Johanns, Duscher, Gali, George and Pharr15 Monte Carlo simulation points have been staggered in the case of pillar compression for clarity.

Two important conclusions can be drawn from Fig. 13. First, a simple statistical model that incorporates random spatial distributions of defects and random strengths in an appropriate range can reconcile the discrepancy between the observed yield strengths in the tension and compression data sets. This may also explain the scatter in strengths observed in Brenner’s classic tension tests of metal whiskers.Reference Brenner31, Reference Brenner32 Second, it is important to note that when the number of dislocations in a test sample is relatively small, as may commonly be the case in nanopillar and nanotensile testing, it is very important that a statistically significant number of tests be conducted to establish the magnitude of the scatter; that is, results from a single test (or even a few tests from which an average strength is calculated) could be very misleading.
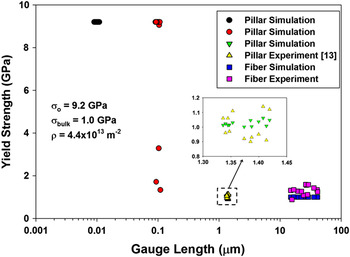
Figure 14 compares a similar set of Monte Carlo predictions to experimental results for the highly prestrained fibers (11% prestrain for compression and 16% for tension). The simulations were conducted assuming an initial dislocation density of 4.4 × 10¹³ m−2, consistent with the STEM measurements. In this two-dimensional case, randomness in dislocation spacing was achieved by assigning random coordinates to n dislocations inside a source area, A, such that the dislocation density (number of dislocations per unit area) was satisfied. Random area sections of varying lengths and widths of 500 nm (the nominal size of the fibers), were then sampled from the source area. The yield strength of each section was then determined as described above. In this case, the high density of dislocations produces bulk-like, deterministic strengths in specimens as short as 1 μm, consistent with the experimental observations. Only when the specimen lengths are reduced to ∼0.1 μm does the model predict appreciable scatter in yield strength.
Yield strengths of the prestrained Mo-alloy specimens (11% prestrain for compression and 16% for tension) as a function of gauge length showing the results of Bei et al. from pillar compression testing,Reference Bei, Shim, Pharr and George13 the current results from tensile testing, and Monte Carlo simulations using the dislocation densities measured by Sudharshan Phani et al.Reference Phani, Johanns, Duscher, Gali, George and Pharr15 An inset showing a magnified view of specimens with a gauge length around 1 μm is provided for clarity.

Last, we wish to note that the size effects modeled in this work are strictly stochastic in nature. The model does not address other physical mechanisms for size effects such as specimen boundary conditions, dislocation starvationReference Greer and Nix19 or operation of single arm sources.Reference Parthasarathy, Rao, Dimiduk, Uchic and Trinkle33 These could conceivably be incorporated into the model by considering the ways in which they affect the bulk strength.
V. CONCLUSIONS
A FIB/SEM-based in-situ technique has been used to measure and record the mechanical response of as-grown and prestrained single-crystal Mo-alloy fibers with submicron sizes (300–600 nm) under uniaxial tensile loading. The results are compared to previous micropillar compression testing by Bei et al.Reference Bei, Shim, George, Miller, Herbert and Pharr12, Reference Bei, Shim, Pharr and George13 and interpreted based on recent STEM microstructural observations by Sudharshan Phani et al.Reference Phani, Johanns, Duscher, Gali, George and Pharr15 The primary conclusions are as follows:
(i) There is a significant difference in the yield strength between tension and compression of the as-grown Mo fibers. Although the yield strength is consistently at the theoretical strength of ∼10 GPa in pillar compression, it is scattered in the range from 1 to 10 GPa in tension. This difference can be explained by weak-link concepts and the differences in sample gauge lengths used for tension and compression testing. A simple, statistically based model is developed to describe the difference.
(ii) Highly prestrained fibers (11% prestrain for pillar compression and 16% prestrain for tension tests) behave essentially the same in tension and compression, exhibiting similar yield and flow strengths. However, after yielding, specimens tested in tension tend to weaken rather than strain harden because necking starts immediately at the onset of yielding.
(iii) Three types of load–displacement behavior were observed in the tension tests. The as-grown fibers exhibit mostly linear-elasticity to failure, which would be expected in a material that is nearly dislocation free and deforms very locally and catastrophically when the first dislocations are activated. The 16% prestrained fibers exhibited mostly smooth continuous plasticity, similar to what would be observed in the bulk. The 4% prestrain fibers exhibited both of these behaviors as well as intermittent plasticity characterized by bursts of plastic strain and numerous load drops. The variety of behaviors in the 4% prestrained fibers results from the inhomogeneous dislocation structures they contain.
(iv) Strain softening and Lüders band formation were observed in a limited number of fibers, usually those prestrained by 4%, when the PID displacement control worked well. In most tests, however, observations of strain softening are impeded by the inability of the PID feedback control to perform a true displacement–controlled test when there are abrupt bursts of plasticity.
(v) A limited number of tests were performed on as-grown fibers to evaluate the effects of FIB damage on their strength by measuring their strength after exposing a small section of the gauge length to a controlled Ga+ ion dose. Although the number of tests was limited, the results suggest that doses in the range of 10–100 ions/nm2 do indeed reduce the strength in a measurable way.
ACKNOWLEDGMENTS
This work was supported by the U.S. Department of Energy, Basic Energy Sciences, Materials Sciences and Engineering Division (materials synthesis and modeling) and the Center for Defect Physics, an Energy Frontier Research Center supported by the Office of Basic Energy Sciences, U.S. Department of Energy (materials characterization and testing). GMP gratefully acknowledges the Alexander von Humboldt Foundation for fellowship support during the period in which the work was performed.