Implications
For horses outdoor group housing is considered an animal-friendly housing system. However, climatic conditions and insufficient food availability in winter may affect welfare. This study shows that a robust horse breed can adapt to year-round outdoor housing without difficulty when adequate food supply is guaranteed. Food scarcity in winter led, despite a metabolic reduction, to intensive mobilization of body reserves and thereby to health impairments. Therefore, outdoor group housing with regular control for body condition and feed supply can be an adequate housing system for robust horse breeds.
Introduction
In the Northern hemisphere wild animals are often exposed to extreme changes in environmental conditions during the seasons. Thermoregulation in endothermic animals, like the horse, is achieved, for example, by anatomical, physiological, biochemical and behavioral adaptions (Clarke, Reference Clarke1991; Autio et al., Reference Autio, Neste, Airaksinen and Heiskanen2006). An increasing number of domesticated horses are kept under semi-extensive conditions because outdoor group housing is considered as an animal-friendly system (Zeitler-Feicht, Reference Zeitler-Feicht2013). However, many domesticated horse breeds were selected for athletic performance and were kept under constant nutrient supply and controlled environmental conditions without selection pressure for maintaining a seasonal, cyclic adaptation (Price, Reference Price1984). Therefore, welfare impairments may be expected when domesticated horses are kept under nearly natural conditions (Robinson et al., Reference Robinson, Karmaus, Holcombe, Carr and Derksen2006) and insufficient food supply in winter during times of increased energetic needs can pose a challenge (Cymbaluk and Christison, Reference Cymbaluk and Christison1990). A recent study on Shetland ponies showed that they can adapt to winter conditions by reductions in energy expenditure and fluctuations in body temperature (Brinkmann et al., Reference Brinkmann, Gerken, Hambly, Speakman and Riek2014) as was also observed in Przewalski horses (Arnold et al., Reference Arnold, Ruf and Kuntz2006). However, information on the physiological status of horses adapting to climatic changes and food shortage during winter is still rare. Therefore, the objective of this study was to analyze the effect of annual climatic changes and a prolonged feed restriction in winter on physiological and blood parameters that are particularly suitable to allow insight into the metabolic state and health status of the Shetland pony.
Material and methods
This study was approved by the State Agency of Consumer Protection and Food Safety of Lower Saxony for Consumer Protection and Food Safety (ref. no.: 33.9-42502-04-12/0791).
Animals and study site
The experiment was carried out at the Department of Animal Sciences at the University of Göttingen (51° 32' N; 9° 56' E), Germany, lasting 1 year from June 2012 to May 2013. Ten Shetland pony mares (5 to 13 years) were kept under semi-natural conditions . The initial BW and body condition score (BCS; scale: 0=emaciated, 5=obese; Carroll and Huntington, Reference Carroll and Huntington1988) was 141.4±25.0 kg and 3.5±0.6 points, respectively. The experiment was subdivided in three phases: pasture phase, feeding trial phase and refeeding phase. During the pasture phase (1 June 2012 until 25 October 2012) all ponies were kept on permanent pastures (~2 ha) partly covered with trees and bushes as natural shelter. Thereafter, ponies were moved to paddock housing where the feeding trial (19 November 2012 to 11 March 2013) and refeeding phase (11 March 2013 to 12 May 2013) was carried out. On paddock ponies were allocated into one treatment group (TG) and one control group (CG) of five animals each. Both groups had a comparable mean BCS (TG: 4.8±0.4 points, CG: 4.8±0.4 points), BW (TG: 156±24 kg; CG: 163±33 kg) and age (TG: 9.6±3.1 years; CG: 9.0±2.6 years). Each group was held on a separate rectangular paddock (210 m2) without vegetation and two adjacent sheds measuring 18.90 and 9.45 m2, respectively. The shed floors were covered with a thick layer of wood chips and each shed was equipped with five feeding stands (1.35×1.60×0.55 m, height×length×width). Sheds were unheated and open to one side, thus inside and outside temperatures were comparable. The light–dark cycle fluctuated according to the natural photoperiod. Routine foot care, vaccination and anthelmintic treatments were carried out throughout the study.
Feeding
During the pasture phase food consisted of the natural vegetation and a mineral supplement provided by a salt lick (Eggersmann Mineral Leckstein; Eggersmann GmbH & Co KG, Rinteln, Germany), whereas on paddock during the feeding trial and refeeding phase ponies received ryegrass hay (6.8 MJ metabolisable energy (ME) and 46 g CP/kg dry matter) and a mineral supply (15 g/100 kg BW per day; Derby Mineralpellets; Derby Spezialfutter GmbH, Münster, Germany). Throughout the experiment water was available ad libitum for all animals at a frost-proof watering place. During the first 3 weeks of paddock housing (25 October 2012 to 19 November 2012) ponies were allowed to acclimatize to the housing and feeding conditions. Both groups were fed identically with 100% of the recommended energy and protein requirements. The daily maintenance requirement of energy for small obese ponies including movement was assumed to be 0.38 MJ ME/kg BW0.75 per day (Kienzle et al., Reference Kienzle, Coenen and Zeyner2010). Protein requirements were assumed to be (3 g/kg BW0.75 per day) (Meyer and Coenen, Reference Meyer and Coenen2014).
Subsequently, the feeding trial phase started lasting 4 months (19 November 2012 to 11 March 2013) with CG animals receiving 100% of the recommended energy requirements, whereas in TG animals feed supply was reduced stepwise to 60% of the recommended energy requirements for Shetland ponies to simulate diminishing food availability under natural conditions during autumn and winter: from 19 November 2012 TG animals received 90% of the recommended energy (i.e. 0.34 MJ ME/kg BW0.75 per day), from 26 November the amount of feed was reduced to 80% (i.e. 0.30 MJ ME/kg BW0.75 per day) and from 7 January until 28 January TG animals received 70% (i.e. 0.27 MJ ME/kg BW0.75 per day). Thereafter, 60% of the recommended energy requirements (i.e. 0.23 MJ ME/kg BW0.75 per day) were fed until the 11 March. Subsequently, the refeeding phase was initiated lasting until the end of the study (13 May). Within the 1st week the amount of feed was increased to 70% (i.e. 0.27 MJ ME/kg BW0.75 per day) and in the 2nd week (18 March until 25 March) to 85% of the recommended energy requirements (i.e. 0.32 MJ ME/kg BW0.75 per day). From 25 October TG animals received again 100% of the recommended energy requirements. The amount of feed for TG animals was weighed to the nearest of 0.01 kg and rations were adjusted weekly on a BW basis for individual animals. Rations were fed daily at 0730, 1200 and 1600 h. All animals were in good health and the dental status was checked before the feeding trial. For both groups food was provided inside the feeding stands to guarantee individual feed consumption. However, food-restricted animals were confined in the feeding stands for 2 h during each feeding session. This ensured a residence time inside the feeding stands comparable with that of the adequately fed CG animals. Water was available ad libitum inside the feeding stands.
Ambient temperature, BW, body condition score, cresty neck score, resting heart rate and hair length
The ambient temperature (T a; °C) was recorded every hour throughout the study using miniature data loggers (i-Buttons, DS1922L-F5#, resolution: 0.0625°C; Maxim Integrated Products, Sunnyvale, CA, USA). Body weight of each animal was recorded once every 2 weeks with a mobile scale (Weighing System MP 800, resolution: 0.1 kg; Patura KG, Laudenbach, Germany). The BCS (scale: 0=emaciated, 5=obese), a palpable and visual assessment of the degree of fatness in the neck, back, ribs and pelvis and the cresty neck score (CNS; scale: 0=no palpable crest, 5=crest drops to one side), a scoring system for grading neck crest fatness, were assessed every 2 weeks using the system of Carroll and Huntington (Reference Carroll and Huntington1988) and Carter et al. (Reference Carter2009), respectively. Resting heart rate (RHR) was recorded between 1000 and 1200 h once every 2 weeks. The heart rate was determined three times for 60 s with a stethoscope and values were averaged. Before the measurements, animals were at rest for at least 5 min. As ponies were used to the handling the impact of the measuring procedure on the heart rate recordings was assumed to be minimal. Hair length for each pony was measured monthly with a cardboard template (7×10.5 cm) that was inserted into the hair coat of the neck, flank and croup determining the length of both guard and undercoat hair to the nearest Millimeter.
Blood analyses
Blood samples (10 ml) of each pony were taken on a monthly basis. The samples were drawn between 0730 and 0830 h on the sampling day from the vena jugularis and transferred into serum tubes (12 ml KABE SE 95 PP; KABE Labortechnik GmbH, Nümbrecht-Elsenroth, Germany). Blood glucose and insulin concentrations were not analyzed when animals were kept on pasture because fasting blood samples were not feasible. All samples were centrifuged for 10 min at 3000 r.p.m. and 20°C (centrifugation force: 1620 g). The serum samples were then stored at –20°C until analysis. Total bilirubin, total protein, non-esterified fatty acids (NEFA) and triglycerides were analyzed by colorimetric enzymatic reaction using a Cobas® Modular Analyzer (Roche Diagnostics GmbH, Mannheim, Germany). Roche test kits were used for triglycerides, total bilirubin and total protein and a Randox test kit for NEFA (Randox Laboratories Ltd Co., Antrim, UK). The ADVIA Centaur® CP Immunoassay System (Siemens Healthcare, Munich, Germany) was used to analyze triiodothyronine (T3) and insulin. For both parameters a Siemens test kit was used. Thyroxin (T4) concentrations were determined by an Immulite® immunoassay-system (Siemens Healthcare, Erlangen, Germany). Glucose concentrations were analyzed immediately after blood sampling using an Accu-Chek Aviva blood glucose meter (Roche Diagnostics GmbH).
Statistical analyses
All statistical analyses were performed using SAS version 9.3 (SAS Institute Inc., Cary, NC, USA). For every feeding group monthly averages of the parameters NEFA, total protein, total bilirubin, T4, T3 and triglyceride concentrations were calculated in addition to means for the different feeding phases (pasture, feeding trial, refeeding). Differences in blood parameters between the phases and feeding groups were tested with an integrated post hoc test (Tukey’s) within a mixed model (PROC MIXED), where the animal was included as a random factor to account for repeated measurements of the same individuals. The model was:
 $$Y_{{ijk}} \, {\equals}\, \mu {\plus}G_{i} {\plus}P_{j} {\plus}\left( {G{\times}P} \right)_{{ij}} {\plus}A_{k} {\plus}e_{{ijk}} $$
where Y ijk is the corresponding parameter, μ the mean effect, G the fixed effect of the TG (i=control, restricted), P the fixed effect of the phase (j=pasture, feeding trial and refeeding), G×P the interaction between the TG and the phase, A the random effect of the animal and e ijk the random error. Differences between feeding groups within each month were likewise calculated by a mixed model (PROC MIXED) with an integrated post hoc test (Tukey’s) and animal as a random factor:
 $$Y_{{ijk}} \, {\equals}\, \mu {\plus}G_{i} {\plus}M_{j} {\plus}\left( {G{\times}M} \right)_{{ij}} {\plus}A_{k} {\plus}e_{{ijk}} $$
where Y ijk is the corresponding parameter, μ the mean effect, G the fixed effect of the TG (i=control, restricted), M the fixed effect of the month (j=June to May), G×M the interaction between the TG and month, A the random effect of the animal and e ijk the random error. All values are presented as means±SD. Linear regressions (NEFA, total bilirubin, total protein, triglyceride, T4 and T3) on time were calculated by feeding groups. Pearson’s correlation coefficients were calculated between blood parameters.
Results
Ambient temperature, BW, body condition score, cresty neck score, hair length and resting heart rate
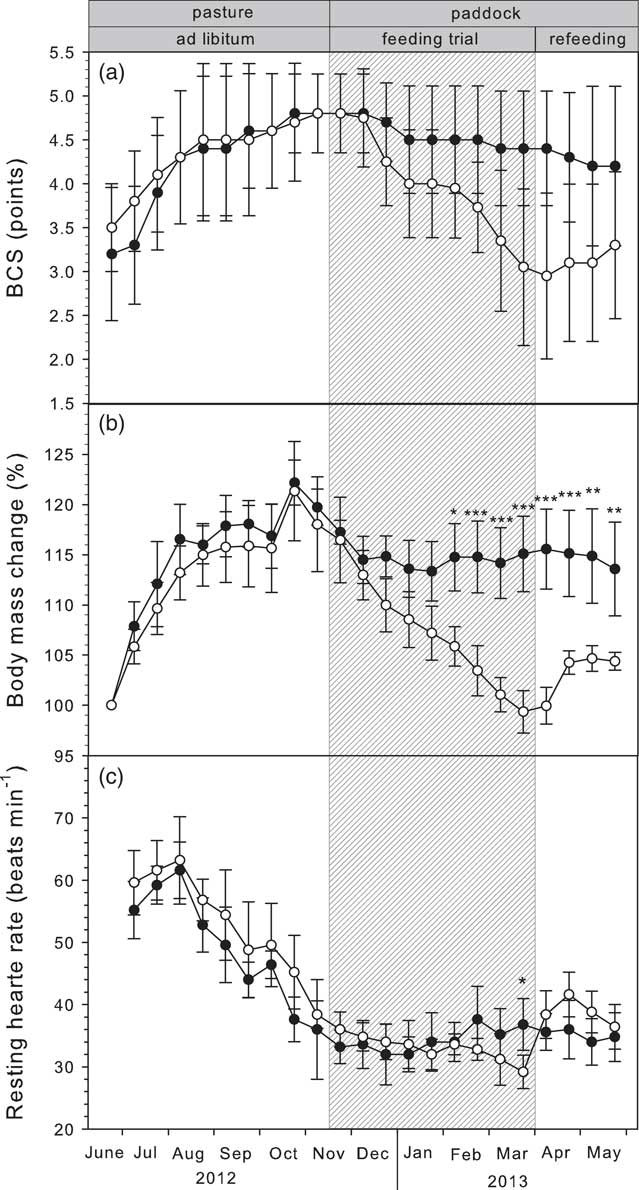
The mean daily T a during the experiment ranged from −4.0±2.8 to 25.6±5.24°C with a minimum and maximum T a of −10.9 and 33.3°C, respectively. The highest mean monthly temperature was recorded in August (17.8±2.9°C), and the lowest in March (1.7±2.5°C). The one year study included 65 days with snow heights over 1 cm and 114 days of ground frost. The total rainfall over the entire study was 594 mm. During the pasture phase BW and BCS did not differ between the two prospective feeding groups (F 1,100=0.18, P=0.67 and F 1,100=0.05, P=0.81, respectively; Figure 1). BW of all ponies increased from the start of the experiment (141.4±25.0 kg) until mid-October (172.0±29.9 kg; BW, kg=146.6+2.6 weeks, R 2=0.78, P<0.001), followed by a slight decrease until animals were transferred to paddock housing on the 25 October (Figure 1b). At the start of the feeding trial BW did not differ between CG and TG animals (CG: 163.2±33.0 v. TG: 157.0±24.1; P=0.743). With increased feed restriction TG animal’s BW decreased (BW, kg=157.8+1.3 weeks, R 2=0.98, P<0.001), whereas BW of CG animals remained fairly constant (BW, kg=163.9+0.1 weeks, R 2=0.07, P=0.33). Restrictively fed animals lost on average 218±74 g/day resulting in a total weight loss of 12.8±2.6% and 20.1±5.2 kg, respectively, during the 16 weeks of the feeding trial (Figure 1b). Refeeding of the TG animals led to a rapid BW increase of 8.3±2.2 kg within the 2-month period (BW, kg=136.4+1.3 weeks, R 2=0.81, P=0.002).
Average body condition score (BCS, a), body mass change (%) of initial body mass (b) and resting heart rate (c) in Shetland ponies measured every 2 weeks. All animals (circles and dots, 10 animals) were kept on pasture with ad libitum access to food from June until November. Animals were then fed either restrictively (circles, n=5) or according to recommendations (dots, n=5) from November until March (feeding trial, shaded area). From mid-March until May restrictively fed ponies were fed again according to recommendations (*P<0.05, **P<0.01, ***P<0.001).

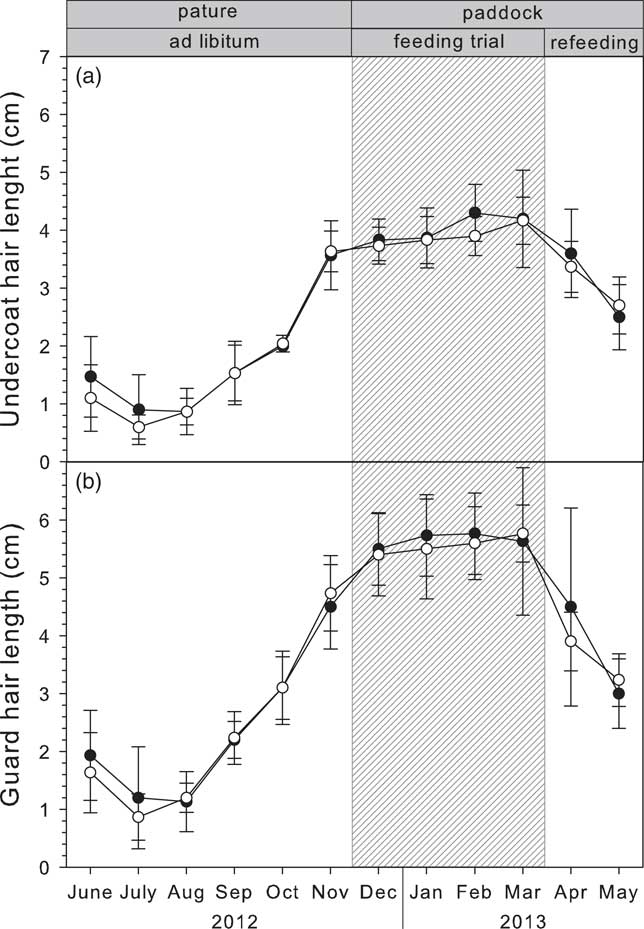
The development of BCS followed the same pattern as for BW. Thus, BSC of all animals increased during the summer month (Figure 1a; BCS, points=3.49+0.14 weeks, R 2=0.32, P<0.001). The CNS (not shown) did not change on pasture (CNS, points=2.26+0.01 week, R 2=0.09, P=0.34). During the feeding trial TG displayed a distinct decrease in BCS (BCS, points=4.72+0.09 weeks, R 2=0.34, P<0.001) and CNS (CNS, points=2.3+0.02 weeks, R 2=0.83, P<0.001). The CG showed a slight decrease in BCS and CNS over the feeding trial and refeeding period (BCS, points=4.74+0.02 weeks, R 2=0.88, P<0.001; CNS, points=2.3+0.01 weeks, R 2=0.52, P=0.001; respectively). During refeeding the BCS of the TG increased by 0.3±0.4 points (BCS, points=2.87+0.04 weeks, R 2=0.86, P=0.001), whereas CNS remained constant. The ponies’ undercoat and guard hair length was shortest in July and August with about 1 cm and increased constantly in autumn until the longest hair length was reached in February/March with about 5.5 cm guard hair and 4 cm undercoat hair length (Figure 2). In spring ponies showed a rapid coat change with decreasing hair length. Both animal groups (CG and TG) did not differ (P>0.05) at any time neither in undercoat nor in guard hair length.
Average monthly undercoat (a) and guard hair (b) length in Shetland ponies. Animals (circles and dots, n=10) were kept on pasture with ad libitum access to food from June until November and were then fed either restrictively (circles, n=5) or according to recommendations (dots, n=5) from November until March (feeding trial, shaded area). From mid-March until May restrictively fed ponies were fed again according to recommendations.

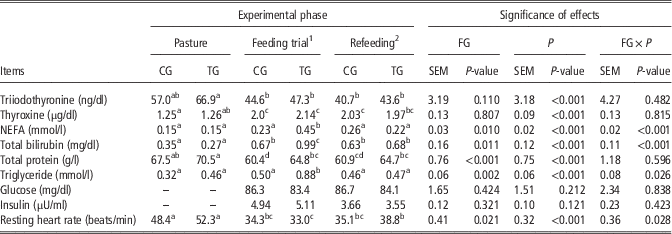
The RHR of CG and TG (Table 1) animals was higher during the pasture phase than during the feeding trial (CG: F 1,79=80.8, P<0.001; TG: F 1,79=167.0; P<0.001) and refeeding phase (CG: F 1,54=34.4; P<0.001; TG: F 1,54=38.8; P<0.001). Reduced energy supply during the feeding trial resulted in a reduction in RHR in TG animals (RHR, beats/min=36.4+0.07 months; R 2=0.30; P<0.001), whereas the RHR in CG animals increased slightly (RHR, beats/min=31.6+0.54 months; R 2=0.11; P=0.02) so that both groups differed at the end of the feeding trial (F 1,8=11.84; P=0.009). Treatment group animals increased their RHR during refeeding by 5.8±1.34 beats/min resulting in different RHR between feeding trial and refeeding phase (F 1,59=49.08; P<0.001). The CG displayed no change in RHR.
Blood and physiological parameters of treatment group (TG, five animals) and control group (CG, five animals) in Shetland ponies during three feeding phases

FG=feeding group; P=phase; FG×P=interaction of feeding group and phase; NEFA=non-esterified fatty acids.
a,b,c,dValues with different superscripts within a row differ (P<0.05).
1 Reduced food supply in TG animals, adequate energy and protein supply in CG animals.
2 Increase of food supply in TG animals according to recommendations.
Thyroid hormones
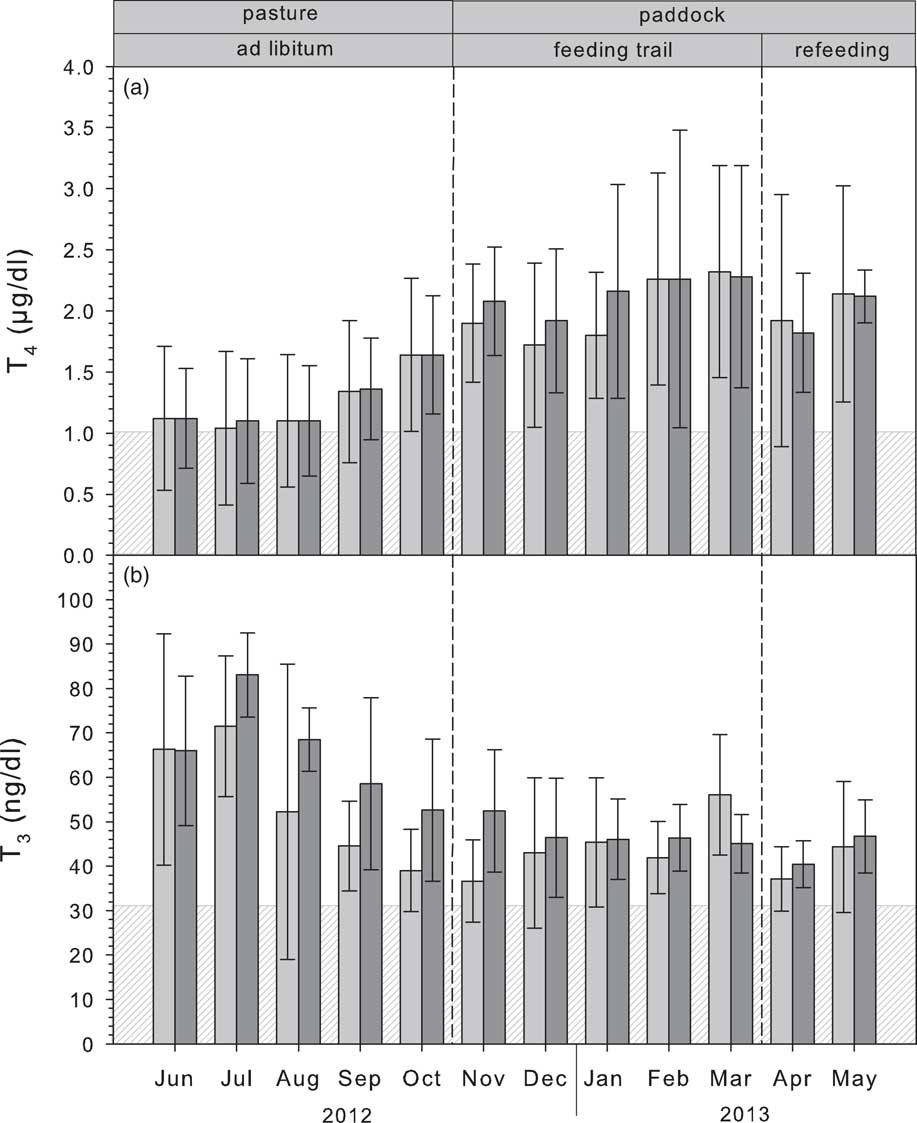
Thyroid hormone (TH) concentrations exhibited considerable seasonal changes (Figure 3). Plasma T4 concentrations increased from June until March and showed a slight decline thereafter. This resulted in significantly lower values during the pasture phase (1.26±0.53 μg/dl) compared with the feeding trial (2.07±0.74 μg/dl; F 1,89=107.2, P<0.001) and refeeding phase (2.00±0.68 μg/dl; F 1,59=62.2; P<0.001; Table 1). In contrast, plasma T3 concentrations decreased from July until November and remained fairly low until the end of the study with significantly higher T3 concentrations on pasture (61.71±21.18 ng/dl) compared with the feeding trial (45.93±11.8 ng/dl; F 1,87=32.5, P<0.001) and refeeding period (42.15±9.55 ng/dl, F 1,57=22.0, P<0.001). The two feeding groups did not differ in their plasma TH concentrations at any phase (Pasture T4: F 1,38=0.00, P=0.96; T3: F 1,38=1.34, P=0.25; feeding trial T4: F 1,40=0.09, P=0.76; T3: F 1,40=0.20, P=0.66; refeeding T4: F 1,10=0.02, P=0.98; T3: F 1,10=0.27, P=0.62).
Average monthly plasma concentrations of thyroxine (T4; a) and triiodothyronine (T3; b) in Shetland ponies. Light gray columns indicate control animals (n=5) fed at maintenance energy requirement, dark gray columns show animals being fed restrictively (n=5) during the feeding trial phase. White area indicates the reference range for the respective parameter.

Plasma metabolites
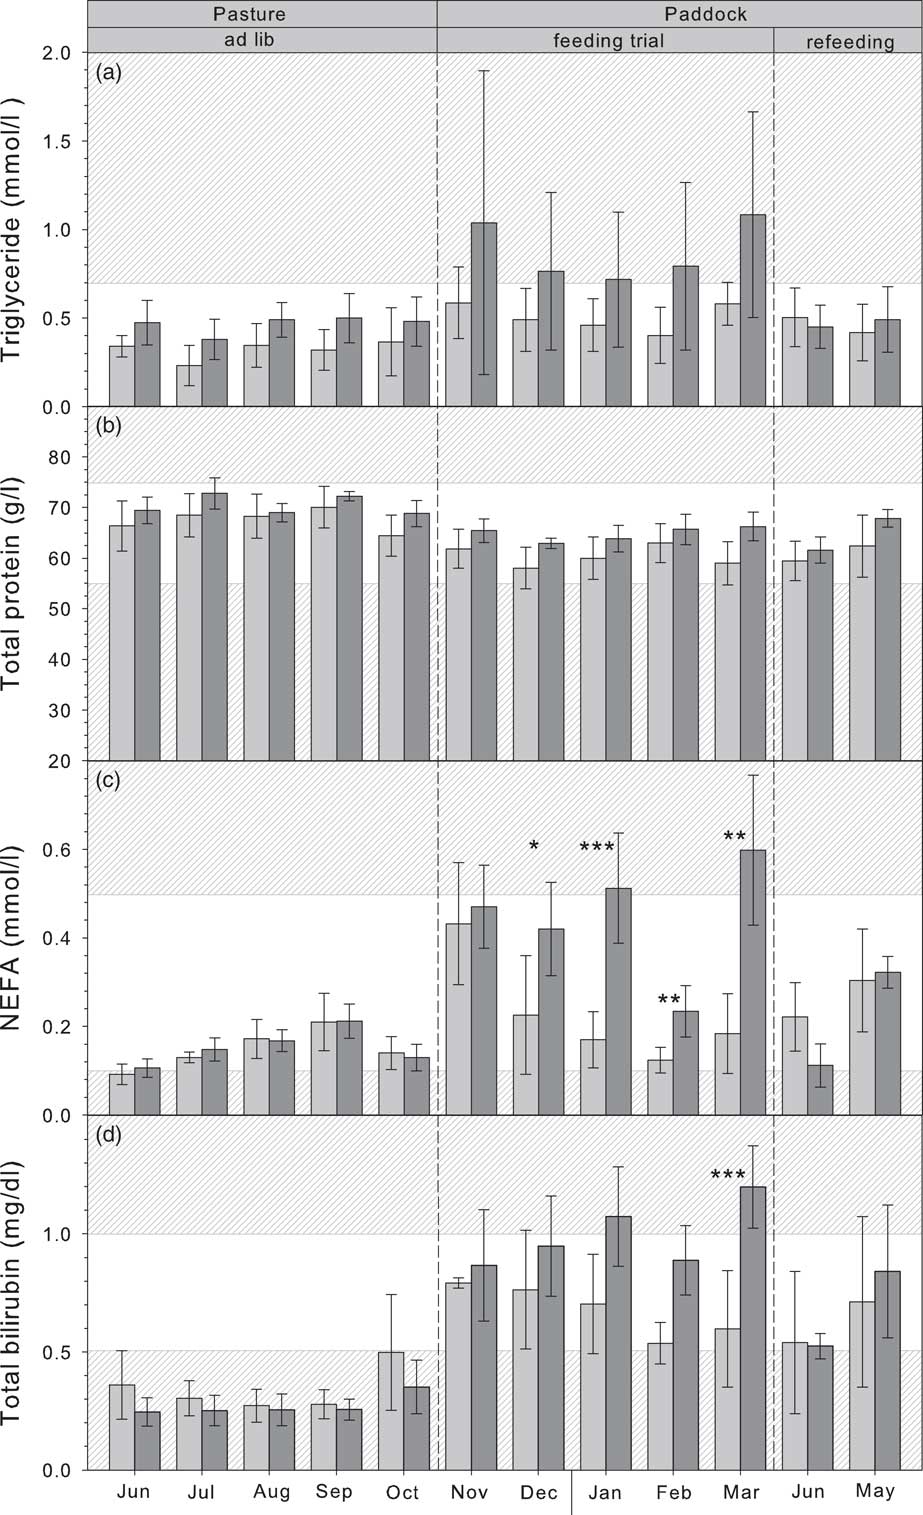
The plasma triglyceride concentrations of both feeding groups were lower when animals were kept on pasture than during the feeding trial period (CG: F 1,44=39.3, P<0.001 and TG: F 1,44=32.7, P<0.001; Table 1). Refeeding triglyceride concentrations of TG animals differed from their feeding trial phase (F 1,29=12.3; P<0.002) but not from their pasture phase (F 1,29=0.30; P=0.59). In CG animals triglyceride concentrations during refeeding did not differ from those during the feeding trial (F 1,29=1.59; P=0.217), but did differ from those on pasture (F 1,29=15.6; P>0.001; Figure 4, Table 1). Non-esterified fatty acids and total bilirubin concentrations displayed similar seasonal variations and were highly correlated in TG (r=0.78, P<0.001) and CG animals (r=0.40, P<0.001). During summer on pasture NEFA and total bilirubin concentrations were low but increased in both CG and TG animals, at the start of the feeding trial. Although in CG animals NEFA and total bilirubin concentrations decreased during the feeding trial, both metabolites increased in TG animals resulting in significant differences between TG and CG animals for a few measurements during the feeding trial (Figure 4). Non-esterified fatty acid concentrations differed between the pasture and feeding trial phase in TG (F 1,44=7.0; P=0.011), but not in CG animals (F 1,44=4.5; P=0.05). Total bilirubin, however, differed in both groups between the pasture and feeding trial phase (TG: F 1,44=310.4; P<0.001; CG: F 1,43=61.9, P=0.001). During refeeding, NEFA and total bilirubin concentrations decreased again in TG and differed from the feeding trial (NEFA: F 1,29=16.3, P<0.001; total bilirubin: F 1,29=20.9, P<0.001), but not in CG animals (total bilirubin: F 1,28=1.2, P=0.29; NEFA: F 1,29=0.36, P=0.55). In contrast, total protein concentration revealed no significant seasonal rhythm and there were no differences (P>0.05) in plasma total protein concentrations between feeding groups during the entire experiment. No differences could be detected in glucose and insulin concentrations neither between the feeding groups nor feeding phases (Table 1).
Average monthly plasma concentrations of triglycerides (a), total protein (b), non-esterified fatty acids (NEFA; c) and total bilirubin (d) in Shetland ponies. Light gray columns indicate control animals (n=5) fed at maintenance energy requirement, dark gray columns show animals fed restrictively during the feeding trial phase (n=5). White area indicates the reference range for the respective parameter. * = P<0.05, ** = P<0.01, *** = P<0.001.

Discussion
Body weight, body condition score, cresty neck score and hair coat
The unlimited access to food during the summer period on extensive pasture allowed all ponies to increase their BW and BCS and generate considerable body fat reserves. In late autumn, when food quality and quantity on pasture declined pony’s BW started to decrease. Similar increases and decreases in BW and BSC have been reported in other studies (Rudman and Keiper, Reference Rudman and Keiper1991; Suagee et al., Reference Suagee, Burk, Quinn, Petersen, Hartsock and Douglass2008). During the subsequent feeding trial both, BW and BCS, continued to decrease concomitantly in TG animals. They lost about 12.8% (20.1 kg) of their initial BW and reduced their BCS from fat/very fat to moderate/good (during the 16 weeks of the feeding trial). In our study, BW loss slightly preceded any decrease in BCS that might be due to the early depletion of intra-abdominal fat deposits (Dugdale et al., Reference Dugdale, Curtis, Cripps, Harris and Argo2010). The CG kept their BW and BCS constant indicating that the supplied amount of food met their energetic requirements. The assessment of regional body fat by the CNS system added no more detailed information on adiposity in our ponies as increased crest fatness was only found in two animals in summer. In winter, the main mechanism by which large mammals resist cold is to avoid or reduce thermolysis by better thermal insulation. This can be achieved by vasoconstriction and maximizing the insulation provided by the subcutaneous adipose tissue, skin and hair coat (Langlois, Reference Langlois1994). We found a four-fold increased hair length in winter compared with summer. Under food scarcity animals had less energy available to fuel metabolic rate and thermoregulation, thus the importance of body insulation becomes even higher. However, the feed restricted animals were not able to increase their body insulation by increased hair length. It has been shown, that protein availability influences hair growth (Russel and Redden, Reference Russel and Redden1997) and that there probably exists a physiological limit for hair elongation (Hebert et al., Reference Hebert, Rosenquist, Gotz and Martin1994). At the same time, subcutaneous adipose tissue was reduced in TG animals as indicated by their declining BCS, suggesting that adaptation to reduced energy supply under cold temperatures was not enhanced by the mechanism of increased thermal insulation.
Thyroid hormones
The TH T4 and T3 are vitally integrated into many body functions, including growth, reproduction, lactation, exercise, carbohydrate and lipid metabolism, energetics as well as thermogenesis (Carter, Reference Carter, Geor, Staniar, Cubitt and Harris2005). The relationship between TH and metabolic rate in our ponies is discussed elsewhere (Brinkmann et al., Reference Brinkmann, Gerken, Hambly, Speakman and Riek2016). Acute cold exposure leads to increased concentrations of T3 and T4 within several hours as, for example, shown in sheep (Ekpe and Christopherson, Reference Ekpe and Christopherson2000), whereas in other studies on cold acclimatized horses T3 and/or T4 concentrations did not increase during low T a (McBride et al., Reference McBride, Christopherson and Sauer1985). In cattle heat stress is associated with reduced TH secretion and thus reduced T3 and T4 concentrations (Johnson et al., Reference Johnson, KaLli, Hahn and Shanklin1988). However, Mejdell and Bøe (Reference Mejdell and Bøe2005) could not find any correlation between T4 and T a in ponies. The lower plasma T4 concentrations in summer compared with winter in our ponies may be attributed to a reduced secretory activity of the thyroid gland in order to reduce metabolic heat production. However, in our ponies plasma T3, the biological active molecule in mammals (Elliott et al., Reference Elliott, Welcker and Gaston2013), was higher in summer compared with winter. Total T3 has been proven to be highly correlated with basal metabolic rate (BMR), whereas no relationship between T4 and BMR could be established (Elliott et al., Reference Elliott, Welcker and Gaston2013). Thus, it is plausible that our ponies had a decreased metabolic activity in winter. This assumption is also supported by the decreased RHR in winter, as heart rate is a reliable indicator for the metabolic rate (Currie et al., Reference Currie, Körtner and Geiser2014). All T4 values measured in our ponies were within the reference range for horses (1.3 to 4.1 μg/dl; Laboklin, 2016). Other studies on horses and ponies found T4 concentrations between 1.2 and 3.1 μg/dl (Suwannachot et al., Reference Suwannachot, Verkleij, Kocsis, Enzerink and Everts2000; Mejdell and Bøe, Reference Mejdell and Bøe2005). Similarly, T3 concentrations were within the reference range of 0.3 to 1.8 ng/ml (Kraft and Dürr, Reference Kraft and Dürr2005) and consistent with T3 concentrations found in experiments in horses and ponies (0.32 to 1.45 ng/ml) (Suwannachot et al., Reference Suwannachot, Verkleij, Kocsis, Enzerink and Everts2000; Breuhaus, Reference Breuhaus2002).
During the feeding trial both groups did not reveal any differences in TH. Generally energy intake below demand is associated with decreased serum T3 concentrations, whereas the T4 concentration is not necessarily altered (Suwannachot et al., Reference Suwannachot, Verkleij, Kocsis, Enzerink and Everts2000). In a study on horses Sticker et al. (Reference Sticker, Thompson, Bunting, Fernandez, Depew and Nadal1995) reported no effect of energy restriction on plasma T3 and T4 concentrations. Prolonged feed restriction in ponies caused a decrease in plasma T3 concentrations and increasing plasma T4 concentrations (Suwannachot et al., Reference Suwannachot, Verkleij, Kocsis, Enzerink and Everts2000). The present restrictive feeding of TG had no consistent influence on the TH concentrations. However, in contrast to other studies our fasted ponies were additionally exposed to low T a generally increasing TH. This may have altered the response of the pituitary gland and TH to feed restriction, thus partly explaining the conflicting results.
Plasma metabolites
Inadequate energy uptake and the consequential insufficient glucose availability result in decreasing insulin concentrations. Counter-regulatory hormones accelerate lipolysis in adipose tissue with the release of NEFA (Kronfeld et al., Reference Kronfeld, Treiber, Hess and Boston2005). As expected, only small concentrations of NEFA were found during the pasture phase when ponies had permanent access to food. The reduced winter food supply in TG animals did not alter their insulin and glucose concentrations but led to accelerated mobilization of body fat reserves and subsequent high plasma concentrations of NEFA. Non-esterified fatty acid levels increased as energy restriction proceeded and occasionally exceeded the reference range indicating intensive lipolysis. The CG animals showed only in November an increase in NEFA that can be attributed to the change of ration during transfer from pasture to paddock housing. In plasma, TH are bound to thyroxin-binding globulin, transthyretin and albumin (Feldt-Rasmussen and Rasmussen, Reference Feldt-Rasmussen and Rasmussen2007). Non-esterified fatty acids can also be bound to these proteins (Lim et al., Reference Lim, Munro, Wynne, Topliss and Stockigt1995; Kronfeld et al., Reference Kronfeld, Treiber, Hess and Boston2005) and it is assumed that high NEFA concentrations can inhibit the protein binding of circulating TH and increases the serum concentration of free TH (Craik et al., Reference Craik, Duggan and Munro1996). Non-esterified fatty acids are also suggested to act as an inhibitor of extrathyroidal conversion of T4 to T3 (Suzuki et al., Reference Suzuki, Nanno, Gemma and Yoshimi1992). In our feed restricted ponies NEFA exceeded the reference range and may therefore have influenced the transport of TH into the cells, the conversion of T4 to T3 and thereby the plasma TH concentrations.
Only a small part of NEFA is directly utilized as an energy source in the tissues, whereas the larger part is taken up by the liver and re-esterified mainly to very-low-density lipoproteins, commonly measured as plasma triglyceride in the horse. Fatty acids derived from NEFA and very-low-density lipoproteins are then taken up by muscle cells (Kronfeld et al., Reference Kronfeld, Treiber, Hess and Boston2005). This mechanism explains the elevated triglyceride concentrations in our restrictively fed ponies. The triglyceride concentrations of TG animals exceeded the reference range for ponies (0 to 0.97 mmol/l; Laboklin, 2016) during the entire feeding trial, whereas the concentrations of CG animals were well within the reference range. High triglyceride concentrations caused by reduced food availability, as seen in TG animals during the feeding trial, can lead to hyperlipidemia and hyperlipemia in ponies which is often associated with lipid infiltration of the tissues, like liver and kidney (Mogg and Palmer, Reference Mogg and Palmer1995).
It is known that NEFA is competing with total bilirubin for carrier proteins in the blood (e.g. albumin) and transport proteins in the hepatocytes (Kraft and Dürr, Reference Kraft and Dürr2005). This can increase the proportion of bilirubin in serum and cause hyperbilirubinemia as described previously for horses (Naylor et al., Reference Naylor, Kronfeld and Johnson1980). Thus, in our study the increased NEFA concentrations in TG animals led to increased total bilirubin concentrations exceeding the reference range for ponies (up to 1.0 mg/dl; Kraft and Dürr, Reference Kraft and Dürr2005). The low total bilirubin concentrations of both groups during pasture, being below the reference range, do not indicate pathological changes. The lower plasma total protein concentrations in winter compared with summer may be due to the change in feed. On pasture an oversupply with dietary protein in horses is common (Meyer and Coenen, Reference Meyer and Coenen2014), whereas the reduced protein availability in hay may have reduced the plasma total protein concentration. However, all measured values in our study were within the reference range (55 to 75 g/l) for ponies (Laboklin, 2016).
Refeeding phase
The study also examined the recovery of TG ponies from feed restriction during a refeeding phase of 2 months. For most of the traits recorded, very prompt shifts were observed, indicating a highly efficient recovery capacity of the ponies studied. The stepwise increase of food quantity in TG during the refeeding phase led to a rapid increase in BW by 34% of the previous BW loss. This may be attributed to specific metabolic mechanism such as the high metabolic plasticity of skeletal muscle (Summermatter and Handschin, Reference Summermatter and Handschin2012) that contributes to an elevated efficiency of energy utilization. This thrifty program and the lower energy expenditure after weight loss promotes the refilling of energy stores resulting in a rapid and efficient weight regain during refeeding (MacLean et al., Reference MacLean, Higgins, Jackman, Johnson, Fleming-Elder, Wyatt, Melanson and Hill2006; Summermatter and Handschin Reference Summermatter and Handschin2012).
In parallel, the increased BCS underlines the quick restoration of body reserves. Analysis of body composition revealed that nearly all the energy, saved as a result of the adaptive changes in energy expenditure, is deposited as fat rather than protein (MacLean et al., Reference MacLean, Higgins, Jackman, Johnson, Fleming-Elder, Wyatt, Melanson and Hill2006). However, part of the observed increase might be attributed to the recovery of skeletal muscle as indicated by Summermatter and Handschin (Reference Summermatter and Handschin2012). Interestingly, the RHR increased in TG animals during the refeeding phase. This may be due to higher metabolic activity due to digestion of increased food quantity. In addition, considering RHR as an indicator of metabolic rate (Currie et al., Reference Currie, Körtner and Geiser2014), these results suggest the capacity for flexible modifications of metabolic rate. Most striking is the quick reversal of blood parameters which changed from un-physiological high levels for NEFA, triglyceride and total bilirubin to normal levels after 1 month of refeeding.
Conclusions
To our knowledge this is the first long-term study providing data of seasonal changes across one year in morpho-physiological and physiological parameters as well as plasma metabolite and hormonal concentrations in a robust domestic horse breed, the Shetland pony, kept under semi-extensive conditions. We conclude that ponies kept under naturally changing climatic conditions with an adequate food supply showed a remarkable adaptation capacity in physiological, morphological and endocrine parameters. Blood parameters of CG animals were hardly affected by season indicating that the animals were able to maintain their internal milieu stable with changing external effects. However, energy scarcity under winter conditions can only be compensated at the cost of body energy reserves and possibly health status. These adaptions appear to have occurred at the expense of liver metabolism resulting in a metabolic overload as indicated by high total bilirubin and triglyceride concentrations. T3 and RHR being used as proxies for BMR were affected by season indicating a reduction of BMR in winter. T3 and T4 may serve as indicators for seasonal changes in BMR, but appear less reliable during feed restriction. Refeeding in TG animals revealed remarkable quick recovery from a 4-month feed restriction indicating a high flexibility in adapting their metabolism. The transfer of our findings to warm-blooded or thoroughbred horses might be limited as these breeds exhibit lower body fat accumulation and less hair coat insulation in winter as well as different capacities to modulate their metabolism due to their selection for higher locomotor efficiency.
Acknowledgments
The authors thank J. Dörl for help with data collection and care of the animals. The veterinary support of M. Beihsner (DVM) is highly appreciated. The study was supported by a grant from the German Research Foundation (DFG; GE 704/13-1).