1. Introduction
Granite-type uranium deposits around the world are usually developed in geological bodies with extensive metasomatic alteration (Ballouard et al. Reference Ballouard, Poujol, Boulvais, Mercadier, Tartese, Venneman, Deloule, Jolivet, Kéré and Cathelineau2017; Zhang, B. L. et al. Reference Zhang, Shan, Li, Xiao, Wang and Zhang2017; Chi et al. Reference Chi, Haid, Quirt, Fayek, Blamey and Chu2017; Bonnetti et al. Reference Bonnetti, Liu, Mercadier, Cuney, Deloule, Villeneuve and Liu2018; Qiu et al. Reference Qiu, Yan, Ren, Cao, Tang, Guo, Fan, Qiu, Zhang and Wang2018). The imbalance between wall rock and hydrothermal circulation promotes system rebalancing through the formation of new minerals (Browne, Reference Browne1978; Mielke et al. Reference Mielke, Nehler, Bignall and Sass2015; Deng & Wang, Reference Deng and Wang2016). This changes the physical and chemical properties of the wall rocks (Barrett et al. Reference Barrett, MacLean and Tennant2001, Reference Barrett, MacLean and Årebäck2005, Reference Barrett, Dawson and MacLean2008; Stimac et al. Reference Stimac, Goff, Counce, Larocque, Hilton and Morgenstern2004; Gemmell, Reference Gemmell2007; Lenhardt & Götz, Reference Lenhardt and Götz2011; Mielke et al. Reference Mielke, Nehler, Bignall and Sass2015; Barrett & Joseph, Reference Barrett and Joseph2018) and produces different hydrothermal alteration assemblages. Thus, hydrothermal alteration records fluid–rock interactions that are manifested in compositional changes in the rock geochemistry. These changes in composition can be further used to trace ore occurrence (Warren et al. Reference Warren, Simmons and Mauk2007; Mauk & Simpson, Reference Mauk and Simpson2007; Montreuil et al. Reference Montreuil, Corriveau and Grunsky2013, Reference Montreuil, Corriveau and Potter2015; Yan et al. Reference Yan, Lennox and Offler2016; Deng et al. Reference Deng, Wang and Li2017).
The Nanling Range is a very important region of granite-type uranium deposits in China. Although the granite-type uranium deposits have received a great deal of attention in the last half century (Cloutier et al. Reference Cloutier, Kyser, Olivo and Alexandre2010; Luo et al. Reference Luo, Hu, Fayek, Li, Bi, Abdu and Chen2015; Chi et al. Reference Chi, Haid, Quirt, Fayek, Blamey and Chu2017; Liang et al. Reference Liang, Chi, Ashton, Blamey and Fayek2017), only a few papers have used element migrations in the wall rock alteration to calculate the amount of element migration between the altered rock and fresh rock (Deng et al. Reference Deng, Tu, Li and Liu1999; Zhang & Yang, Reference Zhang and Yang2002; Warren et al. Reference Warren, Simmons and Mauk2007; Guo et al. Reference Guo, Ye, Chen and Liu2009). Such geochemical comparisons between the altered rocks and fresh rock can provide useful information about element migration only under the premise of a closed system with a constant total volume. In most cases, hydrothermal alteration is an open system involving elemental gain and loss (MacLean, Reference MacLean1990; Madeisky & Stanley, Reference Madeisky and Stanley1993; Guo et al. Reference Guo, Ye, Chen, Liu and Zhang2013), which can give inaccurate information about the gains or losses of the components. The root cause of this problem is that in an open system, the total mass will change during hydrothermal alteration. Previous studies have proposed an alternative approach using immobile elements as a reference point (Gresens, Reference Gresens1967; Grant, Reference Grant1986; MacLean & Barrett, Reference MacLean and Barrett1993; Guo et al. Reference Guo, Ye, Chen, Liu and Zhang2013; Hilchie et al. Reference Hilchie, Russell and Stanley2018) and take into account volume changes in altered rocks (Warren et al. Reference Warren, Simmons and Mauk2007).
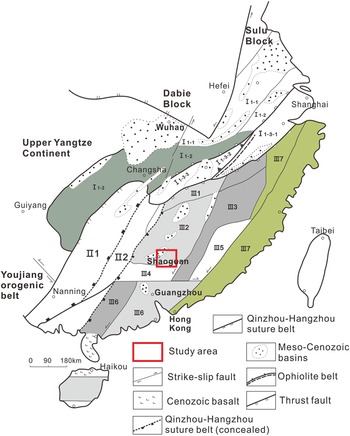
The Egongtang uranium deposit is located in the southern part of the Qingzhangshan granites of the central Nanling Range (Fig. 1). There are few published studies on this uranium deposit (Mao et al. Reference Mao, Shen and Zhang2002; Zhang et al. Reference Zhang, Chen, Huang, Tan, Ling and Chen2006; Chen et al. Reference Chen, Xiao, Fan and Wen2013; Wu et al. Reference Wu, Li, Chen, Huang and Gao2016), which mainly focus on the ore-controlling structure, age and geochemical composition of the ore-hosting granites. The alteration of the host rocks is poorly constrained. The purpose of this paper is to describe the alteration characteristics of the Egongtang uranium deposit in detail. Mass balance calculations are used to quantify the transfer of chemical elements during the alteration. This study contributes to improving the understanding of the metallogenic characteristics and metallogenic processes of the Egongtang uranium deposit, and provides new guidance for granite-related uranium exploration in the area.
Regional tectonic map of South China (modified from Gao et al. Reference Gao, Luo, Zhang, Zhang, Han, Zhao and Kern1999). I – Yangtze Continent; I1 – middle and lower Yangtze block; I1-1 – depression zone in the middle and lower reaches of the Yangtze River; I1-2 – Jiangnan Uplift zone; I1-3 – Zhejiang–Jiangxi junctional zone; I1-3-1 – Huaiyu depression zone; I1-3-2 – Wangnian nappe uplift zone; I1-3-3 – Pingxiang–Fengcheng depression zone; II – Caledonian orogenic belt on Yangtze continental margin; II1 – Hunan–Guangxi depression belt; II2 – Eastern Hunan depression belt; III – Southeast Caledonian orogenic belt; III1 – Wugong Mountain – Kuaiji Mountain front thrust belt; III2 – Central Southern Jiangxi uplift belt; III3 – Wuyi uplift belt; III4 – North Guangdong depression belt; III5 – northwestern Fujian depression belt; III6 – Lingnan uplift zone; III7 – coastal volcanic fault basins.

2. Geological background
2.a. Regional geology
The Nanling Range is located on the Fujian–Jiangxi Caledonian uplift and is adjacent to the Variscan–Indosinian depression belt in the north of Hunan, Guangxi and Guangdong provinces (Fig. 1). The Egongtang deposit is located in the Qingzhangshan granites in the central part of the Nanling uranium polymetallic metallogenic belt (Mao et al. Reference Mao, Shen and Zhang2002; Chen et al. Reference Chen, Huang, Zhu, Chen, Huang, Zhao and Tian2014). The granite cropping out in the area is the multi-stage Qingzhangshan composite granite. The main granite body is the Indosinian coarse-grained porphyritic biotite granite, which is also the main host to uranium mineralization. The second largest body is the fine-grained two-mica granite that was emplaced in early Yanshanian time, and is located to the south of the study area. In addition, the late Yanshanian fine-grained granite, quartz syenite dykes and intermediate-basic dykes (diabase) are also exposed in the area (Zhang et al. Reference Zhang, Chen, Huang, Tan, Ling and Chen2006; Tao et al. Reference Tao, Li, Li and Cen2013).
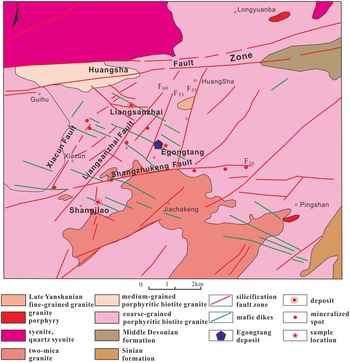
The deformation in the area is intense, and there are mainly three groups of faults that trend E–W, NE and NW. The E- and W-trending Huangsha and Shangzhukeng faults cross the whole area (Fig. 2). They are components of the Zhushan–Zhengang fold belt, which jointly form the Huangsha fault depression belt and control the spatial extension of the Huangsha district. The Liangsanzhai fault is the main NE-trending fault, which is dominated by an altered fracture zone and controls the distribution of ore deposits in the area. The NW-trending faults are mostly filled with intermediate-basic dykes, which are widely distributed in the mining area, showing equal space distribution and tensioning and torsioning characteristics. The Shangjiao, Liangsanzhai and Egongtang uranium deposits crop out in the area (Fig. 2). According to the geological characteristics of the uranium deposits and locations of the ore bodies, the uranium deposits can be divided into silicified and intersection point types. The orebodies of the Egongtang uranium deposit are located at the intersection of the NE-trending silicified fault and the NW-trending diabase dykes, which is a typical intersection-point-type uranium deposit (Chen et al. Reference Chen, Huang, Zhu, Chen, Huang, Zhao and Tian2014).
Geological sketch of the Huangsha area in the Qingzhangshan mining district in the central Nanling Range (modified from Mao et al. Reference Mao, Shen and Zhang2002).

2.b. The Egongtang deposit
The Egongtang uranium deposit is located in the central-southern part of Qingzhangshan granitic batholith, southeast of the Liangsanzhai fault and north of the Shangzhukeng fault (Fig. 2).
The area was a locus for magmatic, tectonic and hydrothermal activities. The igneous rocks cropping out include coarse–medium-grained porphyritic biotite granite of the transition phase, fine-grained two-mica granite of the marginal phase and fine-grained two-mica granite of the complementary phase in the early Yanshanian period, fine-grained granite of the late Yanshanian period and medium-basic dykes. The structures in the deposit are interlaced and form a grid framework (Fig. 2). The NE-trending Liangsanzhai fault is the dominant fault that runs diagonally through the whole area, and the NW-trending secondary fault F61 and the NE-trending secondary fault F60 are the main ore storage structures of the deposit (Fig. 2). The mineralization is well developed in the area of structural bending and expansion, and in the compound area of structural branches. The mineralized wall rocks are coarse-grained, coarse–medium-grained porphyritic biotite granite and altered biotite granite (Mou et al. Reference Mou, Pan, Huang, Zhong, Liu and Meng2016; T. T. Shu, unpub. Master’s thesis, China Univ. Technology, 2017). Ore bodies are strictly controlled by F60 and F61. There are two main mineralization positions, which are (1) the intersection between the main structure and the different direction of the secondary structures, and (2) the obliquely connected, reconnected and reversely connected position between the silicified fracture zone and the blastic lamprophyre veins. Industrial ore bodies were formed in these positions, and their occurrences are basically consistent with those of the main structural belt. Ore texture is simple, mainly disseminated, veinlet, etc. Uranium minerals mainly include pitchblende and uranite. Secondary uranium minerals include uranium black, pittinite, uranotile, calcouranite and so on, which are aggregates occurring between grains and cracks of ore. Gangue minerals are mainly fine quartz, microcrystalline quartz, chalcedony, fluorite, calcite, kaolin and so on. Metal minerals include pyrite, haematite, a small amount of galena, chalcopyrite and so on (Mou et al. Reference Mou, Pan, Huang, Zhong, Liu and Meng2016; Zhong et al. Reference Zhong, Pan, Xu, Qi, Shu, Mou and Wu2017; Wu et al. Reference Wu, Pan, Xia, Huang, Zhong, Qi, Hong and Zhou2018; Yan & Lennox, Reference Yan and Lennox2020).
2.c. Hydrothermal alteration
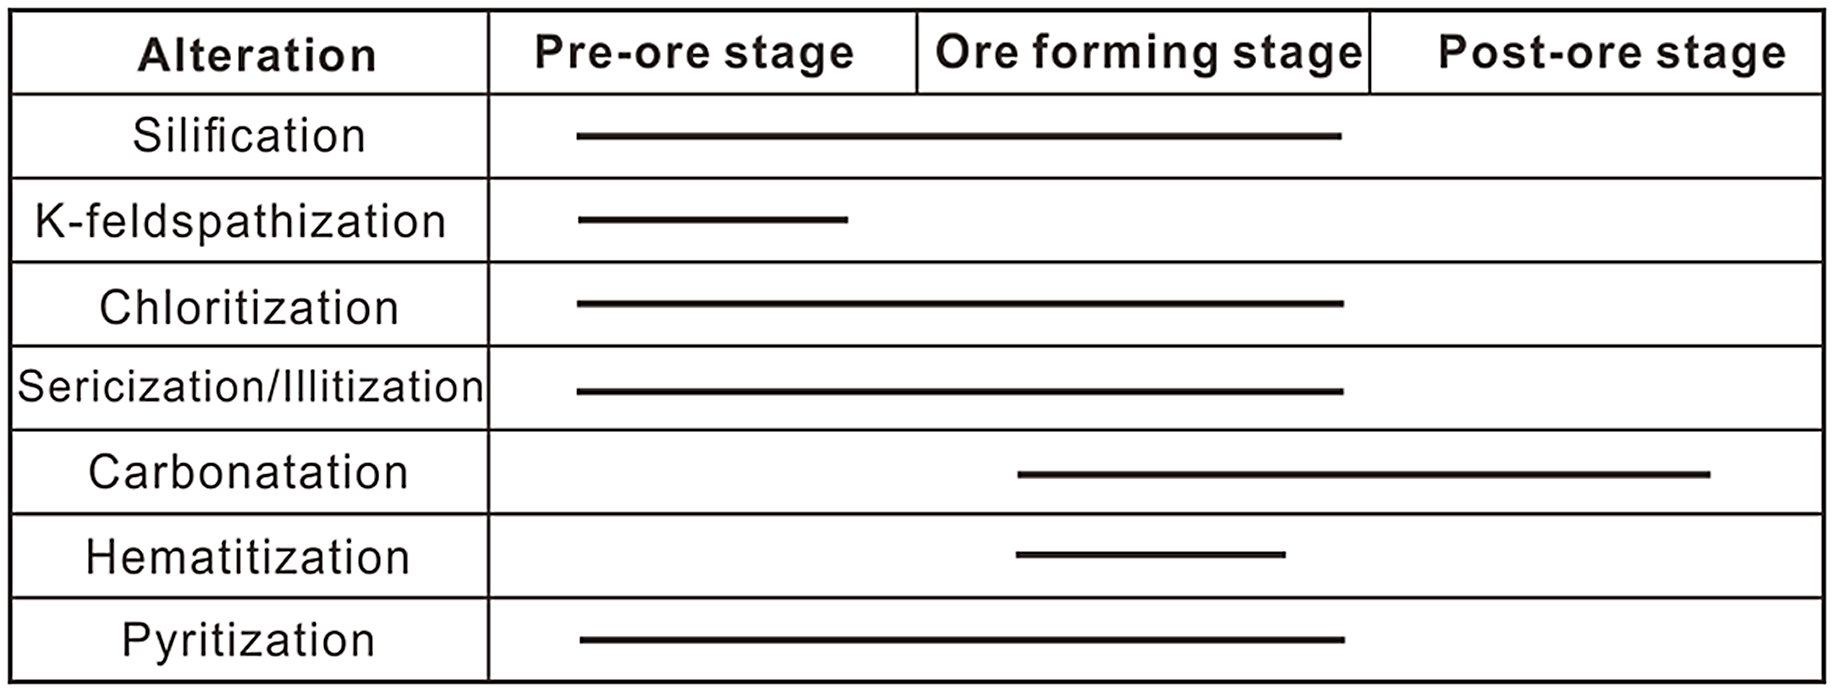
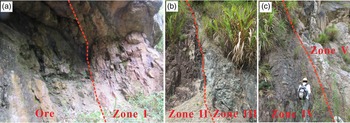
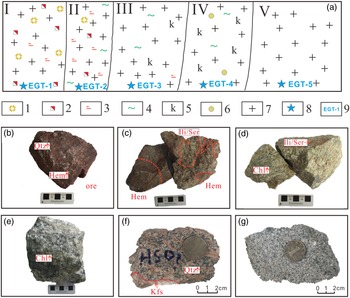
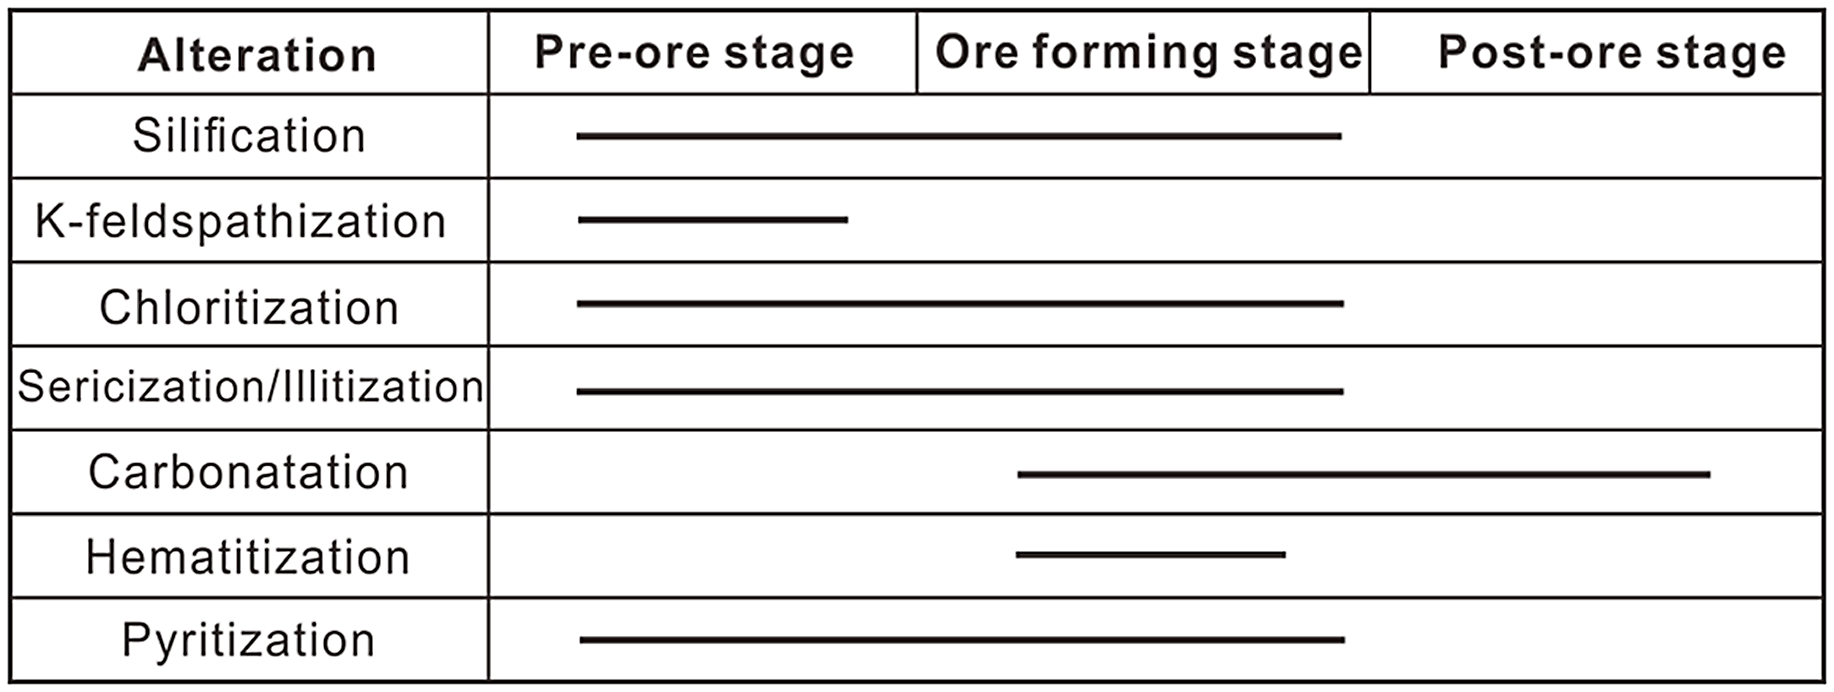
The alteration in the Egongtang uranium deposit is intensive and consists of K-feldspathization, silicification, chloritization, sericization/illitization, haematitization and pyritization and carbonatization (Fig. 3). The alteration of the wall rock has obvious zoning phenomena on the plane (Figs 4, 5). From the ore body centre to the outside, haematitization, silicification and illitization gradually weaken. Orebodies occur in the middle of the alteration zone. K-feldspathization was found in altered rocks with a red colour and occurs in the form of fine-grained K-feldspar replacing plagioclase (Figs 3, 5a). Silicification is the most common near-ore alteration in the Egongtang uranium deposit (Figs 3, 5a). There are two types of silicification in the deposit: (1) veins of quartz filled in feldspar and (2) overgrowth of quartz on primary quartz. The chloritization is linearly distributed on both sides of the ore-bearing veins or in the fractures of the wall rock. The chlorite is mainly formed by alteration of biotite in the host granite (Fig. 6g–i). This chlorite is usually formed prior to the alteration of the ores. The chlorite associated with uranium mineralization is derived from the alteration of feldspar and is generally formed during the mineralization stage.
Sequence of alteration of the Egongtang uranium deposit in the Nanling Uranium field, South China.
Outcrop pictures of alteration zones in the Egongtang deposit.

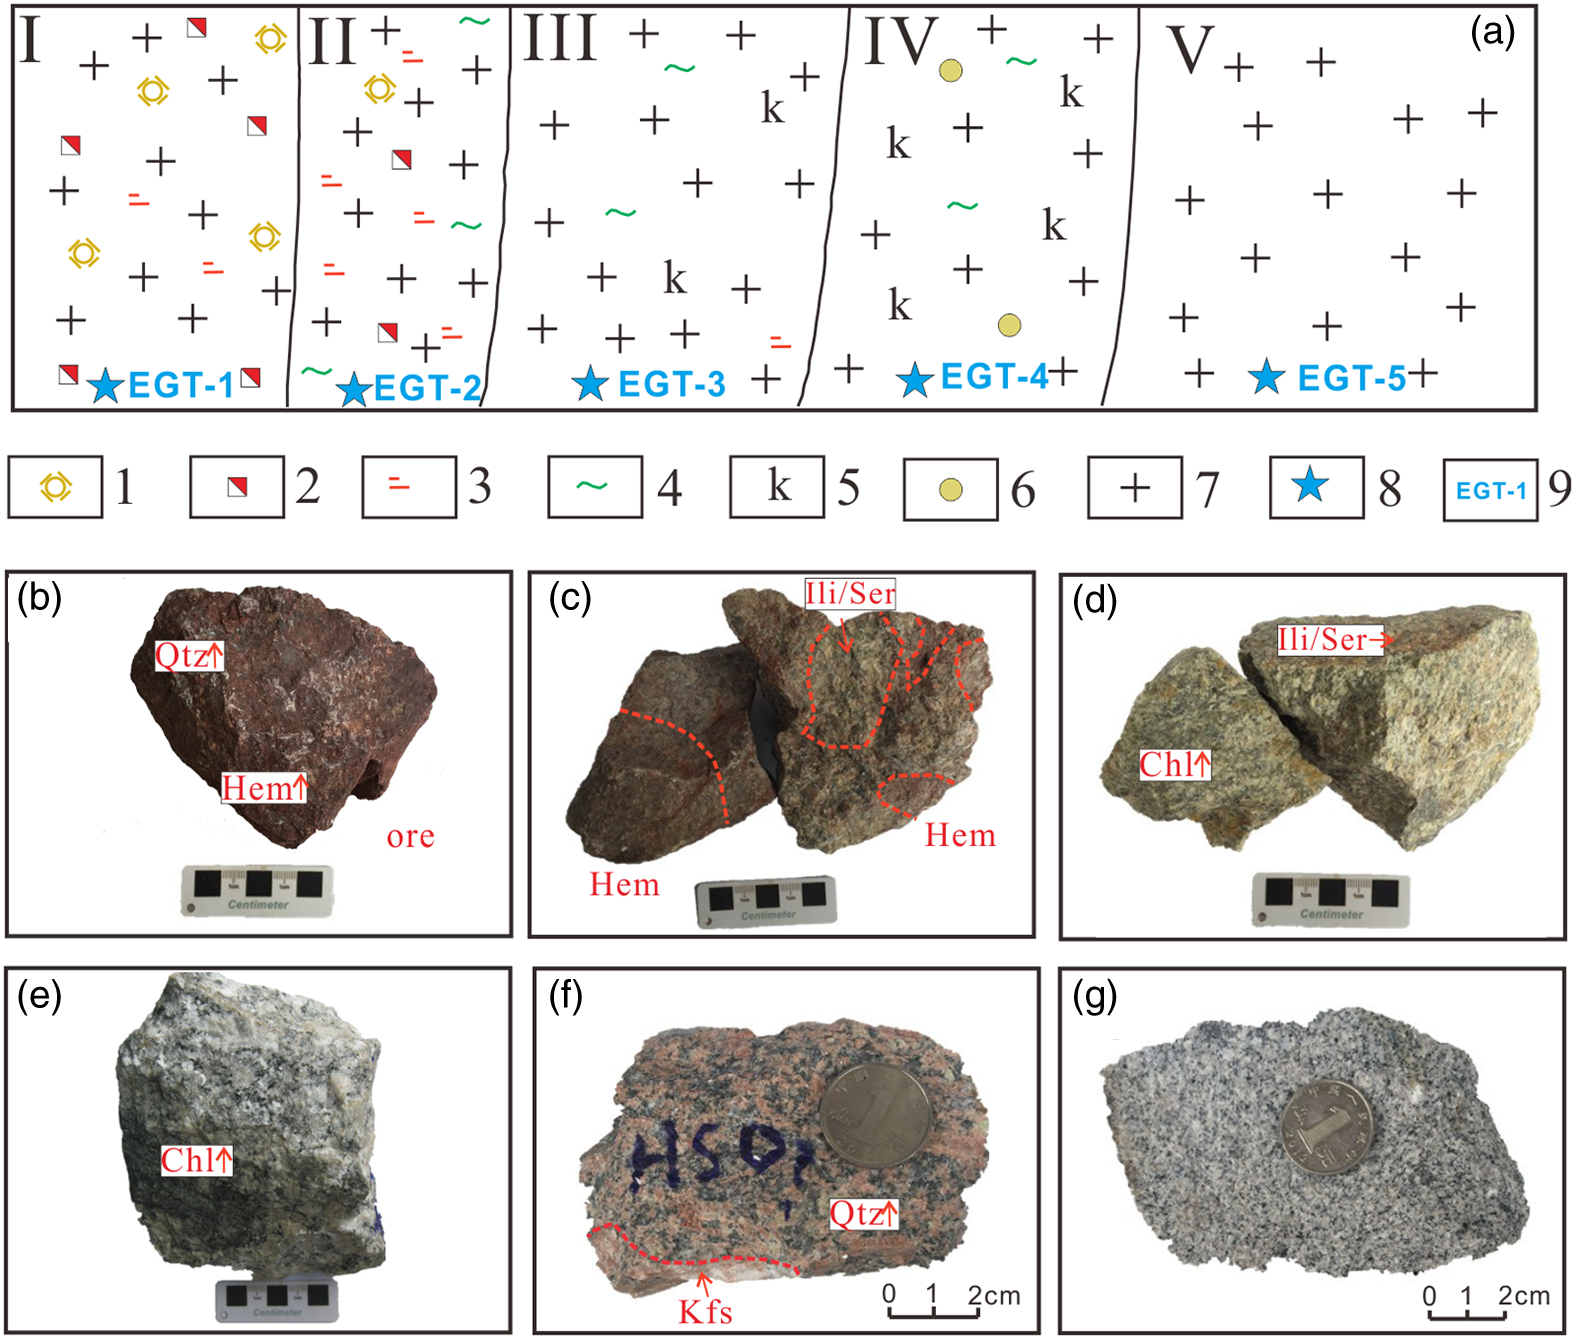
Sketch of alteration zones and photographs of hand specimens in the Egongtang uranium deposit. (a) Hydrothermal alteration zoning diagram and sampling locations of the Egongtang uranium deposit. (b) Uranium ore rock. (c) Cataclastic granite with strong haematitization from Zone I. (d) Granite with strong sericization/illitization from Zone II. (e) Granite with mainly chloritization from Zone III. (f) Granite with alkaline alteration from Zone IV. (g) Fresh granite from Zone V. Zone I – central mineralization zone; Zone II – close-to-ore alteration zone; Zone III – chlorite-rich zone; Zone IV – distal alkaline alteration zone; Zone V – fresh granite. 1 – silicification; 2 – haematitization; 3 – sericization/illitization; 4 – chloritization; 5 – potassic feldspathification; 6 – kaolinization; 7 – granite; 8 – sampling position; 9 – sample no. Mineral abbreviations: Kfs – K-feldspar; Qtz – quartz; Chl – chlorite; Ili – illite; Hem – haematite.
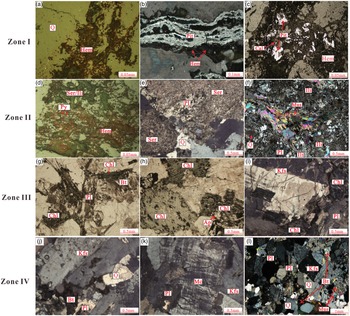
Typical photomicrographs under (a, d, e, f, g, h, i, j, k, l) plane-polarized light and (b, c) reflected light images of mineralization and alteration assemblages in the Egongtang uranium deposit. Mineral abbreviations: Ap – apatite; Bt – biotite; Cal – calcite; Hem – haematite; Hmic – illite; Kfs – K-feldspar; Mc – microcline; Mus – muscovite; Pl – plagioclase; Pit – pitchblende; Py – pyrite; Q – quartz; Ser – sericite.

Sericization/illitization has a linear and planar distribution. Most linear sericization/illitization occurs in the form of banded euhedral crystals and develops with cracks (Figs 4a, 5d–f). Plane illitization mainly occurs during partial or total replacement of the plagioclase. Haematite is disseminated on the surface and along the cleavage of the feldspar and biotite of the host granite and is usually associated with uranium mineralization (Figs 3–6). A generalized sequence of alteration is summarized in Figure 3.
3. Sample preparation and analytical methods
In order to systematically analyse the geochemical characteristics of the different types of rocks and the migration of elements during alteration and mineralization in the Egongtang uranium deposit, a total of 45 representative rock and ore samples (37 altered rock samples and 8 fresh granite samples) were collected from each alteration zone in the deposit. According to sample characteristics and mineralization alteration degree, the alteration can be divided into distal alkaline alteration (Zone IV), chlorite-rich alteration (Zone III), sericite/illite alteration (Zone II) and a central mineralization zone with strong haematitization (Zone I) (Fig. 5).
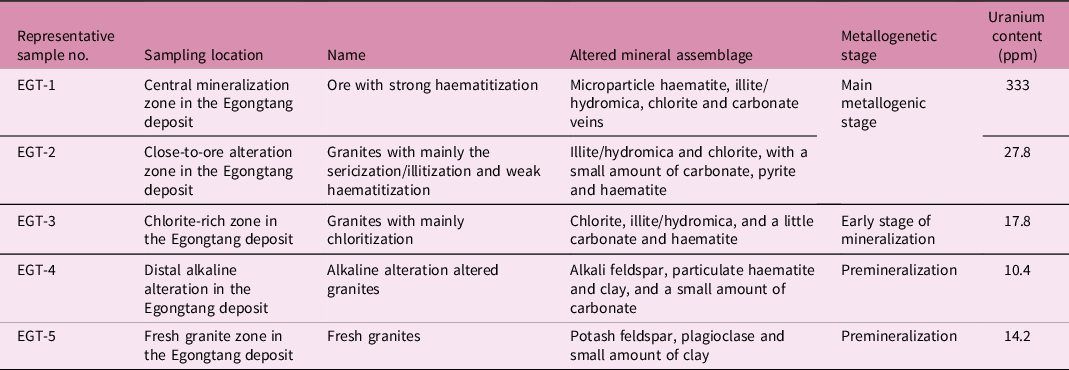
This alteration section has symmetrical zoning characteristics in lithology and mineral assemblages from the mineralization centre to both sides. The zoning schematic diagram of one side is shown in Figure 5a. From the mineralization centre to the fresh granite, the characteristics of each sample are shown in Table 1 and Figures 5 and 6.
Sampling locations and characters of the samples from the Egongtang uranium deposit

Based on the detailed petrographic and mineralogical observations, the representative rock and ore samples were crushed and ground to 200 mesh and sent to Analytical Chemistry and Testing Services (ALS) Chemex Co. Ltd for the analysis of major-, trace- and rare earth element (REE) concentrations. Major-element analysis was carried out on a PANalytical PW2424 X-ray fluorescence spectrometer (XRF) produced by Malvern PANalytical Ltd of the Netherlands. The relative deviation (RD) of the test and analysis results is less than 5 %. The relative error (RE) is less than 2 %. The trace-element and REE analysis was carried out on an Agilent 7700X inductively coupled plasma mass spectrometer (ICP-MS) produced by Agilent Technologies of the United States. The analytical errors were <5 % for REEs and high field strength elements (HFSEs), and 5–10 % for the other elements, based on repetitive analysis of standards NCSDC47009 and SARM-5. Detailed analytical procedures followed those outlined by Zhang et al. (Reference Zhang, Guo, Zhang, Wu, Wang and Zhao2019). The test results are shown in Tables 2–4.
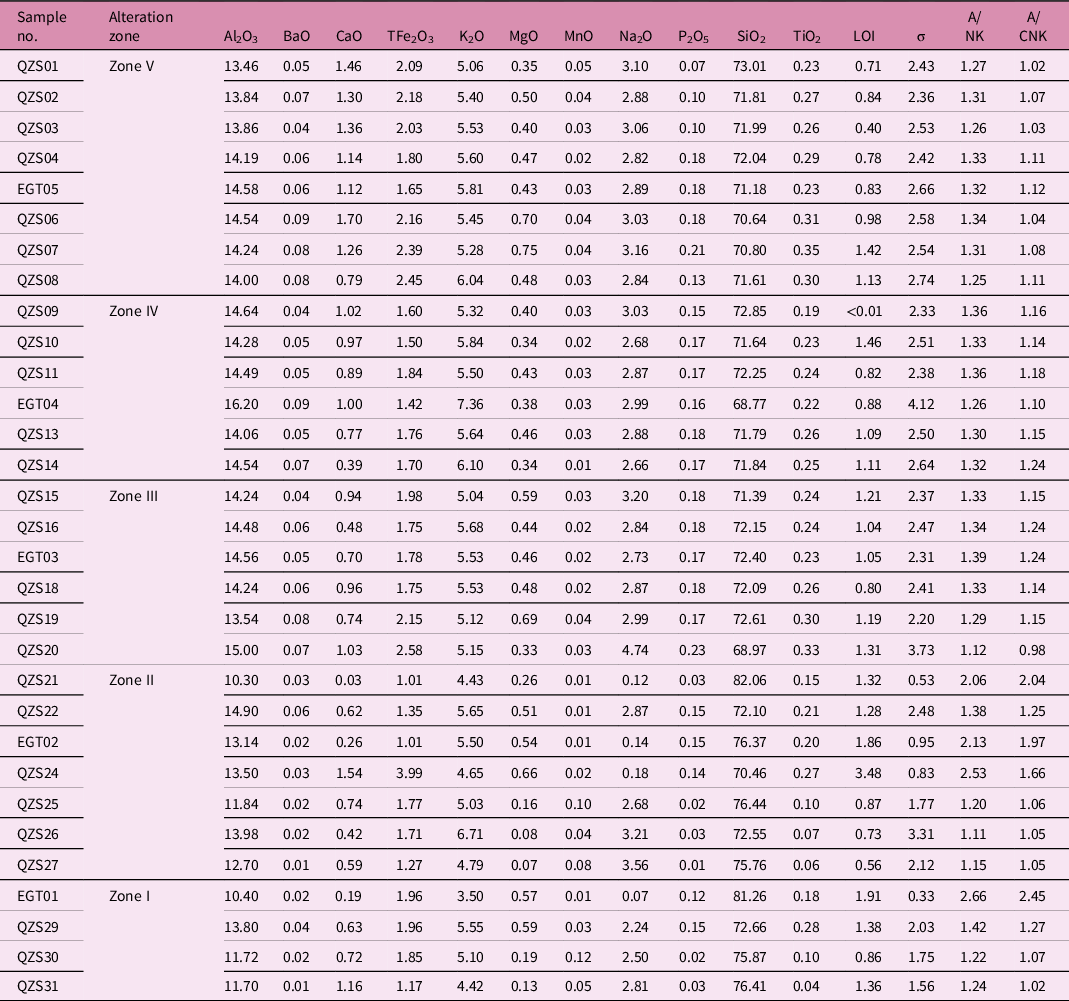
Whole-rock major-element (wt %) geochemical compositions of the fresh and altered granites in the Egongtang deposit

Σ = (Na2O + K2O)^2/(SiO2 − 43) (wt %).
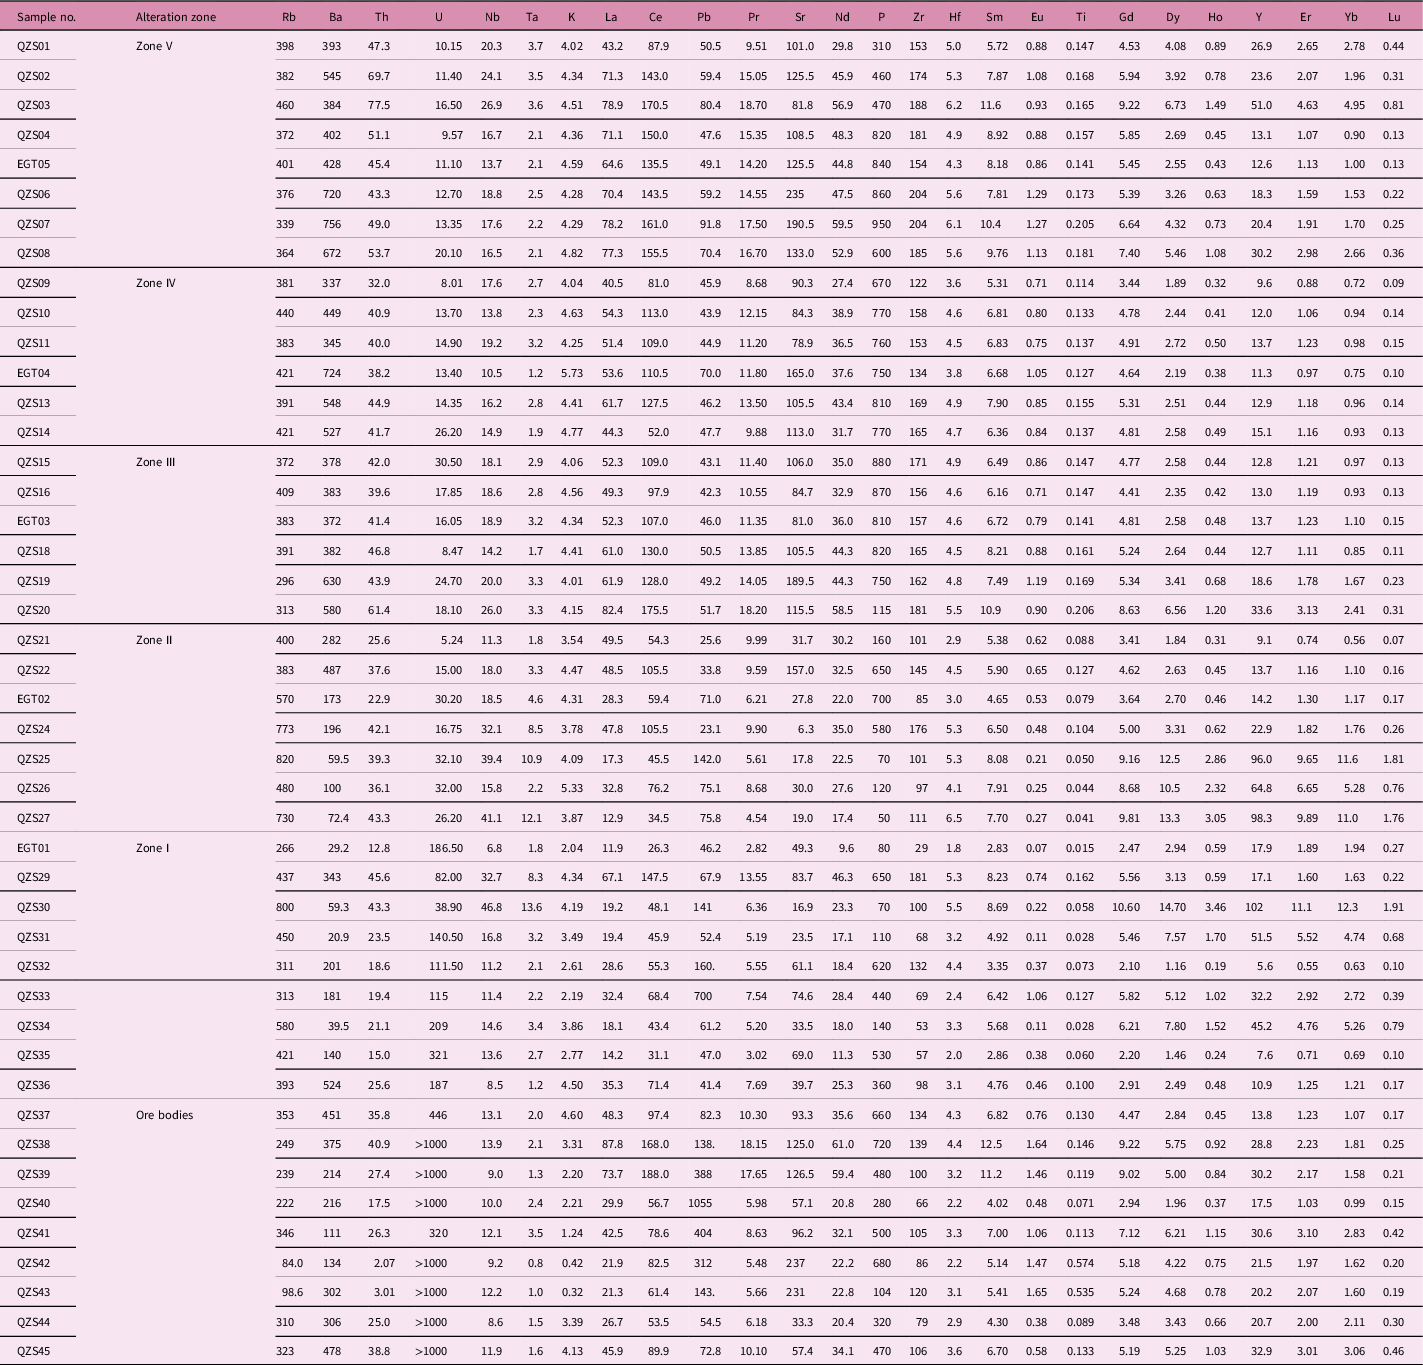
Trace-element contents (ppm) and data processing results of ores, altered and fresh rocks in the Egongtang uranium deposit

Rare earth element content (ppm) and data processing results of ores, altered and fresh rocks in the Egongtang uranium deposit
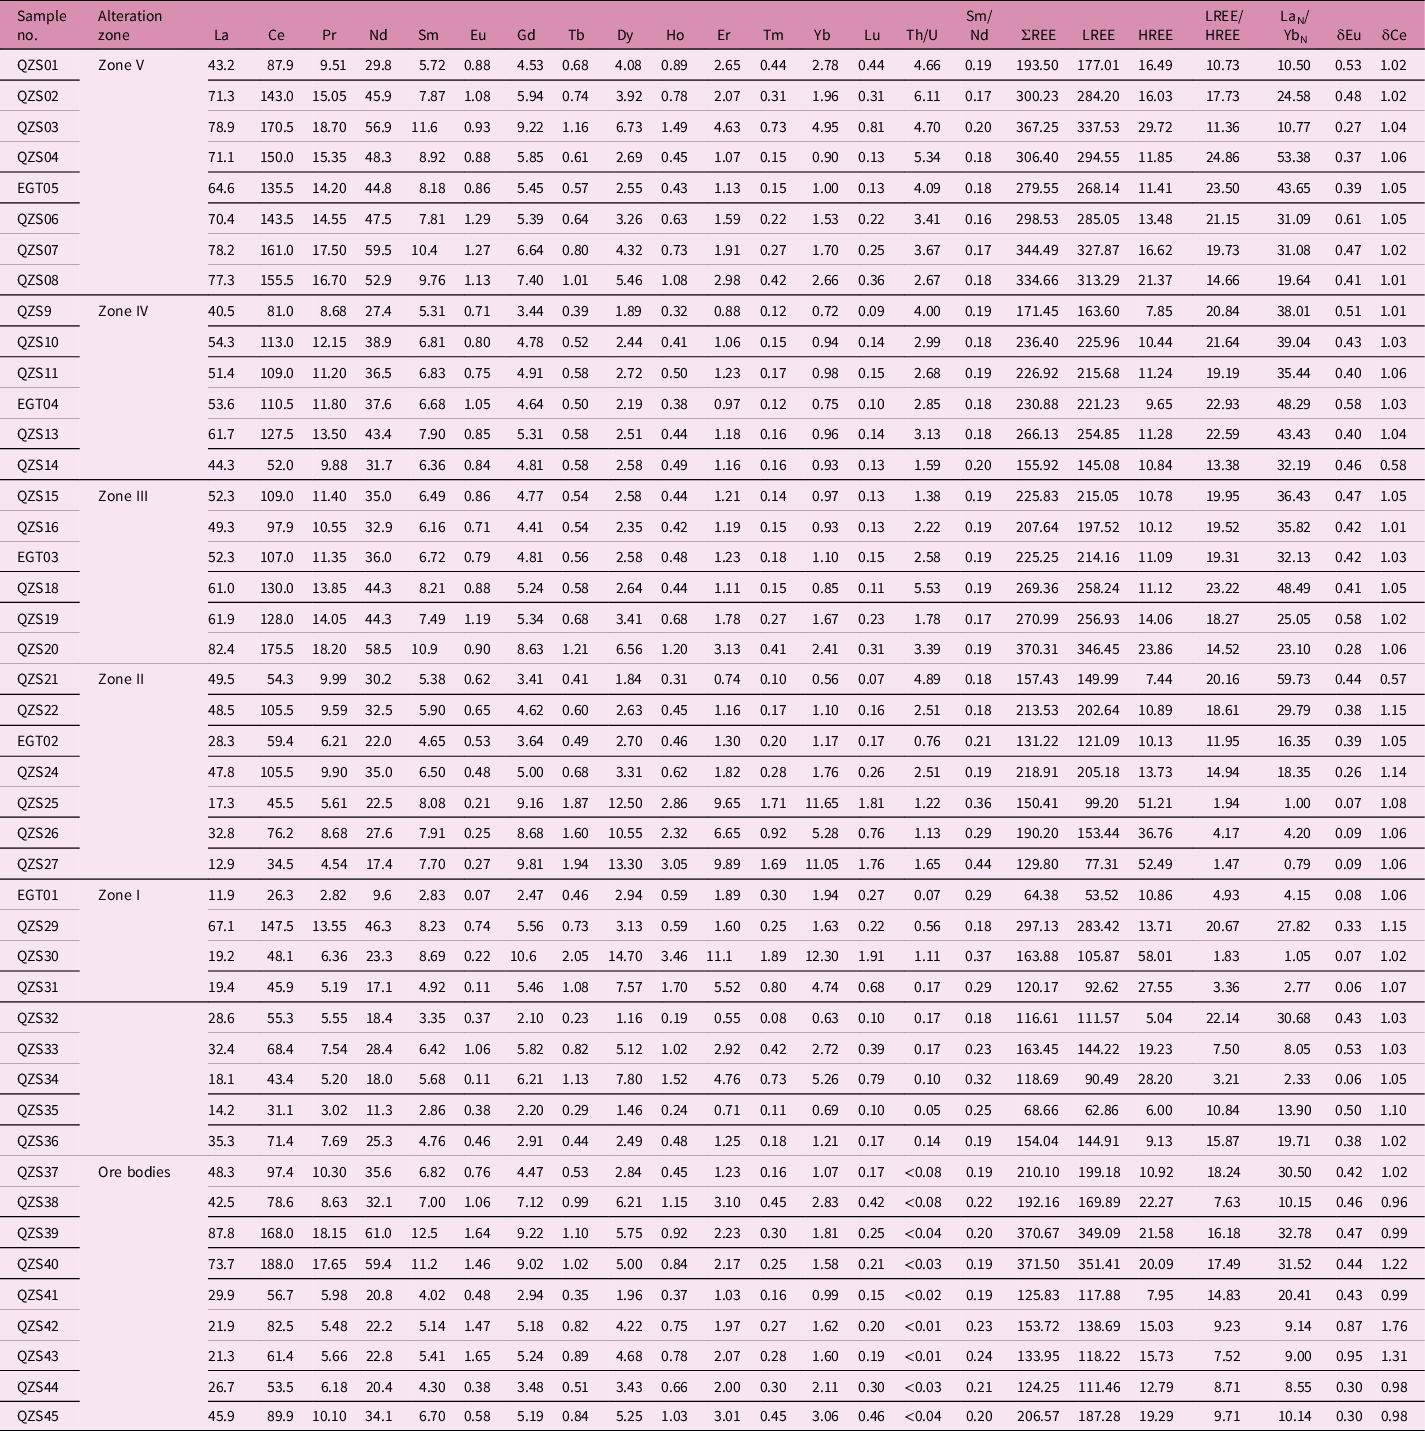
δEu = (EuA/Eum)/((SmA/Smm)*(GdA/Gdm))1/2; A – sample number; m – chondrite.
4. Microscopic characteristics of the rocks
Rock and ore samples from the Egongtang uranium deposit were prepared for analysis, thin-sections and polished bulk specimens. Detailed rock and ore identifications were carried out. The hand specimen and microscopic characteristics of the samples are as follows.
Zone I: The central mineralized zone, which is characterized by haematitized cataclastic granite and uranium ore (representative sample EGT-1). The rocks are light fleshy reddish in colour, with a medium-to-coarse-grained inequigranular texture and massive texture (Fig. 5b). Microscopically, it shows a porphyritic texture, and the phenocrysts are mainly composed of K-feldspar, plagioclase and quartz. The matrix is fine grained, and its composition is consistent with that of the phenocrysts, followed by a small amount of biotite. The accessory minerals are opaque metallic minerals (such as pyrite, haematite), apatite and zircon. The rock is strongly haematitized (Fig. 6a–c), the ore minerals mainly include uranite and fine-grained uraninite (Fig. 6a–c), and the gangue minerals are composed of feldspar, quartz, mica and fluorite. Illitization, carbonation, sericization and chloritization can be seen locally. Epidotization can be seen occasionally. A large number of dust-like haematites are adsorbed on the surface of chlorite, sericite, feldspar and other minerals, which are particulate and cloudy (Fig. 6a–c). In the phenocrysts, K-feldspar is mostly microcline, showing a subhedral and anhedral tabular shape, with strong illitization and slight sericitization. Lattice bicrystal and stripe structures can be seen. K-feldspar intracrystal cracks are commonly developed. Multiple calcite veins of different widths are interspersed along the cracks. Quartz is xenomorphic granular, and intracrystal cracks are common. The plagioclase is subhedral and anhedral tabular, with strong sericitization and illitization. Some of the plagioclase has been completely altered, and only the tabular shape of the plagioclase remains. Uranium minerals are dominated by fine-grained uraninite, often associated with irregular granular pyrite and distributed around quartz phenocrysts (Fig. 6a–c).
Zone II: The close-to-ore alteration zone, which is characterized by altered granite with strong sericization/illitization and weak haematitization (representative sample EGT-3). The rocks are greyish to light green, medium-coarse to medium grained, and porphyritic to massive in texture (Fig. 5d). Phenocrysts are composed of plagioclase and K-feldspar. The matrix is composed of plagioclase, K-feldspar, quartz and muscovite. The matrix has a fine-grained texture. The phenocrystalline plagioclase is subhedral to euhedral tabular with a particle size of 1.60 to 4.00 mm. Most of the plagioclase has undergone strong sericization/illitization and weak haematitization, and the tabular shape of the plagioclases is retained. K-feldspar is subhedral tabular with a diameter of 1.61∼5.50 mm, perthitic with Carlsbad twinning. In the perthite, there are some quartz and plagioclase grains, forming a poikilitic texture (Figs 5d, 6d–f). The matrix plagioclase is subhedral to anhedral tabular with strong sericitization, and the grain size is 0.20∼1.24 mm. The K-feldspar is subhedral tabular with a particle size of 0.31∼1.34 mm. Carlsbad twinning developed with a small amount of cross-hatched twinning. The quartz is granular in shape, 0.20∼1.30 mm, with cracks developed in the crystal and undulating extinction. Muscovite is subhedral–euhedral flakes with a bright interference colour. The content of K-feldspar for the whole rock is ∼35 %; plagioclase is ∼35 %; quartz is ∼25 %; and muscovite is ∼5 %. The main altered mineral assemblage is chloritization → sericization/illitization → weak haematitization.
Zone III: The near-ore alteration zone consists of chloritized granite (representative sample EGT-4). The rock is greyish-pale green, with a medium to coarse heterogranular texture and massive structure (Fig. 5e). The phenocrysts are mainly composed of K-feldspar, plagioclase and quartz (Fig. 6g–i). The matrix has a fine-grained texture and mainly consists of quartz, feldspar and biotite. The whole rock developed strong sericitization, chloritization and illitization (Fig. 6g–i). Phenocrystic K-feldspar is a subhedral to euhedral thin plate, and is mostly perthite. The grain size is 1.24 to 3.4 mm long. Carlsbad twin crystals and a perthitic texture are developed. Quartz grains are commonly found in the K-feldspars, which constitute the inclusion structure. The plagioclase is subhedral to euhedral tabular, and the grain size is 1.00∼1.73 mm. A zonal texture and polysynthetic twin crystals are developed. The whole plagioclase developed sericitization and chloritization. The matrix plagioclase is subhedral to anhedral tabular, with a length of 0.20–0.76 mm. Strong sericitization, clayization and polysynthetic twin crystals were developed. The matrix K-feldspar is tabular with strong clayization and a perthitic texture. The particle size is 0.14∼0.85 mm. Muscovite is subhedral–anhedral schistic with a particle size ranging from 0.32 to 0.71 mm. Biotite is in the form of scales with strong light-brown to dark-brown pleochroism. Strong chloritization developed. The quartz is granular in shape, with a particle size of 0.28–0.94 mm. Part of the surface is broken with undulating extinction. The matrix has a fine-grained and myrmekitic texture. The main alteration assemblage is clayization–chloritization–sericitization–pyritization.
Zone IV: The far-from-ore alteration zone consists of alkaline alteration granites (representative sample EGT-5). The rock is fleshy red, and potassic alteration is obvious. Overall, the content of K-feldspar increases while the content of plagioclase and quartz decreases, and the gradual change was especially obvious in the hand samples (Fig. 5f). The rock has a porphyritic texture and massive structure. The phenocrysts are mainly composed of K-feldspar and a few quartz crystals. The matrix is composed of plagioclase, K-feldspar and fine-grained quartz. Accessory minerals consist of opaque metallic minerals, mostly haematite. The rocks are strongly potassic-altered and partly sericitized. K-feldspar is mostly perthite, which is replaced by metasomatic subhedral tabular and reticular plagioclase (albite) in the crystal, forming perthite with K-feldspar as the main mineral (Fig. 6j–l). K-feldspar locally develops Carlsbad twin crystals and a perthitic texture. In addition, a few K-feldspar grains are filled with late carbonate veins. Plagioclase (mainly albite) is interspersed with K-feldspar crystals in tabular and irregular forms, with slight sericitization at the edges. Quartz has a xenomorphic granular shape. Under the influence of clayification, the quartz crystal surface is adsorbed with muddy components and is slightly dirty. The backscattered electron imaging shows that laminate albite is exposed in a subhedral plate-shaped K-feldspar crystal, and the crystal surface is clean. Voids are often formed inside and at the edges of albite crystals, in which a small amount of fine-scale sericite, flocculent and dusty haematite are distributed. The main alteration assemblage is alkaline alteration–sericitization–carbonatation.
Zone V: The fresh granite zone consists of medium-coarse-grained porphyritic biotite granite (representative sample EGT-6). The rock is grey to light fleshy red, with a porphyritic texture and massive structure. The phenocrysts are mainly composed of K-feldspar, plagioclase and quartz. The matrix has a fine-grained texture and is mainly composed of plagioclase, K-feldspar, quartz, biotite and a small amount of muscovite. Accessory minerals include opaque metallic minerals, apatite, zircon and epidote. In addition, K-feldspar and plagioclase are weakly sericitized.
In general, the Zone I sample is light fleshy reddish, which is the haematitized cataclastic granite with high-grade uranium ore. The ore minerals mainly include uranite and fine-grained uraninite, and gangue minerals are composed of feldspar, quartz, mica and fluorite. The Zone II sample is greyish to light green, which is the altered, medium- to coarse-grained and massive granite with strong sericization/illitization and chloritization, weak haematitization and low-grade uranium ore. The Zone III sample is greyish-pale green, and the rock developed strong chloritization, kaolinization and sericitization/illitization. The Zone IV sample is fleshy red, which is strongly potassic-altered and partly kaolinized and sericitized granite. The K-feldspar content increases while the content of plagioclase and quartz decreases. The fresh granite of Zone V is grey to light fleshy red, with a porphyritic texture and massive structure. The phenocrysts are mainly composed of K-feldspar, plagioclase and quartz, which are weakly sericitized and kaolinized.
5. Whole-rock geochemistry analysis
5.a. Major-element characteristics
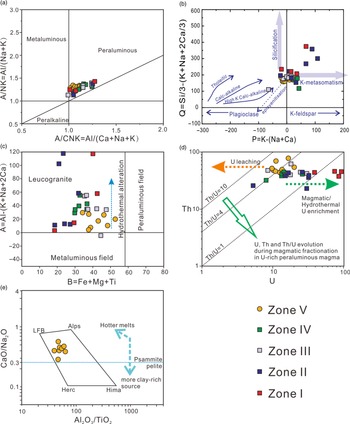
The whole-rock geochemistry of the Qingzhangshan granite is listed in Table 2. The average content of SiO2 of the fresh Qingzhangshan granite is 71.64 %. The average value of Na2O + K2O is 8.49 %. The average value of Na2O/K2O is 0.54. The average value of the Rittman index (σ) is 2.53. The average content of Al2O3 (14.09 %) is higher than that of CaO + Na2O + K2O (9.76 %). The average value of A/NK is 1.30, and the average value of A/CNK is 1.07. The Qingzhangshan pluton is a high-K calc-potassic, weak peraluminous quartz-rich leucogranite (Fig. 7a–c).
Whole-rock geochemical signatures of the fresh granites and their altered and U-mineralized counterparts in the Egongtang deposit. (a) A/NK versus A/CNK diagram showing the peraluminous characters of the fresh and altered rocks. (b) Q versus P diagram showing the variations in quartz content relative to the variations of proportions of K-feldspar and plagioclase, linked to the different alteration features which affected the granites (alkaline alteration, chloritization, sericization/illitization, haematitization, for example). (c) A versus B diagram showing the variations of the aluminous index (A parameter) relative to a differentiation index (B parameter) displaying an A-type magmatic fractionation trend, and showing the alteration features which affected the granites (alkali metasomatism, chloritization, sericization/illitization, haematitization, for example) (modified from Debon & Le Fort, Reference Debon and Le Fort1988). (d) Th versus U diagram showing U, Th and Th/U evolution during magmatic fraction in peraluminous magma, hydrothermal U enrichment and U leaching (modified from Cuney, Reference Cuney2014). (e) CaO/Na2O versus Al2O3/TiO2 diagram for samples from the Qingzhangshan granites (after Sylvester, Reference Sylvester1998).

Compared with the fresh granite, the Al2O3 content of the altered granite from Zone IV to Zone I is reduced, especially for the granites in Zone II and Zone I, the average Al2O3 contents of which are 12.91 % and 11.91 %, respectively. The contents of CaO and MgO vary greatly in the altered granites, being 0.03–1.54 % and 0.07∼0.66 %, respectively. The average content of P2O5 in the granites of Zone II and Zone I decreases compared with the fresh rock, being 0.08 % and 0.08 %, respectively. The contents of MnO and TiO2 in the fresh and altered granite are very close. The average loss on ignition (LOI) content of the altered granites is 1.25 %, which is higher than that of fresh granite. Compared with the fresh granite, the SiO2 content and U content of the altered granite are significantly increased. The contents of SiO2 and U are the highest in the granites of Zone I. This SiO2-rich feature is consistent with the recognition that the Egongtang deposit is a silicified-zone-type uranium deposit (Table 2).
5.b. Trace-element characteristics
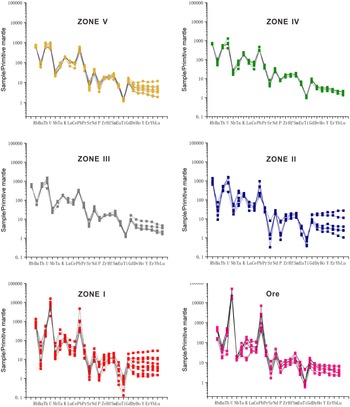
The content and ratios of trace elements can effectively reflect the behaviour characteristics of ore-forming fluids and the relationship between different trace elements and ore-forming elements in the process of mineralization and alteration (Zhao, Reference Zhao1992; Wang, Q. et al. Reference Wang, Deng, Li, Liu, Li and Ripley2018). Both the fresh granite and altered granite show negative anomalies of Ba, Nb, Ta, Sr, P, Ti and Eu and positive anomalies of Rb, Th, U and Pb (Table 3; Fig. 8). The Qingzhangshan fresh granite is rich in U (9.57 ppm to 20.1 ppm, Umean = 13.11) and Th (43.3 ppm to 77.5 ppm, Thmean = 54.63 ppm). The Th/U ratio is 2.67 to 6.11 and the Th/Umean is 4.33 (Fig. 7d). The δEu values of the Qingzhangshan granite range from 0.27 to 0.61 (mean = 0.44). The primitive-mantle normalized distribution curves are similar, indicating that the succession relationship between fresh granite and altered granite is obvious (Fig. 8). The Qingzhangshan fresh granite has relatively low Rb/Sr (mean = 3.17), Rb/Ba (mean = 0.79) and Al2O3/TiO2 (mean = 51.21), and low CaO/Na2O (mean = 0.42), which is consistent with the granite being formed by hotter melts of a clay-poor complex source (Fig. 7e, the model from Sylvester (Reference Sylvester1998); Tables 2, 3).
Primitive-mantle normalized trace-element spider diagrams of the non-altered, altered granites and ore rocks from each alteration zone (composition of the primitive mantle is from McDonough & Sun, Reference McDonough and Sun1995).

Compared with the fresh granite, the changes in trace elements in the altered granites of the different alteration zones are similar (Fig. 8). However, with the enhancement of the degree of alteration from Zone IV to Zone I and the increase in U content, the contents of trace elements such as Ba, K, La, Ce, Pr, Sr, P, Eu, Ti, etc. generally show a gradual decreasing trend, and the contents of trace elements such as Rb, Ta, Pb, etc. generally show a gradual increasing trend. Dy, Ho, Y, Er, Yb and Lu show varying degrees of increase in Zone I and Zone II.
5.c. Rare earth element characteristics
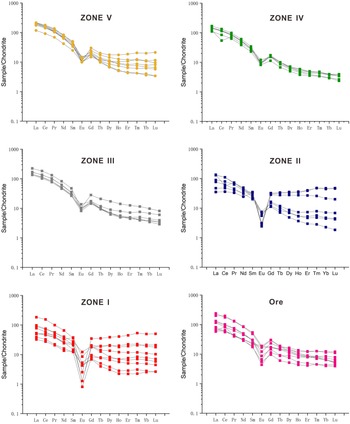
The content and characteristic values of REEs can not only reflect the physical and chemical conditions of diagenesis and mineralization, but also be used as an effective tracer for the properties and sources of ore-forming fluids (Zhao, Reference Zhao1992; Wang, Q. et al. Reference Wang, Deng, Li, Liu, Li and Ripley2018; Wu et al. Reference Wu, Pan, Xia, Huang and Lai2019). The total amount of REEs in the fresh granite is high (average ∑REE is 303.08 ppm), and the fractionation of light REEs (LREE) to heavy REEs (HREE) is obvious (average LREE/HREE is 17.96; average (La/Yb)N is 28.09). There is a significant negative europium anomaly (average is 0.44) and, basically, no cerium anomaly for the fresh granite (average δCe is 1.03). The chondrite-normalized distribution pattern is a LREE-enriched pattern (Table 4; Fig. 9).
Chondrite-normalized REE pattern of the non-altered, altered granites and ore rocks from each alteration zone (chondrite composition is from Taylor & McLennan, Reference Taylor and McLennan1995).

Compared with the fresh granite, the average ∑REE of the altered granites decreased from Zone IV (214.62 ppm) and Zone III (261.56 ppm) to Zone II (170.21 ppm) to Zone I (140.78 ppm), which is mainly the manifestation of a decrease in LREEs and slight increase in HREEs (Table 4). The HREEs are enriched in the strong haematite-altered rocks (Zone I) and sericite/illite-altered (Zone II) granites, and depleted in the other alteration zones. The degree of loss of the LREEs of the altered granites in Zone I and Zone II is obviously greater than the increase in the HREEs, which also leads to a continuous decrease in the fractionation of LREE/HREE from Zone IV to Zone I (LREE/HREE: 17.96 → 10.04; (La/Yb)N: 28.09 → 12.27). δCe was stable (1.03 → 1.06). δEu decreased from 0.44 to 0.27 from the fresh granite to altered granite (Table 4).
6. Discussion
6.a. Element migration
Hydrothermal alteration inevitably leads to material exchange, which is essentially a process of leaching, transportation and precipitation of elements between hydrothermal fluids and rocks under specific physical and chemical conditions (Li et al. Reference Li, Pan, Xia, Zhou, Liu and Zhong2016; Zhang, L. et al. Reference Zhang, Liu, Fayek, Wu, Lei, Cun and Sun2017). When studying the migration of elements in the process of hydrothermal alteration, a direct comparison of content differences of material components between different samples cannot truly reflect the migration of components during the alteration process, because most alteration is in an open system, and there is a ‘closure problem’, and the total mass of rocks before and after the alteration generally changes (Ague & van Haren, Reference Ague and van Haren1996; Deng et al. Reference Deng, Tu, Li and Liu1999; Guo et al. Reference Guo, Ye, Chen, Liu and Zhang2013; Yan et al. Reference Yan, Lennox and Offler2017). In order to eliminate the interference and influence of the ‘closure problem’ on the total mass of the sample in an open system, the mass balance calculation method (standardized isocon diagram method) was used to study the change and migration of each component in the process of mineralization and alternation (Gresens, Reference Gresens1967; Grant, Reference Grant1986; Ague, Reference Ague1994; Guo et al. Reference Guo, Ye, Chen, Liu and Zhang2013). The core idea is to determine the most inert element in the process of hydrothermal alteration and use it as a reference (least-altered equivalent) to explore the migration of other elements. This method is widely used and has achieved good practical results (Gresens, Reference Gresens1967; Grant, Reference Grant1986; Ague, Reference Ague1994; Guo et al. Reference Guo, Ye, Chen, Liu and Zhang2013; Wang, Z. Q. et al. Reference Wang, Fan, Chen, Zheng and Luo2018).
6.a.1. Standardized isocon diagram method
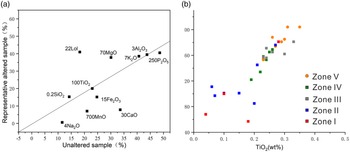
Guo et al. (Reference Guo, Ye, Chen and Liu2009) proposed the ‘standardized isocon diagram method’. The detailed derivation and fitting steps can be seen in Guo et al. (Reference Guo, Ye, Chen and Liu2009), Guo et al. (Reference Guo, Ye, Chen, Liu and Zhang2013) and Li et al. (Reference Li, Pan, Xia, Zhou, Liu and Zhong2016). Li et al. (Reference Li, Pan, Xia, Zhou, Liu and Zhong2016), Liu et al. (Reference Liu, Li, Huang, Li and Nie2017) and Z, Q. Wang et al. (Reference Wang, Fan, Chen, Zheng and Luo2018) have successfully applied the standardized isocon diagram method to the study of mineralization and alteration of granite-type uranium deposits, with good results. The key step in the mass balance calculation is to determine the immobile elements (Grant, Reference Grant1986; Guo et al. Reference Guo, Ye, Chen, Liu and Zhang2013). Immobile elements for the mass change calculation can be determined from binary plots with immobile elements defining a straight line that is offset relative to the least altered when a gain or loss of other elements occurs, and should be parallel to the one-to-one correlation between altered and fresh granites (Fig. 10) (e.g. MacLean & Barrett, Reference MacLean and Barrett1993; Mauk & Simpson, Reference Mauk and Simpson2007; Warren et al. Reference Warren, Simmons and Mauk2007; Zhang et al. Reference Zhang, Gao, Ma and Pan2018). Aluminium, Ti, Zr, Nb, Y and REEs tend to be immobile during hydrothermal alteration (MacLean & Kranidiotis, Reference MacLean and Kranidiotis1987; MacLean, Reference MacLean1988; MacLean & Barrett, Reference MacLean and Barrett1993; Warren et al. Reference Warren, Simmons and Mauk2007). In the alteration samples of the Egongtang deposit, the discrimination diagram of the immobile elements shows that Al2O3, K2O, TiO2 and Na2O are roughly located in a straight line through the origin (Fig. 10a). Considering the different degrees of the haematitization, pyritization and alkaline alteration in each alteration zone of the Egongtang uranium deposit, Al2O3, K2O and Na2O are not suitable as the immobile component in the mass balance calculation. Ti and Zr have a high correlation and are considered as immovable elements. The Zr–TiO2 bivariate diagram shows that the projection point can fit a straight line perfectly through the origin, and the correlation coefficient between TiO2 and Zr is 0.90 (Fig. 10b). This is consistent with the high correlation (0.90–0.99) of fixed element pairs in the mass change calculation proposed by MacLean & Barrett (Reference MacLean and Barrett1993). Experimental and natural evidence has demonstrated that Zr may be mobile, especially in high-temperature environments with strong complexing agents such as fluorine and sulfide (e.g. Keppler, Reference Keppler1993; Rubin et al. Reference Rubin, Henry and Price1993). In the granite, zircon is the most important Zr-mineral. And zircon in the altered rocks of the Egongtang deposit has experienced hydrothermal alteration. However, the newly formed hydrothermal zircon had most probably incorporated the Zr released by magmatic zircon. Therefore, TiO2 was selected as the immobile component in this paper.
(a) Bivariate discriminant diagrams for immobile composition and (b) Zr versus TiO2 diagram of samples from the Egongtang deposit. The number before each component in (a) refers to the coefficient of simultaneous scaling of the contents of each component in the unaltered sample and the representative altered sample.

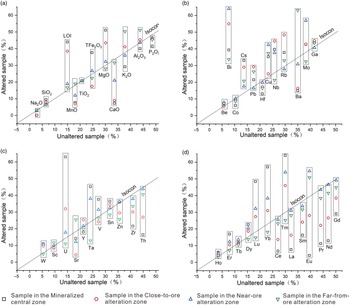
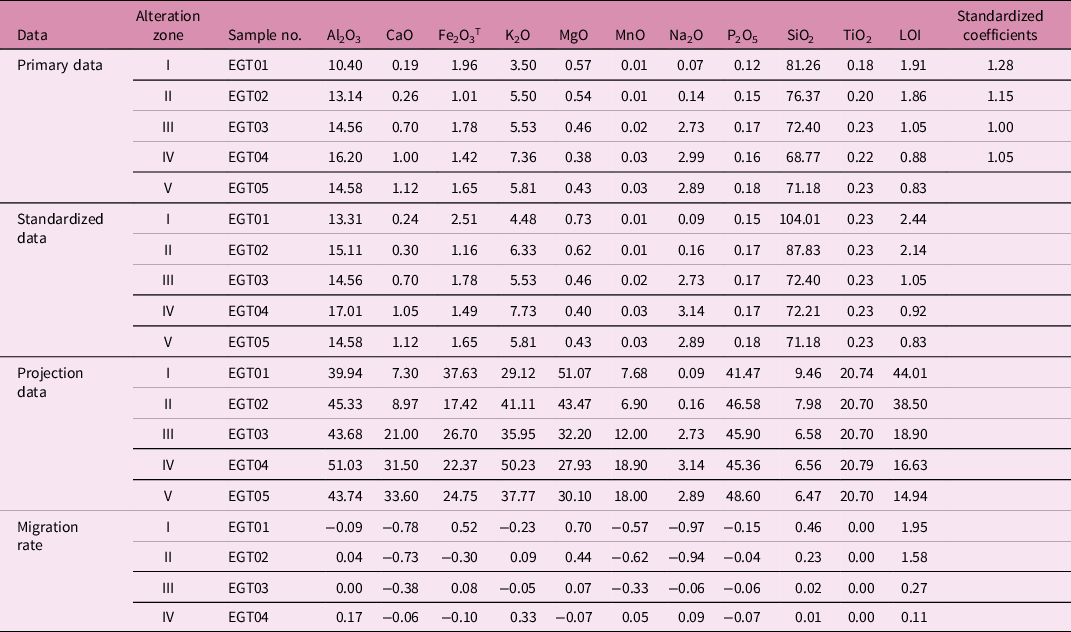
The isocon line, standardized fitting results and migration results of the major, trace and rare earth elements determined with TiO2 as the immobile component are shown in Figure 11. The characteristic parameters of the mass balance calculation and component mobility are shown in Table 5 and online Supplementary Material Tables S1 and S2. In Figure 10a, if the component projection point is exactly located on the isocon line, it means that this component is basically not brought in or migrated out during the alteration process. If the projection point is located above the isocon line, it means the relevant component is brought in during the alteration process. If the projection point is located below the isocon line, it means the component migrates out during the alteration process. The distance between the component projection point and the isocon line reflects the degree to which the component is brought in or moved out (Grant, Reference Grant1986; Guo et al. Reference Guo, Ye, Chen, Liu and Zhang2013).
Major, trace and rare earth element standardized isocon illustrations of the Egongtang uranium deposit.

Major-element contents and data processing results of fresh and altered granites in the Egongtang uranium deposit (wt %)

‘–’ represents elements depleted. Standardized coefficient calculation method: the inactive component (TiO2) of the EGT03/inactive component (TiO2) of other altered samples. The trace-element and rare earth element contents and data processing results of the fresh and altered granites in the Egongtang uranium deposit (ppm) are shown in online Supplementary Material Tables S1–S3.
This study selected representative rock samples EGT-1, EGT-2, EGT-3, EGT-4 and EGT-5 from the five zones in the Egongtang uranium deposit to calculate and study the element migration characteristics during the process of hydrothermal alteration.
6.a.2. Element migration characteristics
The mobility of the major elements in the Egongtang uranium deposit (Table 5) and the isocon diagram (Fig. 11a) show that from the fresh granite → distal alkaline alteration zone → chlorite-rich zone → close-to-ore sericite/illite alteration zone → central mineralization zone, the content of SiO2 and U increases significantly with increasing degrees of alteration. The LOI increased from the margin to the mineralization centre (migration rate: 0.11 → 0.27 → 1.58 → 1.95; Table 5), suggesting that the ore-forming fluid accumulates volatiles and mineralizing agents such as H2O, CO2 and F. In the central mineralization zone (Zone I) and close-to-ore alteration zone (Zone II), Na2O, K2O, CaO, Al2O3, P2O5 and MnO are obviously migrated out, while SiO2, Fe2O3, MgO and LOI are brought in (Fig. 11a). K2O is weakly migrated out in the chlorite-rich zone (Zone III) and is obviously brought in in the distal alkaline alteration zone (Zone IV).
The mobility of trace elements (online Supplementary Material Tables S1, S2) and the isocon diagram (Fig. 11b, c) show that U is located above the isocon line and was brought in during the hydrothermal alteration process. With the progression of alteration degree from the distal alkaline alteration zone to the central mineralization zone, the content of U and its migration rate become higher and higher. Rb and U are generally the same, being brought in during the alteration process. The high-mesothermal metallogenic elements W, Bi, Be, Cs, Pb, Cu and Mo are located above the isocon line and are brought in during the hydrothermal alteration. The HFSEs Zr, Th and Hf are located below the isocon line, and they are migrated out during the hydrothermal alteration. Ba, Sr, Co and Y are migrated out in the central mineralization zone (Zone I), close-to-ore alteration zone (Zone II) and chlorite-rich zone (Zone III) to different degrees. Ga, Sn, Nb and Ta are brought in in zones I, II and III to different degrees, and are moved out in the distal alkaline alteration zone (Zone IV). Zn and V are migrated out in the close-to-ore alteration zone (Zone II) and distal alkaline alteration zone (Zone IV) and are brought in in the central mineralization zone and chlorite-rich zone. REE mobility (online Supplementary Material Table S3) and its standardized isocon diagram (Fig. 11d) show that the LREEs (La, Ce, Pr, Nd, Sm, Eu) are all located below the isocon line and migrate out during the hydrothermal alteration, and the migration rates are very close in each alteration zone. The HREEs (Tb, Dy, Ho, Er, Tm, Yb, Lu) are brought in in most alteration zones. It can be seen from the migration characteristics of the REEs that REEs are closely related to uranium mineralization, and the relationship between HREEs and uranium mineralization is more obvious.
6.a.3. Element migration rules
The hydrothermal alteration is intensive in the Egongtang deposit, as shown in the field (Figs 5, 6), and can be evaluated by elemental geochemical characteristics. In the Q–P diagram (Fig. 7b), the altered samples in the Egongtang deposit display increases in the proportion of quartz and potassium content, indicating that these altered samples underwent silicification and alkaline alteration. The SiO2 in each alteration zone is always brought in, and the closer it is to the central mineralized zone, the higher the corresponding concentration is, which is related to the increasingly intense silicification throughout the whole hydrothermal alteration process, and is consistent with the characteristics of a silicification-zone-type uranium deposit. The Na2O and K2O obviously migrate out from the central mineralization zone (Zone I) and close-to-ore alteration zone (Zone II). In the distal alkaline alteration zone, K2O is brought in, which is related to the clayization, sericitization and illitization of plagioclase and K-feldspar. The migration characteristics of Na2O and K2O in each alteration zone reflect that the strength of alkali metasomatism changes. The alkali metasomatism of the early stage is superimposed by more intense acidic alteration (such as silicification, sericitization and illitization) in the later stage, which results in the destruction of the typical characteristics of alkali metasomatism and makes it difficult to observe in the field, in hand specimens and under the microscope. CaO is obviously brought in in the central mineralization zone (Zone I) and close-to-ore alteration zone (Zone II), which is associated with strong carbonation (Fig. 6c). And from the central mineralization zone (Zone I) to the distal alkaline alteration zone (Zone IV), the migration rate gradually decreases. This can be explained in the following ways: Firstly, Na+ and Ca2+ in granite mainly occur in plagioclase (albite and anorthite). In the process of alkali metasomatism, K-feldspar replaces plagioclase on a large scale, forming perthite, whose primary crystal is K-feldspar and chadacryst is albite. After the metasomatic reaction, most of the excess Ca components entered the fluid and were carried away, and a small amount may be involved in the formation of carbonate veins (Fig. 6c). LOI is brought in in each alteration zone, which is closely related to the water-bearing minerals such as hydromica/illite, chlorite, sericite and carbonate minerals that are rich in volatiles and mineralizers (Figs 5, 6) in each alteration zone. Fe2O3 and MgO are brought in in the central mineralization zone (Zone I), which is manifested as haematite occurring on the surface of feldspar and altered minerals in the form of microparticles (Fig. 6a–c). At the same time, iron-rich minerals such as pyrite, chalcopyrite and biotite are commonly found in the Egongtang uranium deposit, indicating that the migration of Fe2+ may be affected by various occurrences in the process of hydrothermal alteration (Guo, Reference Guo2014; Li et al. Reference Li, Pan, Xia, Zhou, Liu and Zhong2016).
In the process of hydrothermal alteration, the ion exchange between the fluid and minerals and the decomposition of minerals containing trace elements are important mechanisms of the leaching and transportation of trace elements. The ion exchange mechanism mainly depends on the diffusion rate of elements in minerals, while the mineral decomposition mechanism mainly depends on the stability of minerals in fluids (Jiang et al. Reference Jiang, Ling, Jiang, Shen, Fan and Ni2006; Wang, Z. Q. et al. Reference Wang, Fan, Chen, Zheng and Luo2018). Campbell et al. (Reference Campbell, Lesher, Coad, Franklin, Gorton and Thurston1984) proposed that the diffusion rate of elements in minerals was very slow, and compared with the ion exchange mechanism, the mineral decomposition mechanism had a more obvious effect on the activation and migration of trace elements. The ionic radius of Rb and K is similar. Rb often occurs in the form of isomorphism in K-bearing minerals (mica, K-feldspar, etc.). The Rb is obviously brought in in the central zone of mineralization (Zone I). The K-bearing minerals such as K-feldspar and biotite in each alteration zone have undergone sericitization, illitization and chloritization to varying degrees during the hydrothermal alteration, which is caused by the extraction of K from the hydrothermal fluids in the edge zone into the central mineralization zone. The ionic radius of Sr is similar to that of Ca, and it is easy for isomorphic replacement with Ca in plagioclase, calcite, apatite and other minerals to occur. Sr moves out in the central mineralization zone (Zone I) and the close-to-ore alteration zone (Zone II), which is related to the strong sericitization and illitization of the plagioclase and the decomposition of apatites. The geochemical properties of Zr and Hf are very similar, and Zr moves out in each alteration zone, which is mainly related to the decomposition of zircon. Hf often migrates in the form of [HfF6]2− (Fletcher & Merino, Reference Fletcher and Merino2001). Siliceous veins and purple-black fluorite veins are particularly developed in the Egongtang uranium deposit during the main ore-forming period. Besides the cataclastic-altered granite-type uranium ore, there are also siliceous vein-type and purple-black fluorite-vein-type uranium ores in the Egongtang deposit. In the process of mineralization and alteration, the Si-rich and F-rich ore-forming fluid promotes Hf mobility. Hf migrates out from the central mineralization zone in the form of [HfF6]2− with the Si-rich and F-rich ore-forming fluid. Therefore, Hf moves out in each zone. From the distal alkaline alteration zone to the central mineralized zone, the rate that U is brought in increases gradually, and the out-migration rate of Th also increases gradually. Pb is the decay product of U and Th. With the increase in mobility of U and Th from Zone IV to the central mineralized zone, Pb is largely brought in in Zone I and Zone II. Overall, the trace elements are brought in the central mineralization zone (Zone I); even if some of the elements in the alteration zones are moving out, the out-migration rate in the central mineralized zone is the lowest. These characteristics imply that in the process of alteration, the hydrothermal fluid activates, leaches, extracts and migrates the trace elements in the host rock, which promotes the accumulation of metallogenic elements and is beneficial to the mineralization.
The chondrite-normalized REE pattern (Fig. 9) shows that the ‘right-leaning’ type of LREE enrichment gradually changes to a flat profile with a pronounced negative Eu anomaly, indicating that the ore-forming fluid has an influence on the REE distribution pattern in the hydrothermal alteration process, and promotes the activation and migration of LREEs and HREEs, leading to a slight change in the concentrations of LREEs and HREEs. The standardized isocon illustration (Fig. 11d) demonstrates that HREEs are brought in in the central mineralization zone (Zone I) and the close-to-ore alteration zone (Zone II), which could be related to the ability and stability of the HREEs to form complexes (such as [REE (CO3)3]3− and [REEF6]3−) compared with the LREEs (Grandstaff, Reference Grandstaff1976; Romberger, Reference Romberger1984). And the geochemical behaviour of the HREEs is similar to U, which is mainly transported in hydrothermal fluids as uranyl ions (e.g. [UO2F3]−, [UO2F4] [UO2(CO3)3]4−, etc.) (Hu et al. Reference Hu, Bi, Zhou, Peng, Su, Liu and Qi2008; Brugger et al. Reference Brugger, Liu, Etschmann, Mei, Sherman and Testemale2016). The LREEs of each alteration zone of the Egongtang uranium deposit are depleted during the hydrothermal alteration, and the degree of depletion is the largest in the central mineralization zone (Zone I) and the close-to-ore alteration zone (Zone II), and the migration rate is the lowest in the chloritization alteration zone near the ore, which may be related to the adsorption capacity of illite and chlorite for LREEs. B. Wei (unpub. Master’s thesis, Anhui Agricultural Univ., 2011) indicated that the adsorption capacity of illite for LREEs was greater than that of chlorite for LREEs.
6.b. Implications for uranium mineralization
Based on the characteristics of trace elements and REEs, the uranium content of the Qingzhangshan granite (mean 13.11 ppm) is much higher than that of the South China uranium-producing granite (mean 3.0 ppm; Yu, Reference Yu1979; Yu et al. Reference Yu, Wu and Chen2005), and significantly higher than the average uranium content in the crust of eastern China (1.5 ppm; Gao et al. Reference Gao, Luo, Zhang, Zhang, Han, Zhao and Hu1998, Reference Gao, Luo, Zhang, Zhang, Han, Zhao and Kern1999) and global mean uranium content of granites (3.0 ppm; Zhang et al. Reference Zhang, Wang and Liu1988), indicating that the Qingzhangshan granite has the potential to provide a sufficient uranium source for uranium mineralization in the area. The distribution curves of trace and rare earth elements of various samples in the Egongtang uranium deposit are similar, and there is a gradual relationship to some extent between different zones (Figs 8, 9), which also implies that the uranium source of the deposit is mainly from the Qingzhangshan granite.
The uranium mineralization of the Egongtang deposit occurs in the alteration zone accompanied by haematitization, illitization, sericitization, chloritization, pyritization, etc. Uranium deposits are usually formed as a result of reactions between oxidizing fluids with a high uranium content and reducing agents such as pyrite and chlorite, resulting in the conversion of Fe2+ to Fe3+ and the reduction of U6+ to U4+ (Cuney, Reference Cuney2009). Uranium often migrates in the form of hexavalent U (U6+) under oxidizing conditions and precipitates in the form of U4+ under reducing conditions, forming uranium minerals such as uraninite, coffinite and uranythoriite (Romberger, Reference Romberger1984; Hu et al. Reference Hu, Bi, Zhou, Peng, Su, Liu and Qi2008; Cuney, Reference Cuney2014). From the migration characteristics of elements, it can be seen that Fe2O3 is in a state of being brought in in the mineralized central zone. From the central mineralized zone to the distal alteration zone, the concentrations of Fe2O3 are significantly reduced or even moved out, suggesting that the mineralization environment is transformed from an oxidizing environment with relatively high oxygen fugacity to a reducing environment. The bringing-in rate of LOI in the central mineralized zone is lower than that in the close-to-ore alteration zone, suggesting that CO2, F, H2O and other volatile compounds and mineralizing agents in the ore-forming fluids escaped to a certain extent. Romberger (Reference Romberger1984), Hu et al. (Reference Hu, Bi, Zhou, Peng, Su, Liu and Qi2008) and Cuney (Reference Cuney2014) suggested that the escape of CO2 will lead to the instability and depolymerization of U6+ iso-uranyl complex ions, and the escape of volatiles and mineralizers will also take away a lot of heat from the ore-forming hydrothermal system, resulting in the decrease of the temperature of the ore-forming hydrothermal system and the decrease of the solubility of the U6+-containing uranyl complex ions. With the metallogenic environment converted from oxidation to reduction, the Fe2+ in pyrite and chlorite is oxidized to Fe3+ to form haematite, forming the red central mineralized alteration zone.
7. Conclusions
The Egongtang deposit in South China belongs to a granite-hydrothermal vein-type deposit. The Qingzhangshan granite was the main uranium source for the Egongtang deposit. At least seven hydrothermal alteration assemblages have been found in the Egongtang deposit, including potash feldspathization, sericization/illitization, chloritization, haematitization, pyritization, silicification and carbonation. According to the field characteristics, the alteration samples of the deposit can be divided into a fresh granite zone (Zone V), distal alkaline alteration zone (Zone IV), chlorite-rich zone (Zone III), close-to-ore sericite/illite alteration zone (Zone II) and central mineralization zone with strong haematitization (Zone I). From the distal alkaline alteration zone to central mineralized zone, with the enhancement of the degree of alteration, the contents of SiO2 and U increase significantly. The content of SiO2 is the highest in the central mineralized zone with strong haematitization and sericization/illitization. The concentrations of SiO2, MgO and Fe2O3 are positively proportional to the concentrations of U. The content of trace elements (such as Ba, K, La, Ce, Pr, Sr, P, Eu, etc.) gradually decreased from Zone V to Zone I, suggesting that ore-forming fluids carried a variety of trace elements during migration. The REEs in the process of the hydrothermal alteration mainly manifest in a decrease in LREEs and slight increase in HREEs from Zone V to Zone I. It is concluded that the ore-forming elements of the Egongtang deposit were mainly derived from the Qingzhangshan granite, and the early alkaline alteration transferred large amounts of U into the hydrothermal system. In the ore-forming stage, ores precipitated accompanied by acid metasomatism such as chloritization, haematitization and carbonation.
Supplementary material
To view supplementary material for this article, please visit https://doi.org/10.1017/S0016756822001224
Acknowledgements
We acknowledge the support from National Natural Science Foundation [41902075, 42262017, 41962007, 42002091, 42002095, 42172098] of China, Jiangxi Provincial Natural Science Foundation [20212BAB213009], Science and Technology Research Foundation of the Department of Education, Jiangxi Province [GJJ200767] and the China Uranium Industry Co. LTD. – East China University of Technology Innovation Partnership Foundation [NRE2021-01, NRE2021-09].