Introduction
Towards the end of late gestation, dairy cows require approximately 20–32 g/d of Ca to support maintenance, foetal growth, endogenous loss and colostrogenesis (Horst et al., Reference Horst, Goff and Reinhardt2005). Foetus and mammary gland are the primary sites of Ca retention, with total retention values of 398 g and 6.97 g, respectively, between days 140 and 270 of gestation (Camisa Nova et al., Reference Camisa Nova, Marcondes, Valadares Filho, Campos, Machado, Silva, Castro and Rotta2025). At the onset of lactation, high-producing cows require 30 to 50 g/d of Ca for milk synthesis (Horst et al., Reference Horst, Goff and Reinhardt2005). Transition cows experience a decrease in DMI during the last 3 wk before parturition, resulting in nutrient that falls short of meeting the demands for milk yield during the early lactation (Drackley, Reference Drackley1999). In addition to negative energy balance, transition cows experience an imbalance between the sudden increase in Ca demand and the delayed metabolic response to mobilise Ca from body tissues leading to negative Ca balance (Wilkens et al., Reference Wilkens, Nelson, Hernandez and McArt2020).
Anionic salts have been fed to dairy cows during the last month of gestation to regulate Ca metabolism throughout the periparturient period (Santos et al., Reference Santos, Lean, Golder and Block2019). Anionic salts supply alters the dietary cation-anion difference (DCAD = ([Na + K] – [S + Cl]) (Santos et al., Reference Santos, Lean, Golder and Block2019). Feeding more anions than cations results in a negative DCAD and induces a state of a compensated metabolic acidosis (Wilkens et al., Reference Wilkens, Nelson, Hernandez and McArt2020). Cows fed a negative DCAD (i.e., −50 to −200 mEq/kg of DM) develop partially compensated metabolic acidosis, characterised by a reduction in urine pH and a slight decrease in blood pH (Santos et al., Reference Santos, Lean, Golder and Block2019). The reduction in blood pH is positively associated with increased tissue responsiveness to parathyroid hormone, which can indirectly enhance intestinal Ca absorption by stimulating the production of 1,25-hydroxyvitamin D3 in kidney (Zhu and Deluca, Reference Zhu and Deluca2012) and can directly induce the mobilisation of Ca from bones (Goff et al., Reference Goff, Liesegang and Horst2014).
The compensated metabolic acidosis is accompanied by reduced urinary excretion of Na and K, as well as a decrease in urinary pH as part of compensatory mechanisms (Melendez et al., Reference Melendez, Bartolome, Roeschmann, Soto, Arevalo, Möller and Coarsey2021). As a result, the strong negative relationship between urinary pH and net acid excretion in cows fed anionic diets (Vagnoni and Oetzel, 1998) supports the use of urinary pH as a practical tool to monitor the degree of metabolic acidification. Feeding an acidogenic diet that leads to a urine pH between 6.0 and 7.0 is suitable for reducing the risk of clinical hypocalcaemia and the severity of subclinical hypocalcaemia (Melendez and Chelikani, Reference Melendez and Chelikani2022). Despite positive effects in preventing hypocalcaemia, studies have reported decreased DMI during the pre-partum period when feeding negative DCAD rations (Lopera et al., Reference Lopera, Zimpel, Vieira-Neto, Lopes, Ortiz, Poindexter, Faria, Gambarini, Block, Nelson and Santos2018; Martinez et al., Reference Martinez, Rodney, Block, Hernandez, Nelson, Lean and Santos2018; Santos et al., Reference Santos, Lean, Golder and Block2019). This decrease was attributed to a response to the metabolic acidosis induced by the strong anions present in the diet (Zimpel et al., Reference Zimpel, Poindexter, Vieira-Neto, Block, Nelson, Staples, Thatcher and Santos2018). Feeding different sources of anions in diets with similar DCAD values resulted in varying urine pH levels suggesting differences in the degree of metabolic acidosis (Goff et al., Reference Goff, Ruiz and Horst2004). These authors reported that chloride had approximately 1.6 times greater acidifying activity than sulphate. In addition, calcium and magnesium – although not accounted for in the traditional DCAD equation – exerted a small but significant alkalinising effect when accompanying chloride or sulphate (Goff et al., Reference Goff, Ruiz and Horst2004). Because anionic salts differ in their concentrations of chlorides and sulphates, as well as in Ca and Mg content, the degree of compensated metabolic acidosis, and consequently the Ca metabolism in cows, can be affected differently.
Refinements in the formulation of negative DCAD rations have included efforts to minimise the potential negative effect of anionic salt source on DMI. MegAnion (MEG; Barentz Animal Nutrition, Hoofddorp, The Netherlands) is a novel generation of anion supplements produced as an extruded organic complex. It contains relatively high concentrations of CP (81.5 % DM) and chloride (23.7 % DM) compared to other commercially available anionic supplements, thereby reducing the amount required to achieve a targeted DCAD value. Feeding MEG to achieve DCAD values of −100 or −180 mEq/kg during the pre-partum period has been shown to increase blood ionised Ca concentrations at 2 and 14 d after calving, but no major differences were detected in the performance of cows (Hassanien et al., Reference Hassanien, Galyean, Ballou, Mahmoud, Abdel-Raouf and Eweedah2022).
To date, only one study (Caixeta et al., Reference Caixeta, Weber, Johnson, Faser, Visser and Crooker2020) has directly compared MEG with another commercial DCAD product (Soychlor, Landus Cooperative). The authors observed no differences in serum Ca concentrations, urine pH or DMI during the prepartum and postpartum periods, indicating that MEG may serve as viable alternative to conventional DCAD supplements. The objective of this study was to investigate the effects of anionic salt products with different proportions and sources of chlorides and sulphates on DMI, apparent total tract digestibility of nutrients, blood metabolites, milk yield and composition in dairy cows during the transition period and early lactation. We hypothesised that feeding MEG (23.7 % Cl and 3.08 % S) during the prepartum period would result in higher blood concentrations of Ca throughout the transition period until 42 d of lactation and lower urine pH during the prepartum period compared to cows fed Animate (13.3 % Cl and 4.90 % S; Phibro Animal Health, Teaneck, NJ, US). However, we expected that both anionic supplements would effectively support calcium homeostasis and would maintain milk yield during the first 42 d of lactation.
Materials and methods
Animals, experimental design and management
Twenty-four Holstein animals (614 ± 21.3 kg BW, 2.0 ± 0.9 parity number, 10 nulliparous and 14 multiparous) were blocked (n = 12) by parity and expected calving date. Animals were enrolled sequentially in the study between April and August 2022. Animals within block were randomly assigned to the following treatments: Animate (ANI), anionic salts (Animate, Phibro Animal Health) fed at 2.85 % diet DM; or MegAnion (MEG), anionic salts (MegAnion, Barentz Animal Nutrition) fed at 1.85 % diet DM. Both treatments targeted a DCAD of -150 mEq/kg of diet DM and were mixed into the concentrate, beginning 30 d before the expected calving date and continuing until parturition. The targeted DCAD was determined based on dose shown to maintain blood total Ca concentrations above 8.5 mg/dL during the transition period and prepartum urine pH below 7, as described by Hassanien et al. (Reference Hassanien, Galyean, Ballou, Mahmoud, Abdel-Raouf and Eweedah2022) when feeding MEG during the pre-partum period. The guaranteed analysis for Animate (%DM) includes 32.0 % CP, 4.90 % S, 1.25 % Ca, 4.5 % Mg, 13.3 % Cl and -6,500 mEq/kg DCAD. Animate contains ingredients such MgSO4, CaSO4, ground corn and sugarcane molasses, but full ingredient composition is proprietary. MegAnion has a guaranteed analysis (% DM basis) of 81.5 % CP, 23.7 % Cl, 2.50 % Mg, 3.08 % S, 0.26 % Ca and -8,275 mEq/kg DCAD. It is composed of plant protein products (soybean meal), NH4Cl, MgSO4 and hydrochloric acid, with the full ingredient composition being proprietary.
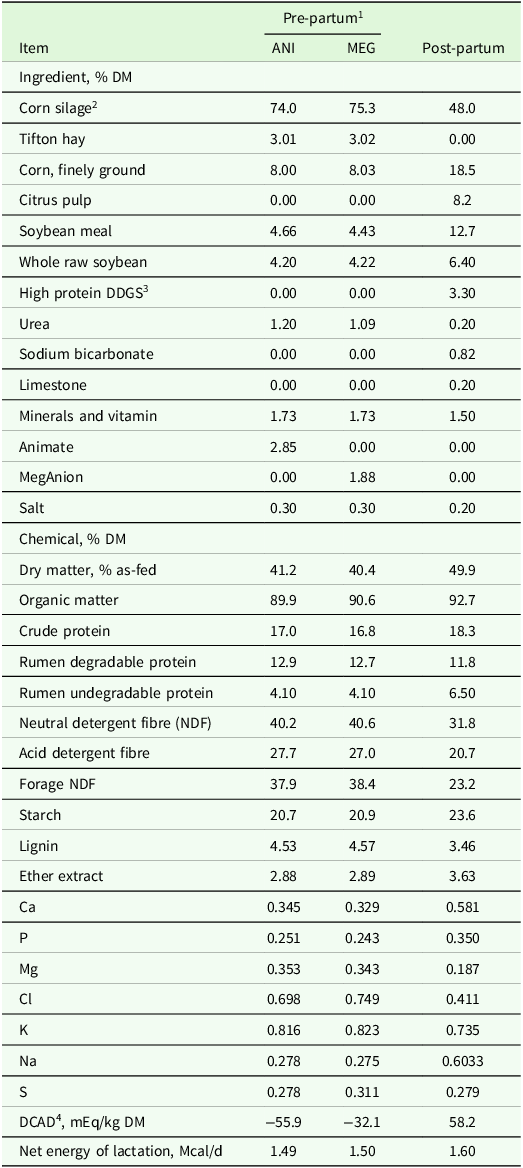
Cows were housed in an open-sided barn with individual pens, with sand beds, fans, feed bunks and free access to water. Cows were housed individually for most of the day (22 hours) in pens measuring 17 m2, each equipped with a feed bunk and a water trough. For the remaining 2 hours (1 hour in the morning and 1 hour in the afternoon/evening), cows were moved to larger (100 m2), parity-specific pens that provided free access to water and shade, allowing them to exercise. Diets (Table 1) were formulated according to NRC (2001). Cows were fed the TMR twice daily (0700 h and 1300 h) targeting refusals between 5–10 % (as-fed). Urine pH was measured twice a week, 4 h after the morning feeding, using a glass electrode pH metre (MB-10, Marte Científica, São Paulo, Brazil). Cows were weighed using a digital scale for large animals (AW100, DeLaval, Tumba, Sweden) weekly (2 consecutive d) before the morning feeding (dry cows) and after milking. and BCS was recorded by two trained personnel according to Edmonson et al. (Reference Edmonson, Lean, Weaver, Farver and Webster1989).
Ingredients and chemical composition of experimental diets

1 Animate (ANI), anionic salts (Animate, Phibro Animal Health) containing (% DM) 32.0 % crude protein, 4.90 % S, 1.25 % Ca, 4.5 % Mg, 13.3 % Cl, and -6,500 mEq/kg DCAD. MegAnion (MEG), anionic salts (Meganion, Barentz Animal Nutrition) containing (% DM) 81.5 % crude protein, 0.26 % Ca, 0.49 %P, 2.5 % Mg, 1.6 % K, 0.07% Na, 23.7 % Cl, 3.1 % S, and -8,270 mEq/kg DM DCAD.
2 Chemical composition (% DM, mean±SD): 34.3 ± 1.80 % DM (% as-fed), 95.8 ± 0.18 % organic matter, 12.2 ± 0.26 % crude protein, 48.2 ± 0.39 % neutral detergent fibre, 18.2 ± 0.66 % indigestible neutral detergent fibre, 19.6 ± 4.29 % starch, 0.15 ± 0.014 % Ca, 0.14 ± 0.025 % P, 0.14 ± 0.077 % Mg, 0.32 ± 0.014 % Cl, 0.90 ± 0.24 % K, 0.12 ± 0.010 % Na, and 0.12 ± 0.017 % S.
3 Disteller’s dried grains with solubles.
4 Dietary cation anion difference.
Nutrient intake and apparent total tract digestibility
The feed offered and refusals of each cow were weighed daily. Concentrate ingredients were sampled at the feed mill, corn silage samples were collected daily during the removal from the silos and pooled by week, and refusals of each cow were collected daily and pooled by week.
Samples were maintained frozen (-20 ºC) until chemical analyses. Samples were dried in oven with forced ventilation (55 ºC for 72 h) and ground in knives rotationary mill to theoretical particle size of 2 and 1 mm. Samples were assessed for contents of DM, N and ash according to AOAC International (2000). The starch content in the feed was measured using an enzymatic degradation method (Amyloglucosidase; Novozymes Latin America Ltda.), as described by Hendrix (Reference Hendrix1993). Feed ingredients were also analysed for contents of insoluble nitrogen in NDF, insoluble nitrogen in acid detergent fibre (ADF) and lignin (AOAC International, 2000). CP was calculated by multiplying N content by 6.25. NDF and ADF were determined in feed ingredient samples by adding alpha-amylase and no sodium sulphite to the detergent (Van Soest et al., Reference Van Soest, Robertson and Lewis1991). Feed ingredients were submitted to minerals analyses using inductively coupled plasma optical emission spectrometry method (ICPE-900, Shimadzu, Tokyo, Japan) (AOAC International, 2000). The external calibration curves were prepared from 0.5 to 100 mg/L using standard multi-element solutions (SpecSol, Quimilab, São Paulo, Brazil) with Ca, S, P, Mg, K, Na at 100 mg/L. Chloride concentration in feeds was individually analysed also by inductively coupled plasma optical emission spectrometry method (ICAP-6300, Thermo Scientific, Waltham, MA, US) (AOAC International, 2000). Corn silage was sampled and analysed for macrominerals to adjust treatments DCAD prior to the experiment started. After mineral analyses of the feed ingredients and anionic supplements, the observed DCAD values were higher than initially expected, with calculated DCADs of −55.9 and −32.1 mEq/kg of DM for the ANI and MEG treatments, respectively. Faecal samples (∼500 g) were collected for 2 consecutive days (0600 h and 1500 h on the first day, and 0900 h and 1800 on the second day; Cavallini et al., Reference Cavallini, Palmonari, Mammi, Ghiaccio, Canestrari and Fomigoni2023) on weeks −3, −1, 1, 3 and 5 relative to the calving date. Faecal samples were frozen immediately after each collection. At the end of each collection period, samples were thawed, and 400 g from each time point was homogenised to create a pooled sample for each cow and week. These pooled samples were then analysed for chemical composition. Daily faecal excretion was determined based on indigestible NDF (iNDF) intake and its concentration in faeces (Zanferari et al., Reference Zanferari, Vendramini, Consentini, Rentas, Gardinal, Calomeni, Rennó, Takiya, Nunes and Rennó2025).
Blood metabolites and milk yield
Blood samples were collected in vacutainer serum or EDTA tubes (10 mL; Becton, Dickinson and Company, Franklin Lakes, New Jersey) 4 h after the morning feeding (weeks -4, -3, -2, at calving date and weeks 1, 2, 3, 4, 5 and 6) by puncture of coccygeal vessels. After clotting, samples were centrifuged (2,000 × g for 15 min at room temperature), then serum was harvested and assessed for concentrations of glucose (catalog# K082-3), urea (catalog# K056-1), total Ca (catalog# K051-2) and Mg (catalog# K116-2) using commercial kits (Bioclin, Belo Horizonte, Brazil) and absorbances were measured on a spectrophotometer (SBA 200, Celm, São Caetano do Sul, Brazil). Ionised calcium was calculated based on serum concentrations of albumin (K040-1, Bioclin) and total protein (K031, Bioclin) as follows (Mateu-de Antonio, Reference Mateu-de Antonio2015): CaI (mg/dL) = {6 × Ca – [(0.19 × P) + A]/3}/ (0.19 × P) + A + 6, where Ca = calcium serum (mg/dL), P = total proteins (g/dL) and A = albumin (g/dL). Serum samples were assessed for concentrations of NEFA and beta-hydroxybutyrate (BHB) using commercial kits (Randox) and absorbances were measured on a microplate reader (Biochrom Asys UVM 340, Biochrom, Waterbeach, United Kingdom). Insulin concentration was measured on IMMULITE 1000 chemiluminescent device (Siemens Healthcare Diagnostics Ltd., Llanberis, UK) (Go et al., Reference Go, Hazard, Balasuriya, Chapman, Fitton, Kenéz and Andrews2023).
Cows were milked twice a day at 0600 and 1700 h. Milk samples were collected every week for 3 consecutive days in every milking shift to assess concentrations of protein, fat and lactose through ultrasonic method (Lactoscan, Entelbra, Londrinha, Brazil). Milk samples were pooled by day in proportion to the milk production of each milking session prior to analysis of milk composition. Fat-corrected milk (3.5 % FCM) was calculated according to Sklan et al. (Reference Sklan, Ashkenazi, Braun, Devorin and Tabori1992). The milk yield and composition data were averaged per week before statistical analyses. Milk urea nitrogen was analysed using commercial kits (K056, Bioclin).
Statistical analysis
Pre- and post-partum data were analysed separately and submitted to analysis of variance using the MIXED procedure of SAS (version 9.4). Data were analysed as repeated measures and the statistical model included the fixed effects of treatment, time (week), parity (nulliparous and multiparous) and their interaction and the random effect of block. Time was included in repeated option and cow was set as the subject. Before conducting the analysis of variance, the normality of residuals was evaluated using the UNIVARIATE procedure of SAS, and no variables required transformation. Several covariance matrices were tested to ensure the best fit analysis which was chosen based on the lowest BIC (Bayesian information criteria value). Parameters collected from a single time point (i.e., days in prepartum) were also submitted to analysis of variance using the MIXED procedure of SAS, but the statistical model only included the treatment as a fixed effect and block as a random effect. The significant level was set at 0.05 and trends were considered when 0.05 < P < 0.10. All cows calved singlets, and 4 cows had retained placenta (2 from each treatment group).
Results
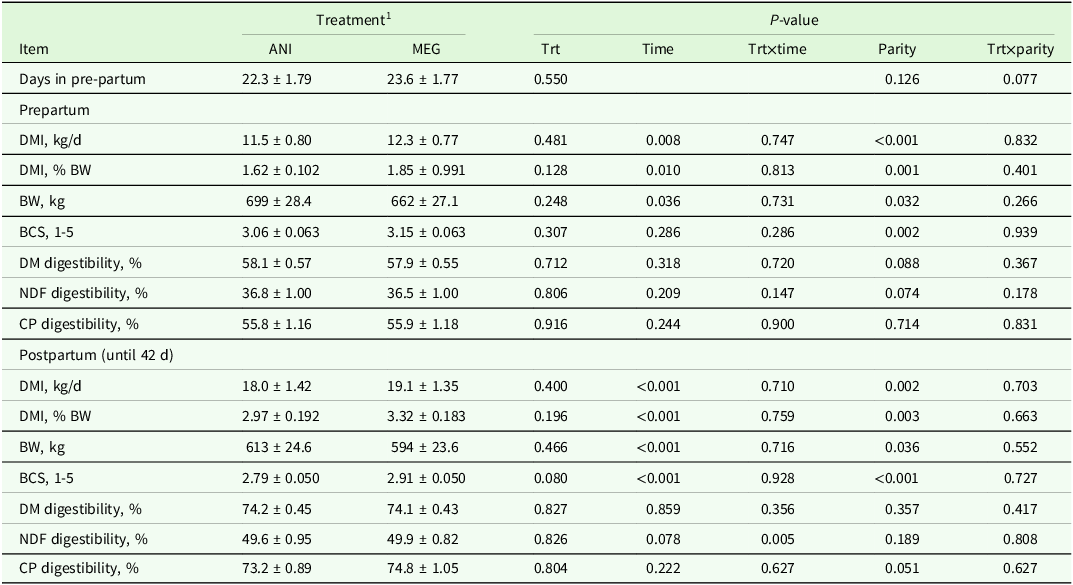
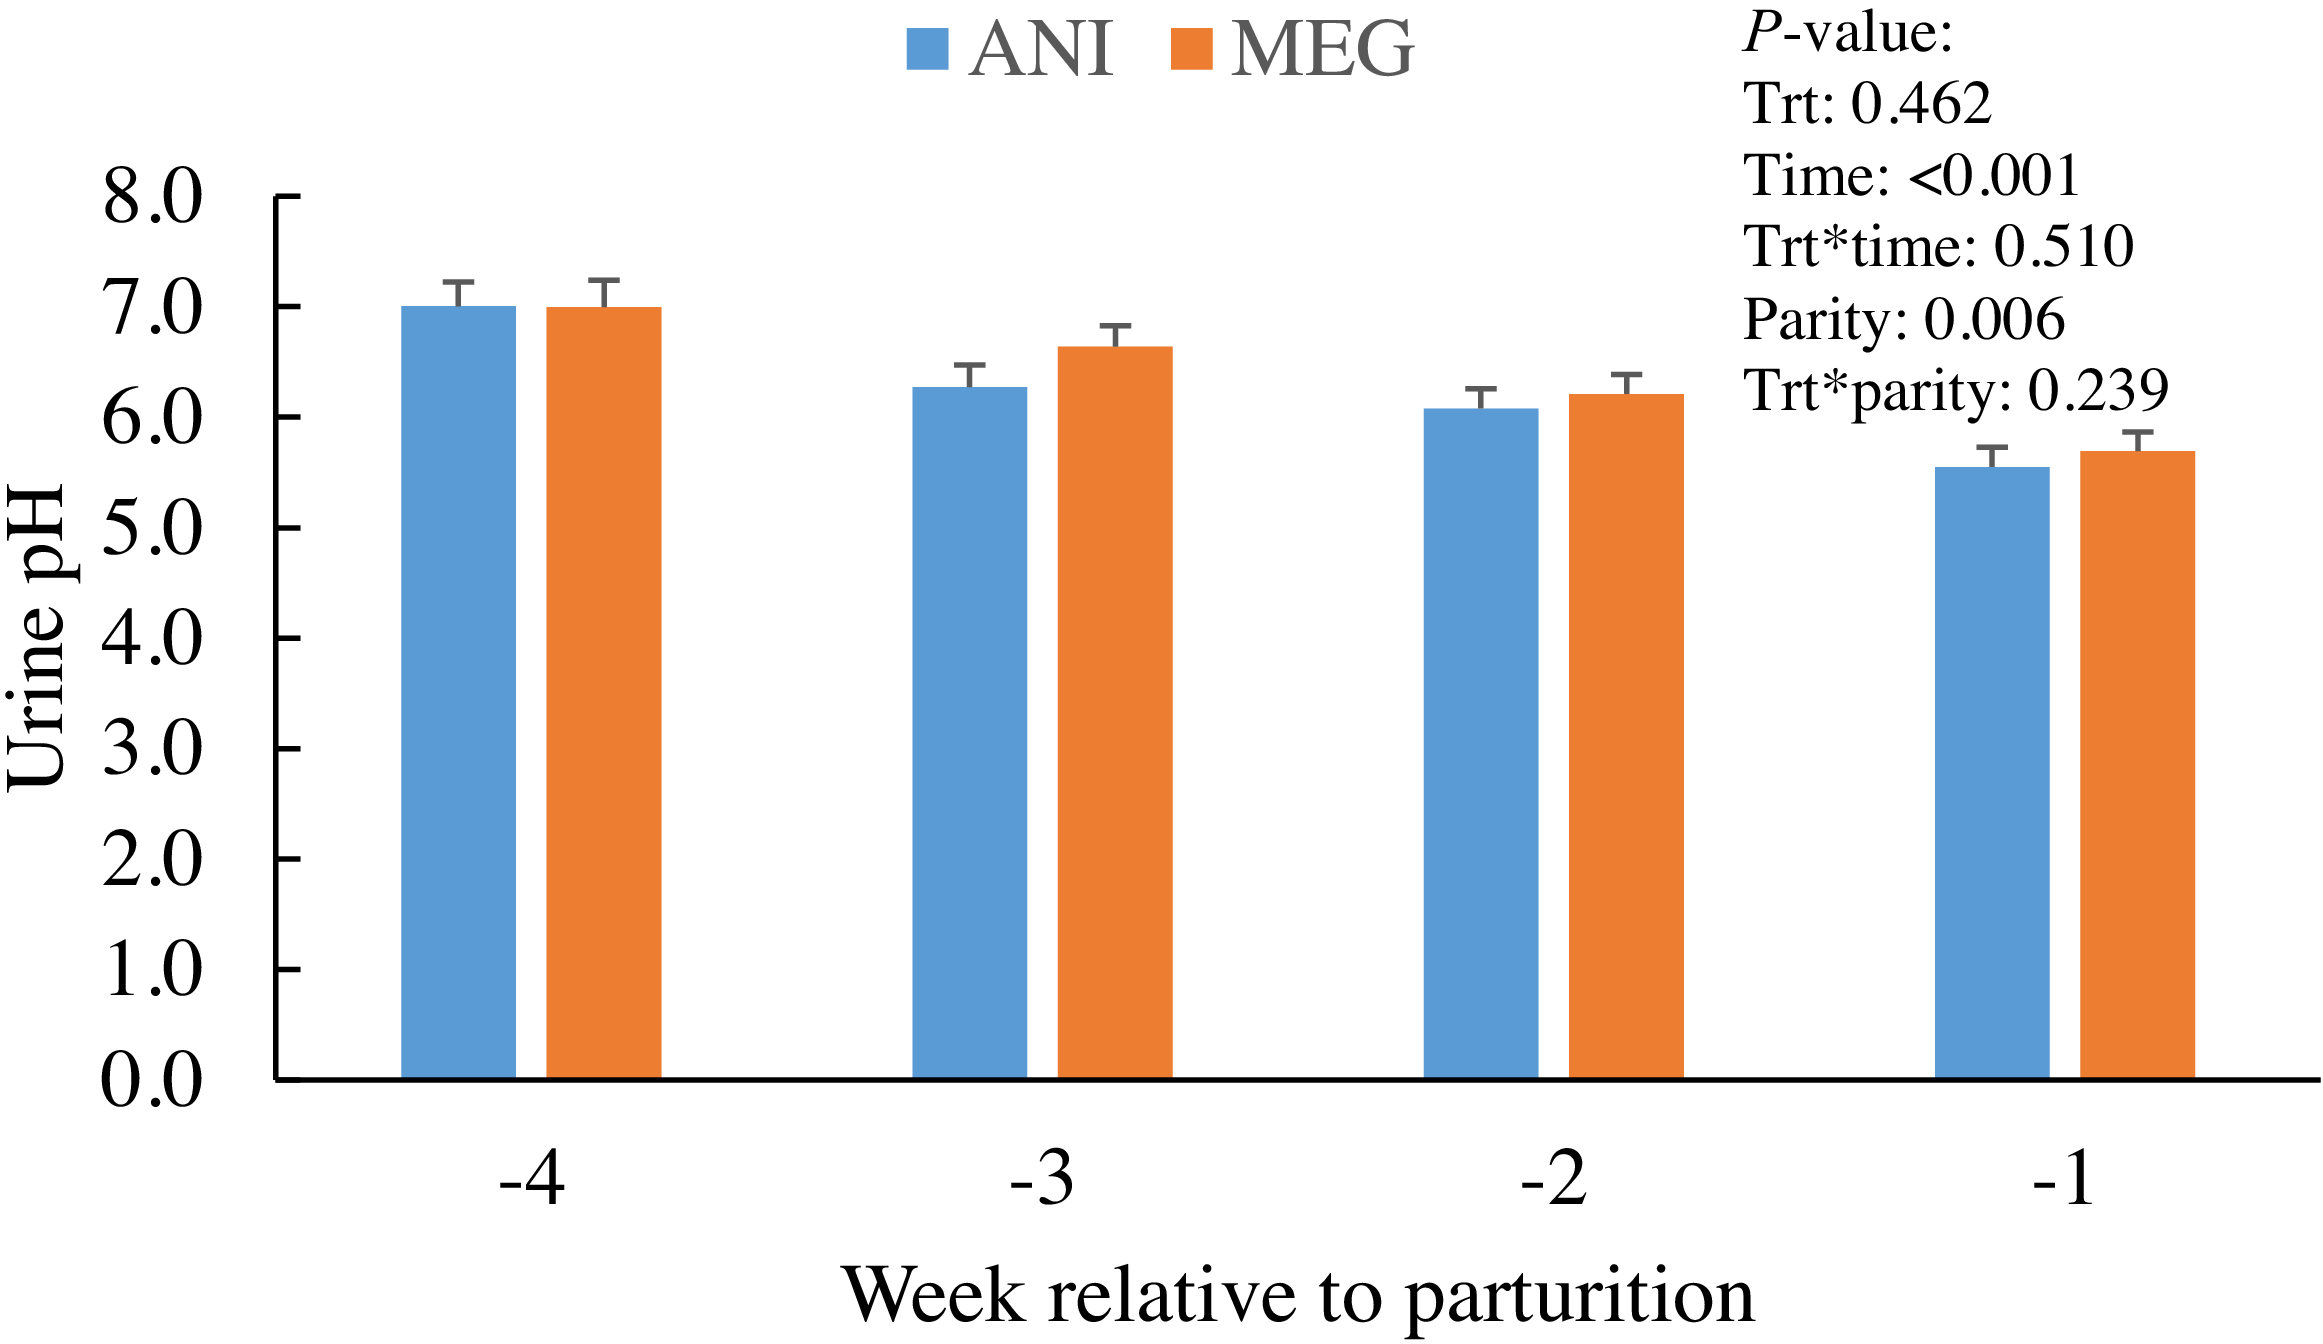
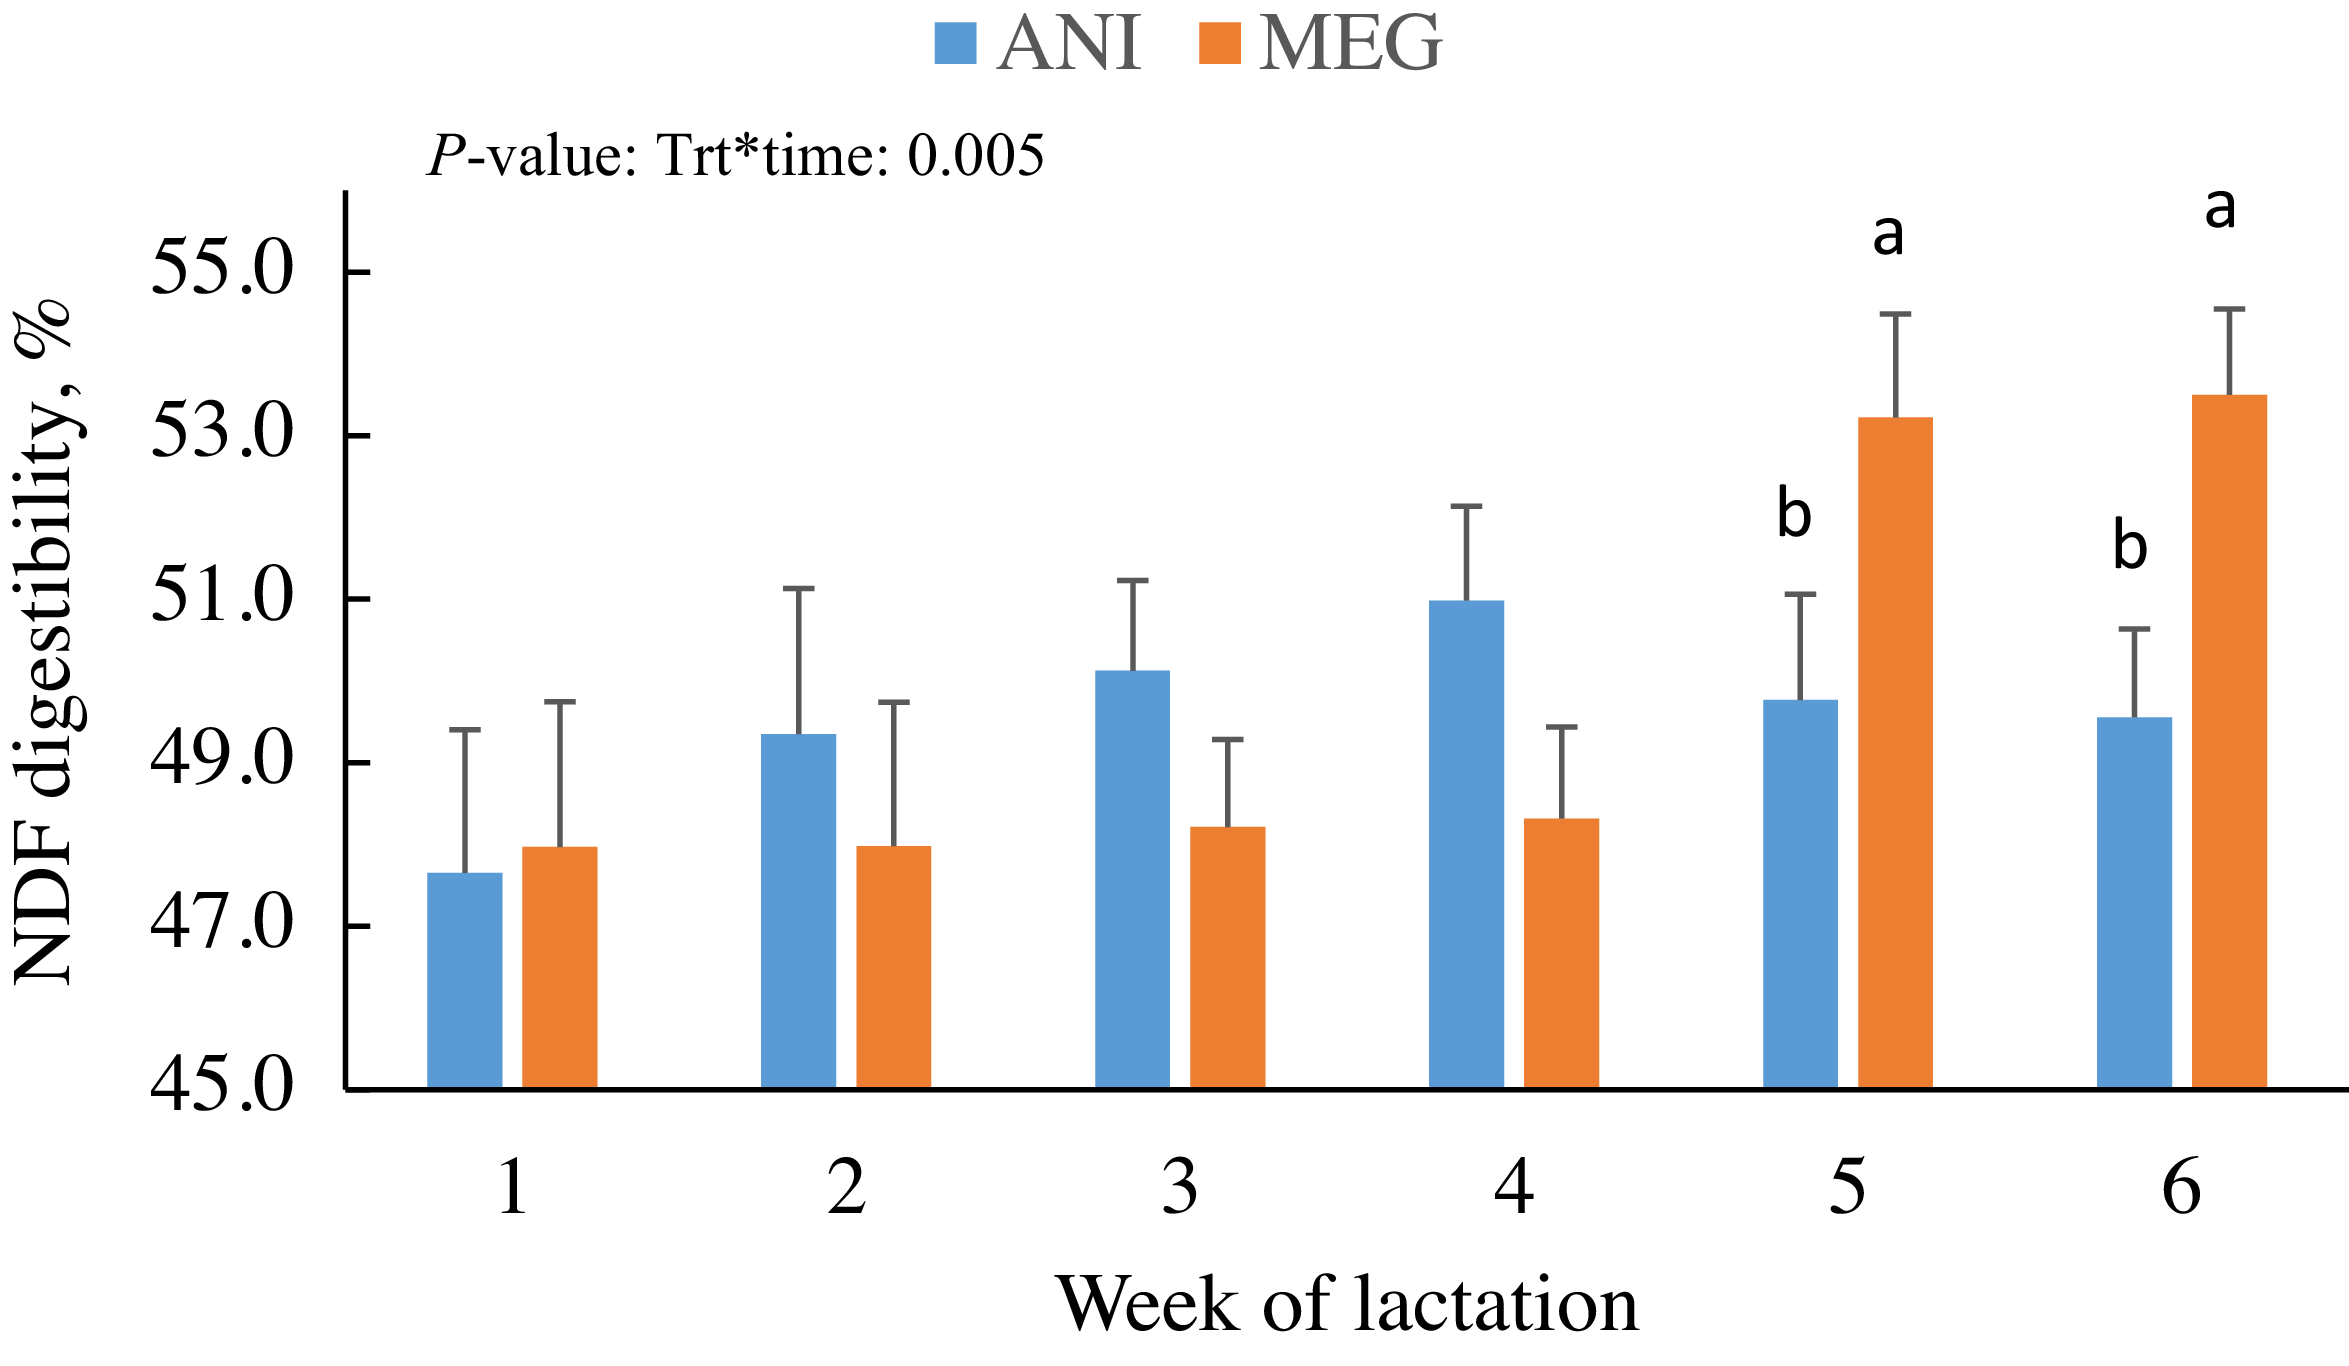
Treatment groups received anionic salts for similar periods (P = 0.550) with 22.2 and 21.6 d for ANI and MEG, respectively (Table 2). Intake of DM was not affected by treatments (P ≥ 0.710) either during the prepartum or postpartum periods. Urine pH was similar (P = 0.462) between treatments during the prepartum period (Figure 1). Although no differences were detected in BW, cows fed MEG tended to exhibit greater (P = 0.080) BCS during the post-partum period. An interaction effect between treatment and time was observed (P = 0.001) for NDF digestibility during the postpartum period, whereas cows fed MEG had greater NDF digestibility on weeks 5 and 6 of lactation (Figure 2).
Nutrient intake and digestibility, body weight (BW), and body condition score (BCS) in dairy cows fed different anionic salt products during the pre-partum period (LSmeans ± SE)

1 Animate (ANI), anionic salts (Animate, Phibro Animal Health) fed at 2.85 % diet DM; or MegAnion (MEG), anionic salts (MegAnion, Barentz Animal Nutrition) fed at 1.85 % diet DM. Treatments were provided from 30 days from the expected calving date until calving.
DMI = dry matter intake, NDF = neutral detergent fibre, and CP = crude protein.
Urinary pH in dairy cows fed different anionic salt products during the pre-partum period (LSmeans ± SE). Animate (ANI), anionic salts (Animate, Phibro Animal Health) fed at 2.85 % diet DM; or MegAnion (MEG), anionic salts (MegAnion, Barentz Animal Nutrition) fed at 1.85 % diet DM. Treatments were provided from 30 days from the expected calving date until calving.

Apparent total-tract digestibility of neutral detergent fibre in dairy cows fed different anionic salt products during the pre-partum period (LSmeans±SE). Animate (ANI), anionic salts (Animate, Phibro Animal Health) fed at 2.85 % diet DM; or MegAnion (MEG), anionic salts (MegAnion, Barentz Animal Nutrition) fed at 1.85 % diet DM. Treatments were provided from 30 days from the expected calving date until calving. Within each time point, columns with different letters differ significantly (P < 0.05).

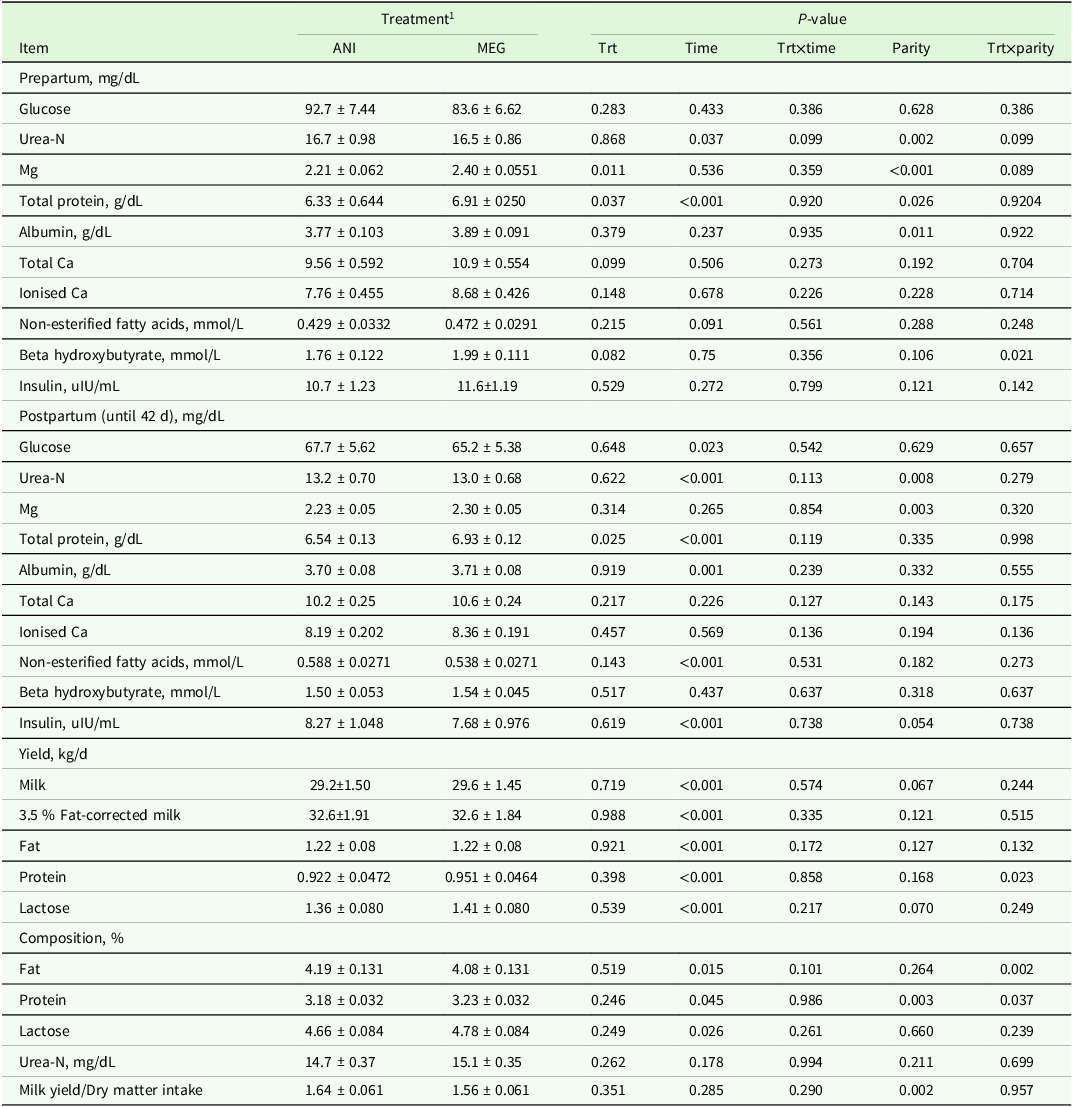
Serum concentration of Mg was greater (P = 0.011) in cows fed MEG than ANI during the pre-partum period (Table 3). Serum concentration of total Ca tended to be greater (P = 0.099) in cows fed MEG than ANI during the prepartum period; however, no differences were found in ionised Ca either in prepartum or postpartum periods. Total protein concentration was greater (P = 0.037) in cows fed MEG during the prepartum period. No interactions between treatment and time were detected for blood metabolite concentrations. Yields of milk, FCM, fat, protein or lactose were not affected (P ≥ 0.398) by feeding different anionic salt products.
Blood metabolites in dairy cows fed different anionic salt products during the pre-partum period (LSmeans ± SE)

1 Animate (ANI), anionic salts (Animate, Phibro Animal Health) fed at 2.85 % diet DM; or MegAnion (MEG), anionic salts (MegAnion, Barentz Animal Nutrition) fed at 1.85 % diet DM. Treatments were provided from 30 days from the expected calving date until calving.
Discussion
We postulated that feeding MEG would lead to higher concentrations of blood Ca and lower urine pH during the pre-partum period when compared to ANI, but both supplements would support calcium metabolism and performance. The observed treatment DCAD values were lower than initially designed with DCAD values of -55.9 and -32.1 mEq/kg DM for ANI and MEG, respectively. Laboratory analysis of the anionic supplements revealed lower Cl and S contents than those reported by the manufacturers. The actual Cl concentrations were 8.99 % for ANI and 16.2 % for MEG, compared to the minimum guaranteed values of 13.3 and 23.7 %, respectively. Indeed, cows fed MEG tended to present greater total Ca concentrations in blood but showed similar urine pH during the prepartum period when compared to those fed ANI. Dry matter intake and milk yield throughout the study was similar between treatment groups. It is important to note that the sampling procedures may have been a limiting factor, and the absence of continuous forage mineral analysis during the experiment prevented adjustments in additive inclusion rates to maintain the target DCAD.
Because we did not design the study with a true control group (e.g., positive DCAD), we are not able to affirm whether MEG increased or prevented a decrease in DMI, which is often observed when feeding anionic salts during the pre-partum period. The literature has shown that the inclusion of ANI to reduce DCAD has yielded inconsistent results regarding DMI during the prepartum period. Some authors have reported no effects (Beck et al., Reference Beck, Zapalac, Chapman, Zanzalari, Holub, Bascom, Engstrom, Reuter and Foote2022) on feed intake, while others have observed decreased intake (Glosson et al., Reference Glosson, Zhang, Bascom, Rowson, Wang and Drackley2020). These different responses might be attributed to variations in the targeted DCAD, where Beck et al. (Reference Beck, Zapalac, Chapman, Zanzalari, Holub, Bascom, Engstrom, Reuter and Foote2022) fed diets with -154 mEq/kg DM and Glosson et al. (Reference Glosson, Zhang, Bascom, Rowson, Wang and Drackley2020) fed diets with -240 mEq/kg DM. In the experiment comparing MEG with another anionic salt (SoyChlor, Landus, Ames, IA, US), authors reported similar DMI when feeding diets with DCAD levels of -200 and -228 mEq/kg DM for the MEG and SoyChlor treatment groups, respectively (Caixeta et al., Reference Caixeta, Weber, Johnson, Faser, Visser and Crooker2020). Similar DMI between treatment groups is also supported by similar digestibility values of DM, NDF and CP (Caixeta et al., Reference Caixeta, Weber, Johnson, Faser, Visser and Crooker2020).
Feeding a diet that leads to a urine pH between 6.0 and 7.0 is suitable for reducing the risk of clinical hypocalcaemia and the severity of subclinical hypocalcaemia (Melendez and Chelikani, Reference Melendez and Chelikani2022). In the current study, average urine pH values were 6.33 and 6.49 for ANI and MEG, respectively. Urine pH values between 5.93 and 7.02 during the prepartum period have been achieved by feeding MEG targeting DCAC values of -180 and -100 mEq/kg, respectively (Hassanien et al., Reference Hassanien, Galyean, Ballou, Mahmoud, Abdel-Raouf and Eweedah2022). Both treatment groups were fed acidogenic diets for similar time periods in this study, with durations of 22.2 and 21.6 d for ANI and MEG, respectively. Studies have reported that extending the feeding of a negative DCAD beyond 21 d is unnecessary and might jeopardise cows’ performance (Wu et al., Reference Wu, Bernard, Zanzalari and Chapman2014; Lopera et al., Reference Lopera, Zimpel, Vieira-Neto, Lopes, Ortiz, Poindexter, Faria, Gambarini, Block, Nelson and Santos2018).
In the blood, calcium exists in various forms, including a free ionised form (∼50 %), protein-bound form (∼40 %) and complexed with anions such as lactate, citrate, inorganic phosphate and bicarbonate (Ott et al., Reference Ott, Schrapers and Aschenbach2021). The state of compensated metabolic acidosis observed in cows fed anionic salts typically displaces Ca bound to albumin or salts in blood (Oberleithner et al., Reference Oberleithner, Greger and Lang1982), resulting in ionisation of Ca – which is the only form is available for the maintenance of Ca homeostasis (Forman and Lorenzo, Reference Forman and Lorenzo1991). This study did not reveal differences in blood concentrations of total and ionised Ca either during the pre- or post-partum periods. Several cutoff values of serum concentrations of Ca have been used to define subclinical hypocalcaemia and they range from 8.0 to 8.8 mg/dL (Caixeta et al., Reference Caixeta, Ospina, Capel and Nydam2017). For ionised Ca, studies have defined subclinical hypocalcaemia as blood concentrations below 1 mmol/L (or 4.0 mg/dL) during the first 24 to 48 hours postpartum (Martinez et al., Reference Martinez, Risco, Lima, Bisinotto, Greco, Ribeiro, Maunsell, Galvão and Santos2012; Neves et al., Reference Neves, Leno, Bach and McArt2018). In this experiment, serum concentrations of Ca averaged from 9.68 to 10.9 mg/dL suggesting that cows did not experience disruptions in Ca metabolism. Additionally, no cow demonstrated signs of clinical hypocalcaemia – such as restlessness, muscle tremors, mild ataxia, bloat or recumbency (Kang et al., Reference Kang, Lungu, Danso, Dzou, Chen, Zheng, Nie, Lin, Chen and Zhou2025) – at any point during the experiment.
Serum concentrations of Mg during the prepartum were greater in cows fed MEG compared to ANI. Mild compensated metabolic acidosis may increase the electrochemical gradient across the rumen epithelium, thereby facilitating passive Mg absorption (Goff and Horst, Reference Goff and Horst1997). It could be speculated that the higher chloride intake in cows fed MEG contributed to the increased blood Mg concentrations observed in this group. However, urine pH was similar between treatment groups suggests a similar acid-base status. Mg is linked with Ca metabolism as it is important for parathyroid hormone secretion and action and bone Ca resorption (Vetter and Lohse, Reference Vetter and Lohse2002). This effect might be related to the tendency for greater total Ca concentration observed in cows fed MEG during the prepartum period. Allen et al. (Reference Allen, Sansom and Davies1981) demonstrated a negative association between blood Mg and hypocalcaemia, indicating that cows with Mg levels below 0.80 mM had an increased risk of milk fever. In the current study, serum concentrations of Mg during the postpartum period ranged from 2.21 to 2.38 mg/dL (or 0.91 to 0.98 mM). Aligning with results observed by Caixeta et al. (Reference Caixeta, Weber, Johnson, Faser, Visser and Crooker2020), blood metabolite concentrations, including glucose, BHBA, NEFA, insulin and urea-N were similar between treatment groups. Collectively, the data of serum concentrations of Ca and Mg, coupled with the absence of clinical signs of hypocalcaemia, suggest that homeostasis of Ca metabolism was not disrupted in the present study.
Performance responses to different anionic salt products were similar in the current study, which was somewhat expected as no differences were detected on DMI, nutrient digestibility and biomarkers of adipose tissue mobilisation (NEFA and BHBA). Cows under MEG treatment tended to exhibit a slightly greater BCS during the post-partum period (+0.15 unit), which seems of non-biological importance when analysed alongside the data of blood metabolites and milk yield and composition. However, small changes in BCS change (-0.10 unit) during the transition period and early lactation can affect calving interval of dairy cows (Fricke et al., 2023). In line with the current experiment, authors have not found differences in milk yield and composition of cows fed MEG or another DCAD product during the pre-partum period (Caixeta et al., Reference Caixeta, Weber, Johnson, Faser, Visser and Crooker2020). It is important to emphasise that despite the similar responses to anionic salt products in Ca metabolism and performance, the relatively high proportion of nulliparous cows enrolled in this study complicates the interpretation of results. McArt and Neves (Reference McArt and Neves2020) reported that 17.4 % of primiparous cows and 19 % of multiparous cows had transient hypocalcaemia, whereas 23 % of primiparous and 13 % of multiparous cows had persistent hypocalcaemia in early lactation. Studies with a larger number of animals should be performed because multiparous cows are more susceptible to disturbances of Ca metabolism during the periparturient period (Lean et al., Reference Lean, DeGaris, McNeil and Block2006), and there is limited data in literature on the effectiveness of negative DCAD diets in reducing the risk of milk fever in nulliparous cows (Santos et al., Reference Santos, Lean, Golder and Block2019). However, total Ca concentration in blood was increased in both nulliparous or multiparous cows at the day of calving and during the post-partum period when decreasing DCAD (Santos et al., Reference Santos, Lean, Golder and Block2019).
Conclusion
Different anionic salt products resulted in similar performance outcomes without affecting DMI during the transition period and early lactation. This study did not reveal differences in ionised Ca concentrations in the serum of cows. Both anionic salts appear to maintain adequate Ca metabolism during the periparturient period. However, this experiment cannot determine the specific effects of anionic salt supplementation on DMI, performance or blood calcium concentrations, as no negative control group (i.e., without anionic salts) was included.
Acknowledgements
We acknowledge staff of Laboratório de Pesquisa em Bovinos de Leite (Pirassununga, Brazil) for helping with animal care and handling.
Author contributions
Conceptualisation, F.P.R.; methodology, O.P.S., C.S.T., N.T.S.G., M.S.R.S. and G.G.S.; validation, F.P.R.; formal analysis, C.S.T. and F.P.R.; investigation, O.P.S., N.T.S.G. and M.S.R.S.; resources: J.V., D.B., D.B. and F.P.R.; data curation, O.P.S., N.T.S.G. and M.S.R.S.; writing – original draft preparation, C.S.T., J.V., D.B., D.B. and F.P.R.; supervision, F.P.R.; project administration, F.P.R.; funding acquisition, J.V., D.B., D.B. and F.P.R. All authors have read and agreed to the published version of the manuscript.
Funding statement
This research was partially funded by FeedProfessionals (Buenos Aires, Argentine).
Competing interests
The authors declare that Juan Vieyra is employed by FeedProfessionals, which constitutes a conflict of interest.
Ethical standards
All experimental procedures were conducted under the approval of the Ethics Committee on Animal Use (protocol #6386300123) of the School of Veterinary Medicine and Animal Science of University of São Paulo (São Paulo, Brazil).