Introduction
The importance of glacier influence for river discharge and hydropower production in Norway is reflected in the extensive glacier measurement record. Glaciers cover about 1 % of the land area in Norway, and many of them are situated in regions with considerable hydropower potential. In Norway, 98% of electricity is generated by hydropower production. About 15% of the used runoff comes from glacierized basins. In order to investigate the contribution of glaciers to runoff, mass-balance studies were initiated in the 1960s at selected glaciers, and the glacier division was established at the Norwegian Water Resources and Energy Directorate (NVE). Through legislation, glacier mass-balance measurements (short- and long-term programmes) have been included in the licensing terms for hydropower production plants in glacierized basins.
The Intergovernmental Panel on Climate Change has recognized the importance of monitoring glaciers and their relation to climate (http://www.ipcc.ch). Length change (also termed front-position change) records can be used as a rough estimate for secular trends in mean mass-balance changes (Reference Jóhannesson, Raymond, Waddington and OerlemansJóhannesson and others, 1989) and are considered as proxies for climate change on a decadal-to-century timescale (Reference OerlemansOerlemans, 2000). Glacier length-change measurements are considered one of the most important key variables in future global glacier monitoring strategies (Reference Hoelzle, Haeberli, Dischl and PeschkeHoelzle and others, 2003).
Results from NVE’s glaciological measurements have been published annually or biannually since 1963. Results from all mass-balance studies on Norwegian glaciers up to 2002 were published by Reference Kjøllmoen, Andreassen, Engeset, Elvehøy and JacksonKjøllmoen and others (2003). A summary of glacier length records (front-position data) was published by Reference Elvehøy, Haakensen, Kennett, Kjøllmoen, Kohler and TvedeElvehøy and others (1997), and since then the annual changes have been published in the NVE report series (e.g. Reference Kjøllmoen, Andreassen, Engeset, Elvehøy and JacksonKjøllmoen and others, 2004).
In this paper, we summarize the comprehensive set of mass-balance and length records for Norwegian glaciers, and analyze the temporal and spatial glacier changes.
Observations
Mass-balance study glaciers
The first mass-balance measurements in mainland Norway were undertaken at Storbreen in spring 1949 by O. Liestøl of the Norwegian Polar Institute (NP) (Reference LiestølLiestøl, 1967). In order to study spatial variations in glacier mass balance and their impact on runoff from glacier-covered catchments, NVE started a mass-balance programme on several glaciers in Norway in the early 1960s. The number of observed glaciers reached its maximum of 16 in 1970/71, followed by a gradual decrease to 7 in 1983. Since 1986, 10 or more glaciers have been measured each year. Currently (2004) mass balance is measured on 14 glaciers. Most of the measurements have been made by NVE. Additional observations have been made by NP and the Universities of Arhus and Oslo.
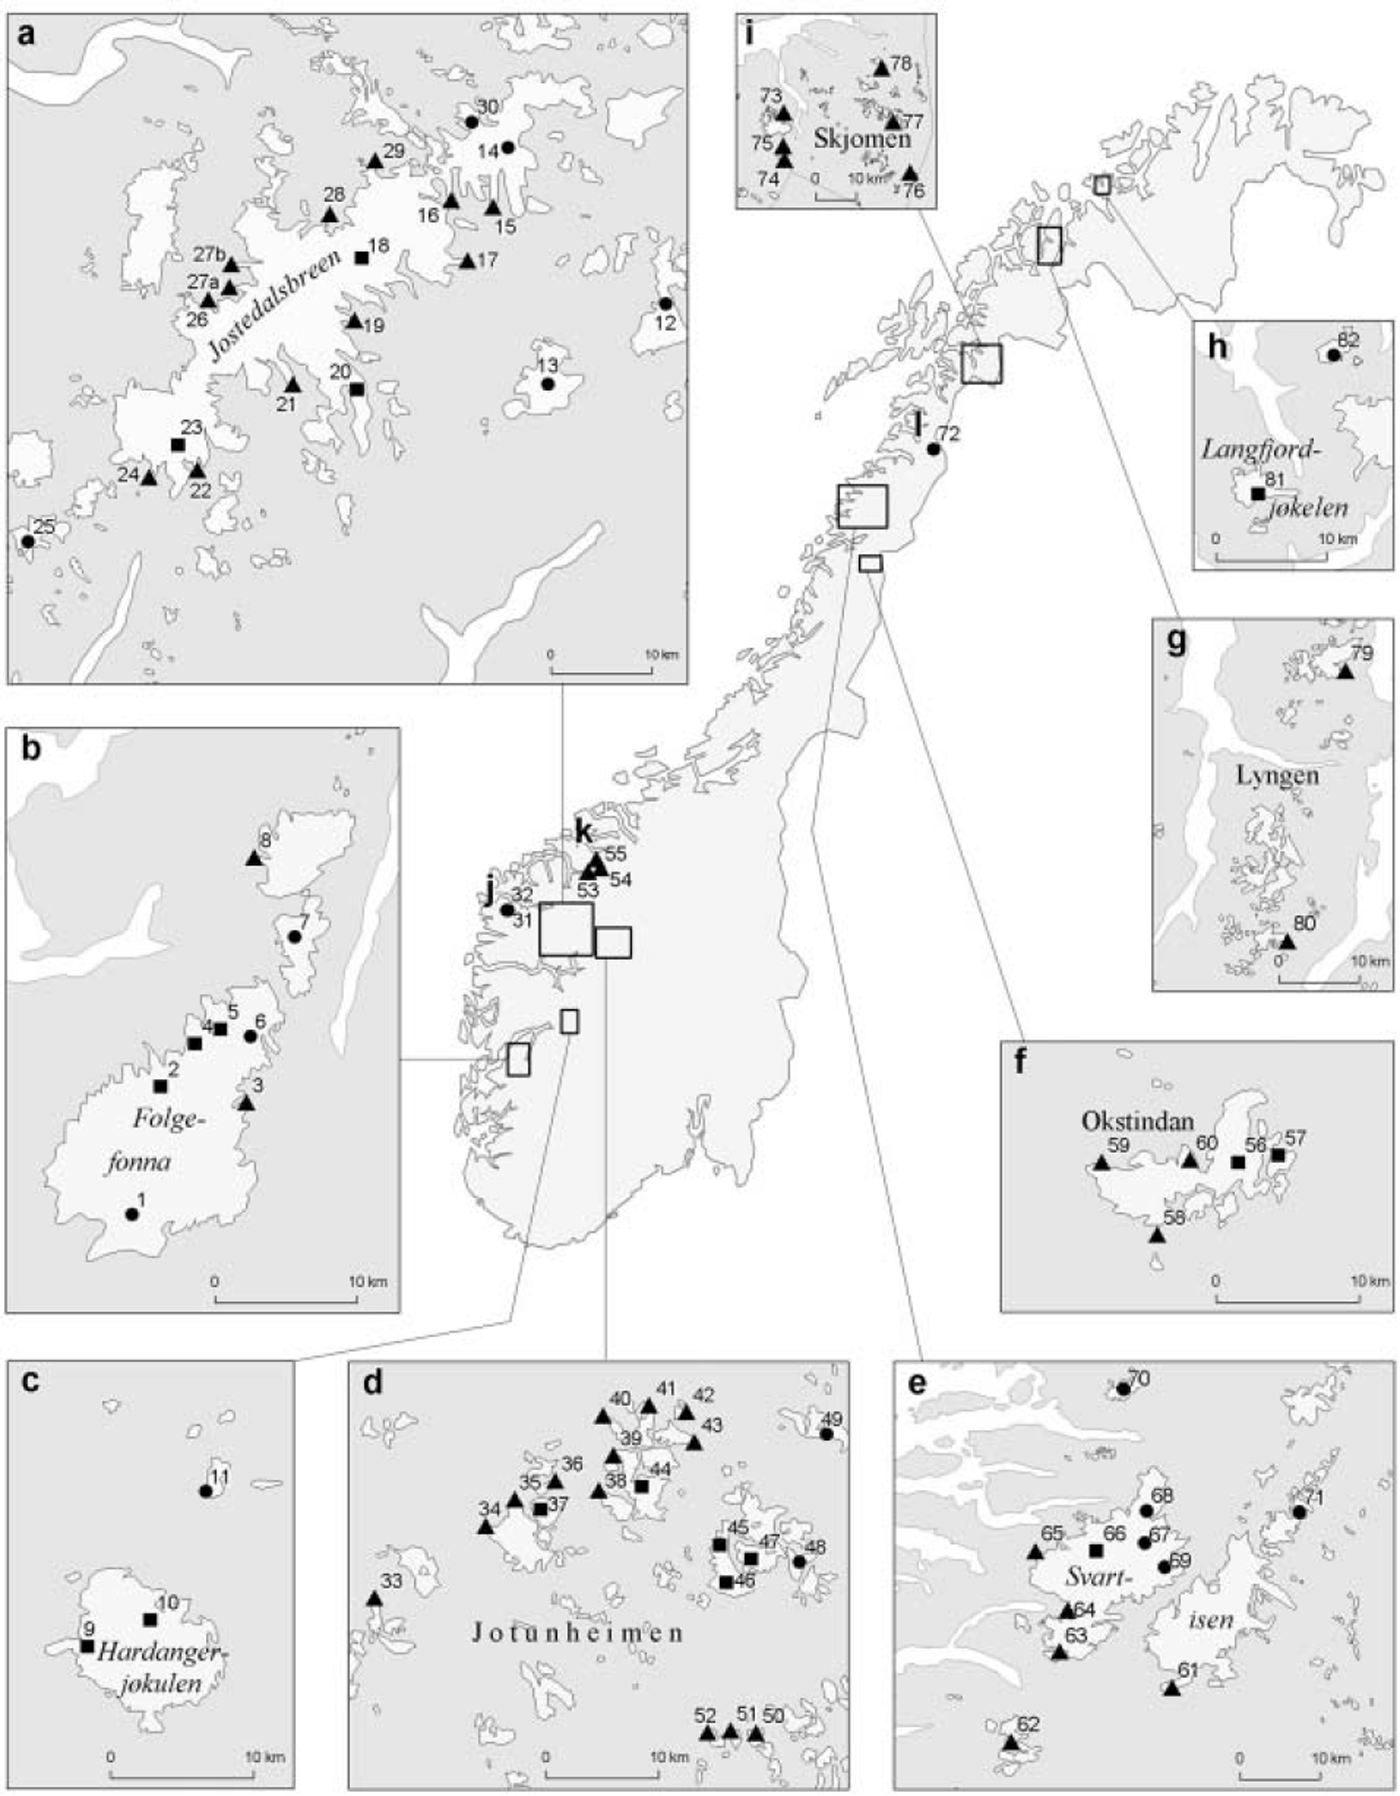
In total, mass balance has been measured on 42 glaciers, producing 517 observation years including 2003 (Fig. 1; Table 1). To put this in perspective, the World Glacier Monitoring Service has a total of about 3000 observation years from more than 200 glaciers worldwide, including the Norwegian glaciers. In Norway, the total glacier area measured is 483 km2, nearly 20% of the glacierized area in mainland Norway (∼2600km2). Nearly half of the studied mass-balance glaciers are small (<5 km2). The six largest glaciers (>25 km2) cover more than half of the total area.

Overview of mass-balance measurements and resulting statistics in Norway up to and including 2003. Areas and numbers refer to the location map (Fig. 1). 〈bw〉 〈b〉i and 〈b〉i are mean specific winter, summer and net balance, a is annual mass-balance amplitude, 〈ELA〉 is mean equilibrium-line altitude, sbw/sbn and sbs/sbn are the relationship between the standard deviations of the individual components sbw, sbs and sbn, and 〈bw/bw_ref〉 and 〈bs/bs_ref〉 are the relationship between the 〈bw〉 and 〈bs〉 observed at one glacier and the mean values for the same period at the reference glacier (Nigardsbreen, southern Norway, and Engabreen, northern Norway)

In southern Norway, six of the glaciers have been measured since 1963 or before. They constitute a west-east profile extending from the maritime Alfotbreen to the continental Grasubreen. Storbreen in Jotunheimen has the longest series of any glacier in Norway, with 55 years of measurements. Engabreen has the longest series in northern Norway, dating back to 1970. However, half of the observed glaciers (amounting to 15% of the observation years) have been monitored for 6 years or less due to short-term contracts or special investigations.
Many of the studied glaciers are outlets from ice caps. The mean equilibrium-line altitude (ELA) increases with distance from the coast due to drier conditions, and decreases from south to north due to lower temperatures with increasing latitude. The ELA is about 1160ma.s.l. at Ålfotbreen in the west and about 2130 ma.s.l. at Gråsubreen in the east. In northern Norway, the mean ELA is 1340 m a.s.l. at Okstindbreen and decreases to 870 m a.s.l. at Langfjordjøkelen, the northernmost of the studied glaciers. The altitudinal ranges of the glaciers also differ greatly, as can be seen for nine of the glaciers in Figure 2.
Mean net balance profiles vs altitude for nine of the studied mass-balance glaciers for the period 1989–2003.

Mass-balance observation methods
Studies of mass balance comprise measurements of accumulated snow (winter balance, b w) during the winter season, and measurements of snow and ice removed by ablation (summer balance, b s) during the summer season. The net balance is the sum of these two components:

where b s is negative. The methods used to measure mass balance have changed little over the years (Østrem and Brugman, Reference Østrem and Brugman1991; Kjøllmoen and others, Reference Kjøllmoen, Andreassen, Engeset, Elvehøy and Jackson2004). The winter balance is normally measured in April or May each year by probing to the previous year’s summer surface along regular profiles. Typically 100–150 snow-depth soundings are made on each glacier. Stake readings and snow-depth corings are used to verify the probings where possible. Snow density is measured in pits and with coring at one or two locations at different elevations on each glacier.
Summer and net balances are obtained from stake measurements, usually carried out in September or October. The number of stake positions varies from glacier to glacier; typical values being 5–15. In general, the stake density is highest on the smallest glaciers and declines with increasing glacier size. The density of the remaining snow is measured in years when much of the snow remains. Further details regarding individual glaciers are found in Kjøllmoen and others (Reference Kjøllmoen, Andreassen, Engeset, Elvehøy and Jackson2004).
Although the principal methods have not changed much over the years, the amount of fieldwork has been reduced. For example, in the first years of mass-balance measurements at Nigardsbreen (48 km2), 400–500 snow-depth soundings were made, density was measured in three to four snow pits and ablation was measured at 50–60 stakes. Similarly, at Storsteinsfjellbreen (6 km2), 240 snow-depth soundings were made and ablation was measured at about 40 stakes. Since detailed investigations of mass balance are both costly and time-consuming, a simplification of the programme was considered in the early 1980s. A statistical analysis of the previous years’ accumulation and ablation patterns revealed that the monitoring programme could be reduced on individual glaciers while achieving an acceptable accuracy. Thus, from 1983 the programme was reduced, especially at large outlet glaciers like Nigardsbreen and Engabreen.
The mass balance is usually calculated using the stratigraphic method (Østrem and Brugman, Reference Østrem and Brugman1991), i.e. between two successive ‘summer surfaces’ (surface minima). Consequently, the measurements describe the state of the glacier after the end of melting and before fresh snow starts to fall. Melting after the ablation measurements may occur in warm periods late in autumn, and is commonly observed on the lower parts of glaciers with large altitudinal ranges, like Nigardsbreen and Engabreen. For practical reasons, this melting and any new snow that falls before the autumn measurement, are considered part of the next year’s winter balance.
Point measurements of winter and summer balance are plotted directly on a graph, and mean values for each 50 or 100 m elevation interval calculated or estimated. The net balance is calculated by summing the curves. Until the 1980s, hand-contoured maps of accumulation and ablation were made from the observations. The areas within each height interval (50 or 100 m) were planimetered and the total amount of accumulation and ablation was calculated for each height interval. From the maps, winter, summer and net balance curves with altitude were drawn, as is done today.
The uncertainties in the mass-balance measurements are dependent on both the accuracy of the point observations and the conversion of point values to spatially distributed values. The accuracy of soundings and core drillings depends mainly on how precisely the summer surface can be identified; in some years it is difficult to define in the firn area. The accuracy of the summer balance is mainly dependent on the representativity of the ablation stakes. A possible source of systematic error that may cause underestimation of the mass balance is the neglect of internal accumulation (Cogley and Adams, Reference Cogley and Adams1998). So far there is no good method for measuring internal accumulation. However, we consider this effect to be less important on glaciers with high mass turnover.
When the uncertainty in point measurements is thought of as random, the uncertainty in converting point values to spatial averages may introduce systematic errors. Assuming that the error for each year is truly random, the standard error for the cumulative period, T, can be calculated as:

where x is the number of years with measured values and t is the average standard error for each year with measured mass balance (Reference Andreassen, Elvehøy and KjøllmoenAndreassen and others, 2002). The average accuracy of the annual net balance is estimated subjectively as ±0.2 to ±0.4mw.e. Using this estimate for 42 years of measured values gives total standard errors in the range ±1.3-2.6 mw.e.
Glacier length study glaciers
Measurements of change in glacier front position, and thus glacier length change, have a long tradition in Norway. The first observations were obtained at Jostedalsbreen, Folgefonna, Okstindane, Svartisen, Skjomen and theJotunheimen area about 1900 (Reference RekstadRekstad, 1902; Reference ØyenØyen, 1906; Reference Hoel and WerenskioldHoel and Werenskiold, 1962). The size of the monitoring programme has varied according to levels of funding and dedication (Fig. 3), as shown by the increase in the number of glaciers studied under the supervision of K. Fægri at Bergen Museum after 1931, and the reduced number after 1945 under the Norwegian Polar Institute. A maximum of 43 glaciers was observed in 1938, and a minimum in 1992 when 7 glaciers were recorded. The observation programme was revitalized in 1995 in response to recent glacier advances.
Stacked column graph showing the annual number of Norwegian glaciers measured that retreated (>2 m), showed no change or advanced (>2m) between 1900 and 2003.

Length-change observations from 58 glaciers have been recorded (Fig. 1; Table 2). Since 1998 about 25 glaciers have been observed. Eleven glaciers have a relatively continuous record since initiation around 1900. A complete record exists from Briksdalsbreen, and 17 glaciers have >50 single observations. Eight glaciers have seven or fewer observations, six of which were included in the programme after 1995. The distribution of observed glaciers has been biased towards southern Norway because travel was so time-consuming and expensive at the beginning of the 20th century.
Overview of length-change records in Norway up to and including 2003. Areas and numbers refer to the location map (Fig. 1).The area, length and elevation ranges are from the glacier inventories of northern Scandinavia (Reference Østrem, Haakensen and MelanderØstrem and others, 1973) and southern Norway (Reference Østrem, Selvig and TandbergØstrem and others, 1988). n is number of years with observations. The net change, sum of advances and retreats are rounded to the nearest 10 m. The observation period varies; some periods are rather short

Glacier length observation methods
Glacier length change is derived from repeated measurements of distance between the glacier terminus and fixed landmarks, such as cairns, painted rocks or bolts. The distances are preferably measured parallel to the flowline and normal to the glacier perimeter. One or more points along the glacier front are measured and the observations are usually carried out in September or October each year. Traditionally, the distance has been measured with a measuring tape providing accuracy within 2 m. Where access was limited or dangerous, the accuracy could be considerably poorer. In recent years, a laser distance meter has been used at many of the glaciers, providing accuracy within 1 m. The glacier length measurements provide valuable information on glacier fluctuations, and regional tendencies and variations when considering long time periods and patterns displayed by a number of glaciers in a single area. Monitoring of a number of glaciers in an area is useful for filtering the influence of different glacier dynamics and geometries, and local meteorological conditions.
Analysis of Spatial and Temporal Variation and Change
Arithmetic means of the specific winter 〈b w〉, summer 〈b s〉 and net balance 〈b n〉 and the mean equilibrium-line altitude hELA〉 were calculated for all glaciers regardless of the number of observation years. The other statistics were calculated for glaciers with six or more observation years. The observation periods vary from glacier to glacier, and in order to compare the regional differences in the mass-balance components, the long-term series of Nigardsbreen and Engabreen were chosen as reference series in southern and northern Norway respectively. The relationship between the 〈b w〉 and 〈b s〉 observed at one glacier and the mean values for the same period at the reference glacier, 〈b w /b w_ref〉 and 〈b s /b s_ref〉, was calculated. The magnitude of the mass turnover at glaciers was calculated from the annual mass-balance amplitude, defined as

(Reference MeierMeier, 1984). Furthermore, the relative contribution of b w and b s to the fluctuation of b n was found by calculating the ratios sbw/sbn and sbs/sbn, where sbw, sbs and sbn are the standard deviations of the individual components (Reference Dyurgerov and MeierDyurgerov and Meier, 1999). The resulting statistics of the mass-balance measurements on Norwegian glaciers are given in Table 1. Specific values of mass balance are given in metres water equivalent (mw.e.).
Spatial variation in mass balance
The observed net balance profiles for nine of the observed glaciers for the period 1989-2003 reveal both the large difference in altitudinal range of the glaciers and the variation in mass-balance gradient and mass turnover (Fig. 2). Both Engabreen and Nigardsbreen have large balance gradients. The mass-balance turnover at these glacier tongues is very large compared to the glaciers in Jotunheimen at high elevations. However, the largest mass-balance amplitude, a, is found for Alfotbreen and Hansebreen (3.6 and 3.7 mw.e. respectively). Outlet glaciers from Svartisen, Jostedalsbreen and Folgefonna have high values of a, while the continental glaciers in Jotunheimen all have small a values, the smallest being recorded for Gråsubreen (0.92 mw.e.).
The long-term recorded mass balance for the period 1963-2003 along the west-east profile in southern Norway revealed a strong gradient in both summer and winter values (Fig. 4). The glaciers located near the west coast had a much higher mass turnover than those located further inland. The mean winter balance 〈bw〉 was highest at Alfotbreen (3.7mw.e.), gradually decreasing with distance from the coast to 2.4 m w.e. at Nigardsbreen, 1.5 m w.e. at Storbreen and 0.8mw.e. at the continental Gråsubreen in the east. Correspondingly, the mean summer balance 〈bs〉 was highest at Alfotbreen (-3.5 mw.e.), decreasing to -2.0 mw.e. at Nigardsbreen, -1.7mw.e. at Storbreen and -1.1 mw.e. at Gråsubreen. Hence, the respective 〈bw〉 and 〈bs〉 values at Gråsubreen are only one-fifth and one-third of those of Alfotbreen.
Mean winter, summer and net balance for Ålfotbreen, Nigardsbreen, Rembesdalskåka, Storbreen, Hellstugubreen and Gråsubreen for the period 1963–2003.

The Engabreen series is the only long-term series in northern Norway (1970-2003). Thus, detecting trends in northern Norway is more difficult since the other mass-balance records are relatively short and cover different time periods. Furthermore, the distance between these northern glaciers is very large; the distance from Okstindan in the south to Langfjordjøkelen in the north is 550 km. The 〈bw〉 of Engabreen is 2.9 mw.e., while 〈bs〉 was -2.3 mw.e., which is in the same order of magnitude as maritime glaciers in southern Norway (between Alfotbreen and Nigardsbreen). The 〈b w〉 decreases south, north and inland of Engabreen. All measured glaciers in northern Norway had higher 〈b s〉 than Engabreen, except Storsteinsfjellbreen (–1.9 mw.e.). The largest 〈b s〉 was recorded for Høgtuvbreen (–3.2 mw.e.), 1.60 times the value for Engabreen.
Differences were found in the importance of the individual components. The relative contributions of the variance of winter balance to the variance of the net balance (sb w /sb n) were largest for A lfotbreen (0.78) and Austre Okstindbre (0.77) and smallest for Hellstugubreen (0.44) and Gråsubreen (0.42). The summer-balance relative contributions to net balance (sb s /sb n ) were largest at Høgtuvbreen (0.86) and Gråsubreen (0.85) and smallest at Storsteinsfjellbreen (0.48) and A lfotbreen (0.53). However, large variations were found within local areas. For example, at Svartisen, at the western outlet Engabreen the sb w /sb n was slightly larger than the sb s /sb n, 0.71 vs 0.65. The east-facing and smaller glaciers like Trollbergdalsbreen and Høgtuvbreen show greater influence of summer balance than winter balance. Their values are similar to those of the continental glaciers in southern Norway.
Temporal variation in mass balance
The cumulative net balance series for glaciers in southern Norway for the period 1962(3)–2003 varied significantly (Fig. 5). The coastal glaciers gained considerably in total mass: Ålfotbreen (+9 mw.e.), Nigardsbreen (+17 mw.e.) and Rembesdalskåka (referred to as Hardangerjøkulen earlier; +5 mw.e.). However, while Nigardsbreen had a continuous positive mass balance from 1964 to 2000, Ålfotbreen had continuous positive mass balance since 1973 and Rembesdalskåka only from 1989. The period 1989–95 was exceptionally positive due to snow-rich winters, and Ålfotbreen, Nigardsbreen and Rembesdalskåka had a net mass increase of 11, 10 and 8 mw.e., respectively.
Cumulative net balance for Ålfotbreen, Nigardsbreen, Rembesdalskåka, Storbreen, Hellstugubreen and Gråsubreen for the period 1963–2003.

The continental glaciers had a total mass loss during the period 1962–2003: Storbreen (–9 mw.e.), Hellstugubreen (–14 m w.e.) and Gråsubreen (–13 mw.e.). However, like the maritime glaciers they had winter precipitation above normal, and a transient surplus in the period 1989–95 amounting to 2.8, 1.4 and 0.9m w.e. respectively.
Of all the recorded glaciers, Engabreen had the largest mass increase. Since 1970 the total mass surplus has been nearly 22 mw.e. As with the glaciers in southern Norway, the mass surplus was particularly large during the period 1989–95 (+10 mw.e.). The period 1973–76 also resulted in a large surplus (+8 mw.e.), which was also seen at Ålfotbreen (+6 m w.e.) but was much less evident at Nigardsbreen (+2 m w.e.) and Rembesdalskåka (+0.6 m w.e.).
The surplus period 1989–95 is evident in all glaciers except for Langfjordjøkelen, which had a small deficit in this period. Since 1997 the volume of Langfjordjøkelen has decreased every year. Since the mass-balance year 2000/01, all monitored mass-balance glaciers in Norway have had a remarkable deficit in volume.
Variation in glacier length change
In general, the Norwegian glaciers have retreated throughout the 20th century. The net retreat has been in the order of 0.4–2.3 km (Table 2). However, several periods of advance and recession have been recorded since measurements started in 1899 (Table 2; Figs 3 and 6). Many of the outlets from maritime ice caps in southern Norway had major advances culminating around 1910 and 1930. In Okstindane and at Engabreen an advance culminated around 1910. From the 1930s until 1990 a pronounced retreat took place for most glaciers in Norway. During this period, many outlet glaciers from the coastal ice caps retreated 1–2 km, while many continental valley glaciers in Jotunheimen retreated 0.5-1 km. Then in the 1990s many of the observed maritime glaciers started to advance; from 1992 the number of advancing and stable glaciers exceeded the number of retreating glaciers (Fig. 5). In 1998, the number of observed advancing glaciers reached its maximum of 14, 3 were considered stable (±2 m change) and only 5 of the 22 showed a net retreat. Since 2000, there has been a remarkably fast retreat at most of the observed glaciers.
Total cumulative length since 1900 for eight Norwegian glaciers.

Eight of the 11 glaciers with relatively continuous length records are shown in Figure 6. The three continental valley glaciers, Storbreen, Styggedalsbreen and Hellstugubreen, have small lengths (3-4km). They have all retreated nearly constantly throughout the observation period; small positive changes have been observed for Storbreen and Styggedalsbreen, in total 40-50 m for the whole period. The four maritime outlet glaciers all have periods of advances. Steep glaciers like Engabreen and Briksdalsbreen showed minor advances around 1960, 1970 and 1980, and have had the largest cumulative advances, 750 and 830 m respectively. The many periods of advance and recession at Briksdalsbreen imply a short response time to changes in mass balance at the glacier plateau. In contrast, no advances took place until the end of the 1980s at the more gently sloping and longer Nigardsbreen, Fabergstølsbreen and Austerdalsbreen; the sum of advances varies between 170 and 410 m for these glaciers. Nigardsbreen has had a large and near-continuous surplus since mass-balance measurements started in 1962, but retreated rapidly until the 1970s, after which the rate of recession declined considerably. However, since 1987 the glacier has advanced 270 m and it was the only one of the 25 observed glaciers that advanced from 2002 to 2003.
Discussion
The long-term recorded mass balance for the period 1963-2003 along the west-east profile in southern Norway reveals a clear gradient in mean summer and winter values, whereby the glaciers located close to the west coast have a much higher mass turnover than those located further inland. This west-east gradient is also found in the ratio of standard deviations of winter and summer balances with respect to standard deviation in net balances. Table 1 clearly shows that winter balance is the most important parameter of mass balance of the maritime glaciers, while the more continental glaciers are dominated by variations in summer balances. Mass balance can vary greatly within a region, as seen for glaciers in the Svartisen area, where, Trollbergdalsbreen and Høgtuvbreen are much more sensitive to summer balance than Engabreen. Therefore, a glacier’s altitudinal range, area distribution and winter precipitation gradient should be taken into account before assuming that one glacier’s mass-balance record is representative for a whole area.
All monitored glaciers except Langfjordjøkelen had a transient mass surplus for the period 1989-95. The winter balance for this period (bw1989-95i was 30% higher than 〈bw〉 for the whole observation period for all the monitored glaciers in southern Norway, with hardly any variation amongst the glaciers. The 〈bs1989-95〉 was below the mean for all the glaciers, 94% of 〈b s1963-2003〉 at Ålfotbreen, gradually decreasing further inland to only 80% of 〈bs1962-2003〉 at Grasubreen. Thus, the mass surplus in this period was mainly caused by the increase in winter precipitation at the maritime glaciers, and at the continental glaciers the transient surplus was due to a combination of a larger b w and a smaller b s than average. At Engabreen the mass surplus was due to a combination of higher b w (115% of 〈b w〉) and lower b s (82% of 〈b s〉). The increase in winter balance on the glaciers was due to a statistically significant increase in winter precipitation found in southwestern and northern Norway from around 1960 to 1997 (Reference Hanssen-Bauer and FørlandHanssen-Bauer and Førland, 1998). The downward change for all monitored Norwegian glaciers during the period 2001–03 is remarkable and seems to be in close agreement with other regions of the world (personal communication from M. Dyurgerov, 2004). The rapid thinning of Norwegian glaciers for these 3 years can be explained by a combination of less winter precipitation than normal (especially in 2001 and 2003) and higher summer ablation than normal. The 2002 summer was the warmest recorded in Norway since measurements started in 1876, and the 2003 summer was the fourth warmest. The high summer temperature in these two years caused record high ablation.
The global trend in mass balance shown by conventional mass-balance measurements has been mass deficit over the last 40 years (e.g. Reference Dyurgerov, Meier and ArmstrongDuyrgerov and others, 2002; Reference Haeberli, Frauenfelder, Hoelzle and ZempHaeberli and others, 2003). The cumulative mass balances have been negative for all reported glaciers, in contrast to the maritime glaciers in mainland Norway. Other studies using different cartographic methods have reported rapid thinning over wide areas (e.g. North America (Reference Arendt, Echelmeyer, Harrison, Lingle and ValentineArendt and others, 2002) and South America (Reference Rignot, Rivera and CasassaRignot and others, 2003)). However, while mass deficit is clearly the main trend, transient mass surpluses have been recorded for many glacierized areas worldwide, as observed also for the continental glaciers in Norway.
Very few comparative ground-based observations of length changes are available from continental valley glaciers and ice caps in northern Norway. However, studies of aerial photographs and maps indicate that most glaciers in northern Norway have retreated considerably since 1900 (Reference Andreassen, Kjøllmoen, Knudsen, Whalley and FjellangerAndreassen and others, 2000). Thus, the general trend for Norwegian glaciers in the 20th century is a net retreat, as in glacierized areas throughout the world, but decadal variations have been observed in Norway, as in many regions globally. Advances similar to those of the maritime Norwegian glaciers in the 1990s have been observed in Iceland and New Zealand, whereas in the European Alps and glacierized regions in North and South America glacier retreat was pronounced in this period (Reference Hoelzle, Haeberli, Dischl and PeschkeHoelzle and others, 2003).
Future climate scenarios indicate substantial atmospheric warming, which will impact Norwegian glaciers (e.g. Reference Førland, Roald, Tveito and Hanssen-BauerFørland and others, 2000). Several studies have been made of the possible effects of climate change on glacier mass balance: Ålfotbreen, Nigardsbreen, Hellstugubreen (Reference OerlemansOerlemans, 1992; Reference Jóhannesson, Laumann and KennettJóhannesson and others, 1993; Reference Laumann and ReehLaumann and Reeh, 1993) and Engabreen and parts of the Svartisen ice caps (Reference EngesetEngeset and others, 2000). All these results suggest a considerable mass deficit in a changed climate, mainly due to an increase in air temperature and consequently increased summer ablation.
Conclusions
There is a clear gradient in mean summer and winter balance along the west–east profile in southern Norway, the maritime glaciers located close to the west coast having a much higher mass turnover than those located in drier, continental conditions. The winter balance is the most important parameter of mass balance of the maritime glaciers, while the more continental glaciers are dominated by variations in summer balance. The maritime glaciers with a large annual mass turnover had a large mass surplus between 1962 and 2000. Conversely, the continental glaciers with small summer and winter balances had a mass deficit over the same period. In the period 1989–95 all monitored glaciers had a transient mass surplus, except for Langfjordjøkelen, the northernmost glacier. The increase was mainly caused by higher winter balance at the maritime glaciers in southern Norway, while the increase at Engabreen in the north and the continental glaciers in the south was caused by higher winter precipitation and lower summer balances than normal. Since 2001, all monitored glaciers have had a considerable mass deficit. The Norwegian glaciers have retreated during the 20th century. Continental glaciers have, with a few exceptions, retreated throughout the century, while many maritime glaciers have been through periods of advance and recession, although recession has been the main feature.
Acknowledgements
Over the years, many fieldworkers have been involved in collecting mass-balance and length data from Norwegian glaciers. It is thanks to these devoted people this comprehensive dataset was established. T. Tonning drew the location map, and J. Brittain corrected the English.