The literature on the resource curse typically links natural resource extraction to motives for and financing of internal violence against the incumbent government.Footnote 1 While empirical studies have shown that this trend holds on average,Footnote 2 it remains unclear how the presence of a strong authoritarian government affects the phenomenon. This article addresses the question using the case of Xinjiang, China, where the government maintains tight control over resource industries and is capable of implementing massive public security measures. We are thus able to examine how the conventional effects of natural resource development on ethnic confrontation shift in a strong and stable authoritarian state with a clear stake in the stability of an ethnically contentious region.
Our main research question is whether resource extraction in Xinjiang has a deflating effect on ethnic violence. We also ask how historical cultural distinctions within this region interact with resource development. Together, these questions constitute an examination of the channels through which natural resources might affect Xinjiang’s level of ethnic confrontation, if at all. We hypothesize and empirically investigate four potential mechanisms debated in the existing literature on resource politics and civil conflict: investment booms, employment opportunities, quality of local institutions, and religious and cultural cleavages.
To examine whether and how oil and gas production have affected levels of violence in Xinjiang, we collect novel field-level data on oil and gas production and reserves in Xinjiang along with detailed information on each of Xinjiang’s eighty-six counties. The data on natural resources include accurate locations of all oil and gas fields in the region, and precise production and proven reserve information from 1998 to 2005. Our violence data are incorporated from various academic and media sources. In order to measure historical, cultural and religious differences across counties, we collect mosque location information dating back to 1949 when Xinjiang was included in the People’s Republic of China. To further analyze the mechanism through which resource development affects ethnic contention in Xinjiang, we also collect geographic, demographic and socio-economic information at the micro-level, including individual-level census data.
Methodologically, our approach enables us to circumvent potential endogeneity issues between the outcome – the location of violence – and the causes, which are the locations where resource extraction is occurring and the locations that stand out as culturally and religiously more distinctive. Building a causal relationship between causes and outcomes is a fundamental difficulty in violence research. For instance, low economic growth can be both a cause and a result of violence. Therefore, finding exogenous factors that affect violence but that are not affected by violence has been a major concern among scholars.Footnote 3 The same difficulty exists with regard to religious identity and violence. It is hard to prove whether strong ethnic or religious identities intensify violence or vice versa.Footnote 4
In this study, we use two sources of spatial variation that are largely exogenous to recent violent events in Xinjiang. One is the location of natural resource reserves. Unlike other types of economic production, particularly manufacturing, on which most Chinese cities are dependent for development, the locations of natural resource endowment are unaffected by political factors. Furthermore, since natural resource development is monopolized by national state-owned enterprises in China, the impact of local capacity on resource development should be marginal in our case.Footnote 5 The other source of exogenous effects is the density of mosques built before 1949, which we employ as an instrumental variable in our study. This was the year that Xinjiang first fell under the rule of the Chinese Communist Party. Thus, the location of mosques built prior to 1949 cannot be affected by any ethnic violence that has emerged in the region since then. We use the distribution of mosques before 1949 as an instrument to estimate how historical gaps in culture and religion affect the incidence of violence in recent years.Footnote 6
Our empirical analyses suggest that, contrary to the resource curse argument and popular expectations regarding Xinjiang’s violence, an increase in oil and gas production significantly decreases the probability of ethnic violence. Employing data on resource reserves, which are exogenous to previous violence or other confounding covariates, we confirm that natural resource endowments have significant negative effects on the occurrence of violence in Xinjiang. Nevertheless, the mitigating effect of natural resources is conditional on the historical presence of Muslim religious sites. In counties with distinctive cultural and religious backgrounds instrumented by pre-1949 mosque density, the soothing effect of resource production dissipates.
Through what mechanism does resource development reduce violent incidents? We find no evidence that the soothing effects of natural resources are driven by enhanced public security measures, nor by the emigration of ethnic minorities out of the resource-producing areas. Our analyses show that local government security expenditures do not increase with resource production: no significant statistical association is found between resource production and total population, Han immigration or Uyghur emigration. Instead, we find that resource development provides important economic opportunities for the local population. Employment rates and individual-level income increase when a county produces more natural resources.
Our study contributes to the existing literature by providing empirical evidence contradicting several popular beliefs regarding the resource curse and Xinjiang’s political economy. First, the study adds to a growing body of literature that questions or provides conditional arguments to the resource curse discourse.Footnote 7 Scholars have found empirical evidence contradicting the resource curse claims with regard to democratization, economic growth and social welfare provisions. This article provides new evidence that contradicts the conventional wisdom linking resource endowments to ethnic grievances and thus violence, toward which most popular descriptions of the Xinjiang context are inclined.Footnote 8 At the same time, our research highlights the importance of historical religious and cultural gaps in sustaining ethnic tension.Footnote 9 Furthermore, while most studies on resources and conflict employ cross-national analyses, we aim to deliver precise estimations of the causal link by relying on micro-level data from a subnational region. Using detailed county-level data, we can effectively avoid the omitted variable bias that frequently plagues similar studies, as the counties in Xinjiang share provincial- or higher-level political economic factors, including historical background, institutions and policy. We also aim to make an empirical contribution by focusing our research on the Xinjiang area, where the resource–conflict relationship has been studied with quantitative data far less frequently than other areas with similar issues. Despite the growing concerns over Xinjiang’s ethnic tensions in the last decade, academic analyses based on systematic data have not followed the popular attention. To the best of our knowledge, our study is one of the first to analyze violence in Xinjiang using micro-level data and robust statistical methods.
THE LITERATURE ON RESOURCES, RELIGION AND ETHNIC VIOLENCE
Political scientists and economists have devoted significant effort to understanding the link between natural resources, religion and ethnic conflict in various settings. The most prominent theory so far is the resource curse discourse, endorsed in most studies on natural resources and violence. In particular, empirical studies based on cross-national data largely suggest that resource abundance provides stronger emotional and financial incentives for internal conflict.Footnote 10 Although several scholars have recently found conditional effects, non-linear effects or even null impact of resource wealth on civil conflict and ethnic violence,Footnote 11 the vast majority of empirical evidence generally supports the resource curse claim. Compared to country-level analyses, however, subnational evidence has been scarce in the literature. Most studies employing subnational information still make international comparisons, rather than within-country or within-region analyses.Footnote 12
While empirical evidence, at least based on country-level data, generally points to a negative relationship between resource endowments and peace,Footnote 13 the exact mechanism through which resource production affects civil conflict is not straightforward.Footnote 14 A general notion in the conflict literature is that economic growth reduces civil conflict as it increases the opportunity cost of participation in violent events.Footnote 15 Natural resources boost a country’s economy, which, in line with these studies, should reduce violence rather than increasing it. Yet, most studies have not found such evidence.
Three approaches address why the evidence drawn from resource-rich contexts conflicts with the general theory. First is an investment-side explanation. In theory, natural resource development and related investment should provide more economic opportunities. However, studies of natural resources raise the opposite possibility, that local employment may be restricted due to resource development. One of the well-known predictions of the ‘Dutch Disease’ is the crowding-out effect.Footnote 16 Resource development leads to a large influx of capital and consequently price inflation, and thus crowds out other industrial investments, resulting in de-industrialization, especially in volatile countries with weak institutions.
The second is a labor-side approach. As mentioned, the opportunity cost theory says that having a higher quality occupation limits the time allocation for any participation in violence.Footnote 17 In other words, the lack of an income source for a large population or for a particular social group is likely to lead to civil violence. More nuanced recent studies, however, claim that economic growth affects civil conflict differently depending on the labor-capital intensity of the commodities at stake.Footnote 18 They find that income growth in labor-intensive industries reduces conflict, whereas income growth in non-labor-intensive industries increases conflict. The production of oil, one of the least labor-dependent commodities, is thus likely to increase conflict behaviors according to this perspective.Footnote 19
The third approach evaluates the relationship from an institutional perspective. Fearon and Laitin argue that oil exporting countries are more likely to engage in civil war because they tend to have weaker state institutions than other countries with the same level of per capita income.Footnote 20 Following this logic, the effects of resources on conflict are confounded by the effects of institution quality; oil-rich countries capable of extensive distributive policies and public security expenditures tend to experience less conflict than oil-rich countries with weak state capacity.Footnote 21 As a result, in states with weak institutions, lootable resources provide larger incentives to rebel groups, especially separatist activists, as they increase the reward when the rebellion succeeds.Footnote 22
Finally, scholars have debated how ethnic, cultural and religious factors interact with natural resources in terms of political unrest. Ethnic, religious and cultural differences have long been a focus of the civil conflict literature, especially with regard to ethnic violence. According to Fearon, among the 709 minority ethnic groups in the study frame, at least 100 had members in an ethnically based rebellion against the state between 1945 and 1998.Footnote 23 Islam in particular has played a role in many long-lasting and ongoing civil conflicts according to Huntington, who makes reference to the ‘bloody borders of Islam’.Footnote 24 For this reason, cross-national studies often use the Muslim share of the population as a key control variable.Footnote 25 Fearon, however, cautions that other regional factors coincide with the presence of Muslim populations, and thus it is not certain whether Islam itself or another omitted variable embedded in the Middle East or North African regions generates these statistically significant findings.Footnote 26 Berman’s work, on the other hand, claims that religious beliefs can effectively provide organizational cohesion and justification for radical terrorists, especially those who rebel against a strong state force.Footnote 27 Recent subnational studies find that ethnic conflict is more likely occur in countries where oil-rich regions are populated by ethnic minority groups.Footnote 28 Moreover, Mähler and Pierskalla claim that high-value natural resources trigger the politicization of ethnic identity, leading to the intensification of social conflicts.Footnote 29
Despite the large volume of evidence that links natural resources to ethnic violence, numerous scholars continue to debate the relationship and to test the causal links with careful attention to detailed data. The major goal of this study is also to examine not just whether the general pattern of the resource curse holds within Xinjiang, but also to pin down the exact mechanism at work. With respect to the mechanisms, the case of Xinjiang potentially evokes all four mechanisms debated in the resource curse literature and theories on ethnic violence. Xinjiang’s recent development involves a large investment from outside, particularly from the central government under the Grand Western Development project in progress since 1999.Footnote 30 Resource development has brought new industries to the region and increased job availability for the local population as well as migrant laborers. The capability of local government has also been constantly under question, with increasing discontent and instability in the region. Furthermore, despite the recent improvement in economic conditions in general, the salience of ethnic tensions has intensified in the region. One salient distinctiveness between the previous studies and our study is that we emphasize the role of strong state possessing overwhelming military power in shaping the political economy of natural resources. In the following sections, we discuss the details of each mechanism in the context of Xinjiang, before moving on to the empirical examinations.
THE POLITICAL ECONOMIC CONTEXT OF XINJIANG
While the claims, evidence and implications of the existing literature vary, it is crucial to understand the idiosyncratic political and economic circumstances of Xinjiang to reflect on how the literature might apply. China is home to over 22 million Muslims, which is larger than the size of the Muslim population in Malaysia, and most reside in Xinjiang.Footnote 31 Since the 1990s, two conspicuous political and economic changes have coincided in Xinjiang. On the one hand, Xinjiang experienced an unprecedented increase in oil and natural gas production. Since 1999, as the Great Western Development project started, Xinjiang’s GDP per capita has surpassed the average per capita income of China.Footnote 32 On the other hand, since the 1990s, violent confrontations, particularly related to Xinjiang’s largest ethnic minority, the Uyghurs, have been much more frequent than in previous decades, making Xinjiang the most contentious region in China. In fact, other recent violent attacks in public places outside of Xinjiang have often been traced to individuals or organizations based in Xinjiang.
Generally speaking, however, Xinjiang is not the only autonomous region in China populated by ethnic minorities. Nor is it the only ethnic-minority autonomous region endowed with a large amount of natural resource reserves. Why, then, is Xinjiang particularly vulnerable to ethnic tensions, which have intensified into terrorist attacks against public sites including government buildings and religious places of worship, and even civilians, despite economic growth and increased security measures?
Popular beliefs on this matter fall into two camps. The first explanation is that ethnic tensions intensified as a function of relative economic deprivation. Many scholars have argued that not all citizens in Xinjiang have an adequate income. Some argue that politicized bureaucrats used the development campaign as a means to consolidate their hold on the party, rather than to enhance the broader wellbeing of Xinjiang residents.Footnote 33 Evidence points to job segmentation and discrimination existing between ethnicities.Footnote 34 Both state-owned enterprises (SOE) and Han private firms rarely hire Uyghurs as regular employees.Footnote 35 In particular, large-sized natural resource extraction that began in the late 1990s created a large influx of Han, and it is often said that Uyghurs have thus been marginalized in terms of economic opportunities. It is known that the PetroChina branches in Xinjiang predominantly hire Han migrants or migrate their current Han employees from the east.Footnote 36 This structure often leads Uyghurs to depend on less stable, often temporary, employment in small private firms, or on self-employment. In keeping with this argument, despite various efforts by the central government to counteract ethnic inequality, scholars have recently revealed that economic gaps and social cleavages between people of the Han and Uyghur ethnicities are substantial and generally increasing in Xinjiang.Footnote 37
Yet, the direction of grievances is not always clear in the discussion. The increase in large-scale infrastructure projects and resource industrialization tends to induce a rise in economic migrants, who likely have superior skills than the indigenous population. Therefore, the migration of highly skilled labor is not likely to encroach significantly on the local labor market, particularly that of ethnic minorities. At the same time, the inequality within the subset of Han migrants is also substantial and increasing: recent Han migrants also feel discontent, viewing themselves as underrated compared to early Han migrants who received large perks from the government as a compensation for their early relocation. For instance, Cliff discusses the employment scheme that existed in the oil SOEs in Xinjiang until 2000, under which the company guaranteed future employment for past and current employees’ children.Footnote 38 Those options are not available for recent Han migrants in most SOEs. Moreover, preferential programs targeting ethnic minorities do not assuage the discontent among the low-skilled, unprotected Han population. Institutionally, numerous policy programs exist in Xinjiang that are meant to benefit ethnic minorities, who are entitled to preferential treatment in family planning, college admissions, job recruitment and promotions, and representation in the legislative and other government bodies.Footnote 39 Fiscal transfers from the central government to local Xinjiang governments have been substantial, especially since 2001, when the central government introduced more generous inter-governmental transfers specifically targeting minority counties. Even in the five years prior to 2001, fiscal transfers from the central government to local governments in Xinjiang more than tripled, from RMB 5.91 billion in 1996 up to 18.4 billion.Footnote 40
Furthermore, studies focusing on inter-ethnic economic divergence often neglect potential economic spillover effects. While the existence of ethnic distinctions and job segmentation might be evident, this does not necessarily invalidate the possibility of broader economic spillover generated by the resource extraction industries. Rapid urbanization in Xinjiang due to resource development has certainly increased employment in Xinjiang, both for Hans and Uyghurs.Footnote 41 Moreover, natural resource companies work with multiple layers of contractors on a variety of tasks. Cliff notes that contractor employees constitute 60 per cent of the workforce, and three-quarters of the contractor companies are directly subordinate to the PetroChina operation in Xinjiang.Footnote 42 This indicates that the resource SOEs in Xinjiang in fact delegate a large volume of work to other smaller public or private firms, which are subordinate to the SOE but which also hire employees and run operations autonomously. This structure also suggests that a large proportion of Han workers in the resource industries are non-permanent, non-SOE workers, so they do not hold the privileges of SOE employees including high salary and generous welfare benefits.Footnote 43
Studies note the existence and the rise of Uyghur companies, some of which work in co-operation with Han companies.Footnote 44 Private Uyghur firms traditionally have had a comparative advantage in the retail food and logistics industries, as well as in commerce with neighboring countries.Footnote 45 Recent work by Harlan shows that some Uyghur entrepreneurs have broken out of the ethnic boundaries and established relationships with Han companies and government officials.Footnote 46 Bovingdon claims that violence declined sharply after 2001 because the government increased security controls and Uyghurs chose everyday forms of resistance rather than direct attacks on state and the Han.Footnote 47 In addition, the economic links between Xinjiang and the central government have become particularly strong in terms of investment, which serves as a major source of potential economic spillover. The central government’s investment in Xinjiang is approximately 60 per cent of total investment in the region, which is almost twice the national average (32 per cent). The state share of gross industrial output in Xinjiang is around 80 per cent, which again is much higher than the national average of 47 per cent.Footnote 48
Another common explanation hinges on the salient ethnic distinction between Uyghurs and Han Chinese, and the historical differences in their religions and cultures.Footnote 49 This distinctiveness has been further politicized with heavy state intervention in religious matters, such as restrictions on mosque access and religious gatherings.Footnote 50 While the government justifies this policy as an attempt to prevent social unrest that could threaten China’s territorial integrity, it is also the case that religious rituals are closely linked to the histories and identities of ethnic minorities in the region. According to this view, ethnic violence in Xinjiang is caused by mutual distrust and social discrimination based on the rigid ethnic boundary between the Uyghur and Han Chinese populations.Footnote 51 Conversely, the Chinese government has frequently stated that terrorist connections to Islamic insurgent groups active in conflicts in the Middle East are the main reason for the recent rise in ethnic violence in Xinjiang.Footnote 52 Some argue that Xinjiang’s connection to external insurgents began as early as the Soviet-Afghan war, as a number of young Uyghur males fought in conflicts related to the war and then returned to Xinjiang.Footnote 53 These statements further highlight the role of the ethnic and religious cleavage between the Uyghur population and the Han Chinese population, as well as the influence of external circumstances in increasing inter-ethnic tensions in Xinjiang.
However, the mechanisms that link ethnic and religious cleavages and external instabilities to physical violence have not been clearly analyzed to this point. What is more, studies increasingly show that religious sites in China play important social and economic roles such as public goods provision or resource reallocation, especially in rural areas.Footnote 54 Cao and coauthors show that mosques work as civic centers, providing necessary policy information and public goods to the community.Footnote 55
In line with this latter perspective, we claim that the mosques, at least the officially registered mosques that we measure in our dataset, while reflecting historical religious and ethnic identities in the area, are not likely to measure active organizational hubs of violent networks. The argument is closely related to the state capacity of China and the importance of the ethnic violence issue to regime stability. The Chinese government prioritizes political stability and has in general successfully minimized social contentions throughout the country.Footnote 56 In recent years in particular, the central government has increasingly stressed the importance of social stability, which also serves as a major criterion in the cadre evaluations of local political leaders.Footnote 57 Under these conditions, religious sites and activities are allowed only if they are part of normal religious activities, which typically implies that they are under close surveillance from the government. Tibetan Buddhism and Xinjiang’s Islamism have been under special surveillance for some time, given the longstanding contentious confrontations related to religious differences.Footnote 58 Officially registered mosques are thus highly likely to be monitored closely and even assumed to be allied with the Chinese government. In fact, our violence data show that several attacks targeted some of these registered mosques or their imams, which cannot be explained if the mosques are part of the network hub for violent organizations.
In short, while the general discussion of resource curse claims is relevant to our study, we note that the context of Xinjiang is considerably distinctive from other cases and from the global context. First of all, the institutional and physical capacity of the Chinese government is overwhelmingly larger than that of the ethnic minority activists or related organizations. Under the current leadership in particular, the government has also exerted an extensive effort to ensure social stability. We also argue that the crowding-out mechanism and the labor-intensity mechanism are not as strong as the economic opportunity mechanism in the case of Xinjiang, due to the lack of other competing economic opportunities in Xinjiang. In Xinjiang, the resource industries constitute the most rapidly growing industrial sector and they offer much higher payoffs compared to other available livelihood options such as agriculture and small business. We argue these factors make the economic opportunity mechanism, which much of the literature on natural resources discounts, is highly plausible in Xinjiang.
Moreover, this study aims to provide empirical answers to the competing theories and claims regarding Xinjiang’s circumstances. Although observers and researchers of Xinjiang have pointed to natural resource development in Xinjiang as one of the major contributors to the increasing tension between the two major ethnic groups in Xinjiang, a direct relationship among oil and natural gas development, religious and ethnic divergence, and their political economic consequences has not yet been systematically examined. By identifying locations of resource production, we examine the direct effects of resource extraction on various political, social and economic outcomes. We also investigate how longstanding cultural differences shape those effects. In the process, the Xinjiang case shows how resource abundance influences ethnic grievances and violence distinctively in a strong authoritarian state that prioritizes regime stability.
EMPIRICAL SPECIFICATION
Data and Variables
Estimating violent events in or related to Xinjiang is difficult, as many go unreported. In collaboration with other scholars, we have collected evidence of approximately 200 violent events within Xinjiang. The sources of this information include academic research by Bovingdon and Hierman, newspaper articles, and postings by activists.Footnote 59 Given the scarcity of data, we adopt a broad definition of violence. We define a violent incident as an incident where armed or collective action was taken by non-Han Chinese and non-state actors within Xinjiang. Frequent types of action include insurgencies, armed uprisings, armed attacks, riots, and bombings. While many events result in multiple deaths or injuries, we do not adopt any criterion for casualties, as much of the information necessary for doing so is not available or accessible. Using various sources, we collect all available violence information from 1949 till 2014, resulting in 186 violent events identified at the county level.Footnote 60
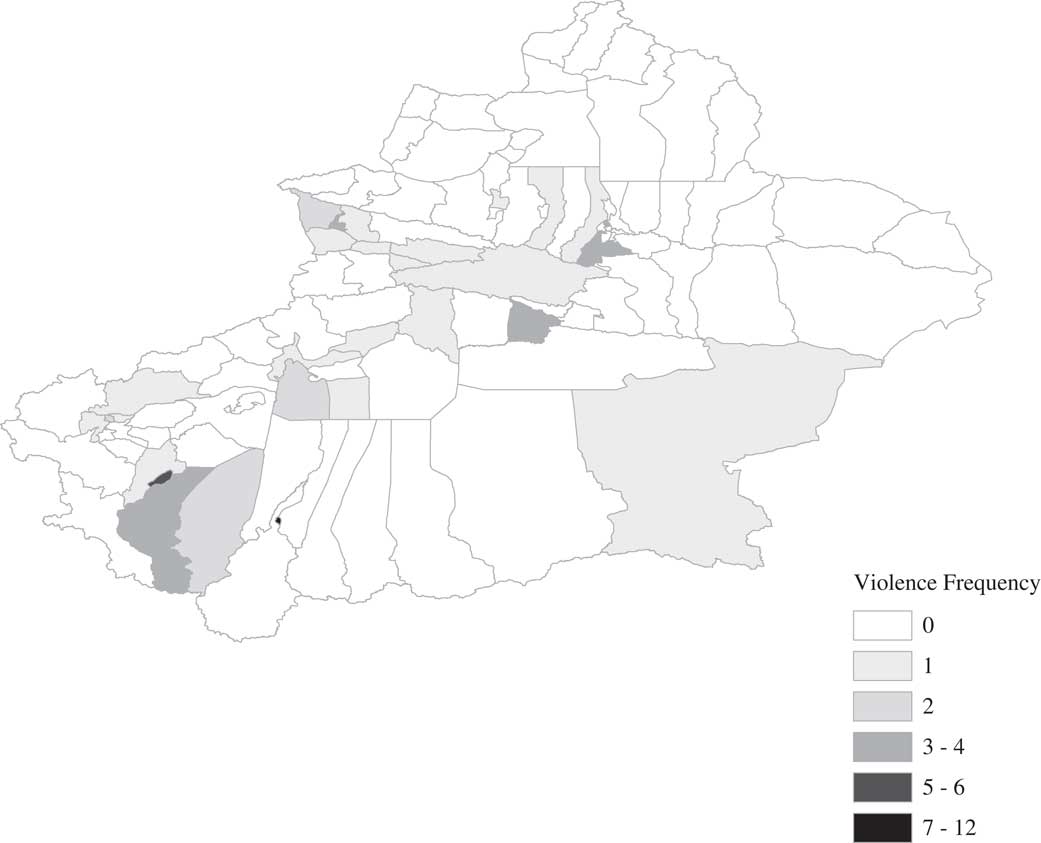
The data show that violent events are widely scattered across Xinjiang. It is also apparent from the data that the increase in ethnic violence corresponds to the period of expansive resource extraction in Xinjiang, and also to the period of escalating tensions among Middle Eastern countries, both of which have occurred since the late 1990s. Forty-two of the eighty-six counties in Xinjiang have experienced violence since 1998 (Figure 1 illustrates the distribution of violence between 1998 and 2005.). Figure A.2 shows that violent events occurred intermittently since 1949, increased in frequency in the late 1980s, and peaked in 1997. In 1999, the number of violent events decreased and then rebounded again in 2008, despite various preventative measures taken by the Chinese government.
Accumulated violence distribution (1998–2005) Notes: Accumulated violence refers to the total number of violent events in the period.

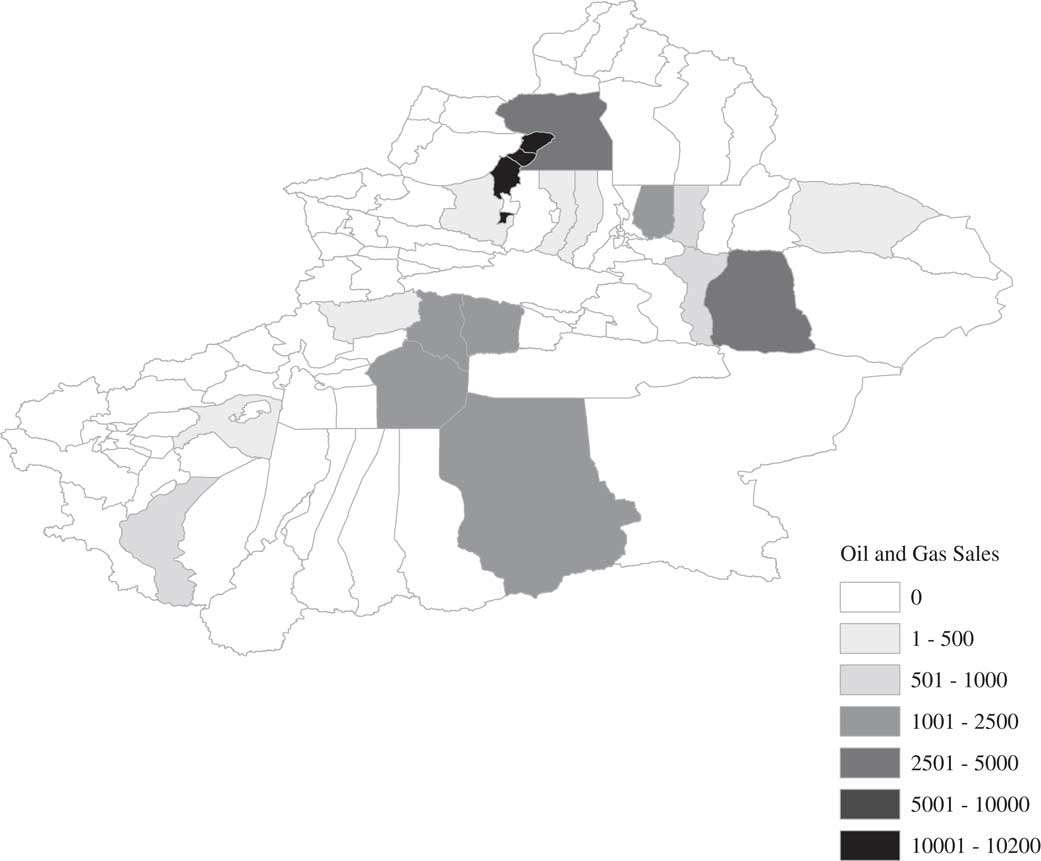
Xinjiang has vast reserves of natural resources, accounting for 22 per cent of China’s oil reserves and 28 per cent of its natural gas reserves. Since the late 1990s, China’s dependence on oil and gas production in Xinjiang has sharply increased: while in 2000, the quantity of oil and gas production from Xinjiang was 18 million tons and 3.5 billion m 3, respectively, by 2012 the numbers had increased to 27 million tons and 25 billion m 3. We collect detailed oil and gas production data from the China Oil and Gas Field Development Report, an official series of reports on all oil and gas fields in China. Each report covers one of twenty large oil and gas fields in China; there are three major ones in Xinjiang: Karamay, Tuha and Talim. The reports contain accounts of the history of each oil and gas field and data on its past and current status. These data include maps and production quantities of small oil and gas fields within large oil fields until 2005, which we have converted into digitized data for statistical analysis. Our period of observation ranges from 1998 to 2005 because of the availability of oil and natural gas extraction data. Figure 2 describes the distribution of oil and gas sales from 1998–2005.
Oil and gas sales (1998–2005) Notes: Oil and gas sales refers to accumulated oil and gas sales revenue in million RMB in the period.

Xinjiang had around 29,545 mosques in 1949.Footnote 61 The majority were then demolished or transformed to other uses during the religious reform and anti-feudalism campaigns of the 1950s and 1960s; prior to the Cultural Revolution, the number of mosques had already dropped to 14,119. Then, during the Cultural Revolution, a large number of mosques and other religious sites were destroyed as part of the campaign to purge the ‘Four Olds’. Only 2,930 mosques were left by the end of the Cultural Revolution. Starting in the late 1970s, when the religion policy was relaxed and economic conditions improved, many mosques were rebuilt. The number of mosques in Xinjiang reached 22,949 in 1990, an eightfold increase in less than two decades. Local governments expressed concern that the construction of mosques had exceeded acceptable limits and normal religious needs, and the construction of mosques was halted.Footnote 62 Since 1990, the total number of mosques has been stable, with approximately 23,900 operating in 2004. As of 2014, approximately 63 per cent of the mosques in China were located in Xinjiang, while only 1.6 per cent of the Chinese population resides there.Footnote 63 It is necessary to note, however, that the figures only reflect the officially registered mosques. Figure A.3 and Figure A.4 show trends in the number of mosques in the Xinjiang region over the last sixty years.
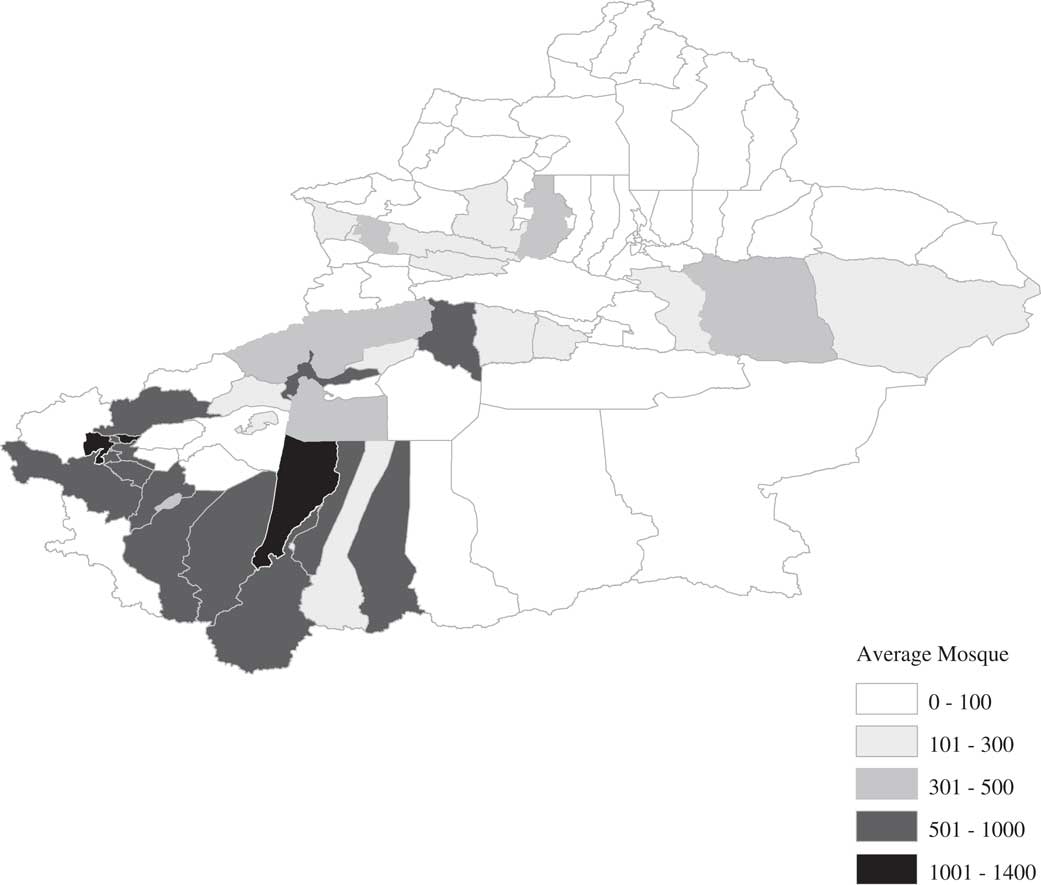
Detailed information on religious sites is collected from two sources. Time variant mosque data are incorporated from the China Data Online.Footnote 64 The raw dataset reports each mosque’s year of establishment, which enables us to report the yearly distribution of mosques. Figure 3 illustrates the distribution of mosques based on this dataset. The other source is the county gazetteers (xianzhi) of Xinjiang’s counties. Local gazetteers in China are published by local governments intermittently. The merit of this dataset is the availability of historical mosque data, tracing back to 1949 when Xinjiang was incorporated into the PRC. All counties in Xinjiang have published at least one gazetteer since 1949 except Pishan County, which has not yet published a gazetteer. The gazetteers contain information on the number of mosques including their long-term trends. We code the oldest and newest reports of mosques in each gazetteer, which yields the number of mosques surveyed approximately in 1949 and again in the 1990s.Footnote 65 Figure A.5 describes the distribution of mosques before 1949 and in the 1990s.
Number of mosques (1998–2005) Notes: Displayed number is average number of mosques within a county during the period 1998–2005.

We also control for the distribution of Xinjiang Production and Construction Corps (often called bingtuan). Bingtuan is a unique economic, administrative and semi-military government settlement structure in Xinjiang, broadly autonomous from the local government and inhabited since 1954. The major goal of bingtuan is agricultural settlement in the frontier areas and military protection of Xinjiang’s border.Footnote 66 Bingtuan was the major source of Han migration and cultural transformation in Xinjiang prior to the 1970s.Footnote 67 Now, with a population of approximately 2.5 million, bingtuan contains a strong presence of armed forces, including military and police autonomous from the local government to safeguard the borders, who together play a special role in reinforcing Xinjiang’s social stability.Footnote 68 Since the strong military presence and anti-terrorist measures taken by bingtuan may affect violence in the region, we control for the size of bingtuan in each county, measured by the proportion of the population residing in bingtuan.
Data on government performance are collected from Xinjiang Statistical Yearbooks. These yearbooks provide county-level data on various public goods and services, as well as government revenues and spending. We also incorporate economic variables such as local GDP, inflation indicators, unemployment rates and urbanization rates from the same source. The ethnic composition of each county is also collected from the statistical yearbooks. Government finance information is collected from National Prefecture and County Finance Statistics Compendium. Additional data on individual employment and income by ethnic groups are incorporated from the 2000 census and 2005 mini-census. All variables employed in our analyses are summarized in Table A.1. All data sources are listed in Table A.18 in the Appendix.
Empirical Strategy
In the empirical analysis, we focus on the effects of natural resource extraction on violent events in Xinjiang. To analyze the event count data, we employ a negative binomial model as the main specification.Footnote 69 Our main analysis is based on the following equation.
 $$Violence_{{i,t}} \, {\equals}\, Resource_{{i,t{\minus}1}} \beta\, {\plus}\,X_{{i,t{\minus}1}} \delta \,{\plus}\,G_{i} \lambda \,{\plus}\,y_{t} ,$$
where Violence is the outcome of interest. Resource refers to resource extraction, for which we use the logarithmic value of oil, natural gas and the sum of oil and natural gas sales revenue. We use a one-year lagged variable to prevent the possibility of reverse causality. For instance, we cannot rule out the possibility that a violent event reduces the quantity of resource production if we use observations from the same year for violent events and resource extraction.
To minimize the effects of confounding factors that might affect our dependent variables, we control for demographic and geographic factors such as the share of the population that is Uyghur, population density, distance to borders, and terrain.Footnote 70 We also include economic variables such as the level of economic development, government revenue size, and the size of transfers from the central government, where no concerns about multicollinearity or overestimation exist.Footnote 71 To summarize, X i,t−1 is a vector of control variables, which includes the Uyghur share of the population, population density, GDP per capita (log), local government revenue (log), special grants from the central government (log), and the population proportion of bingtuan. G i is a vector of time-invariant geographic variables including distance to the border and the average slope of each county. Time-variant confounding variables are also lagged one year due to the concern of reverse causality. Finally, to explain the yearly trend, we also include year fixed effects.
Although controlling for confounding variables is necessary to estimate the impact of oil and gas production, it is worth noting that controlling for variables that are also affected by oil and gas production may result in a masking effect.Footnote 72 For instance, if oil production increases both conflict and per capita income, including per capita income as a control variable will produce a biased result for the true effect of oil production on conflict. To address potential bias due to overcontrolling, we report results from analyses with and without those economic control variables.
We also test the conditional effects of religious sites to examine whether the effects of resource extraction differ when a county is religiously and culturally distinctive.
 $$\eqalignno{ Violence_{{i,t}} \, {\equals}\, & Resource_{{i,t{\minus}1}} \beta _{1} {\plus}Mosque_{{i,t{\minus}1}} \beta _{2} {\plus}\left( {Mosque_{{i,t{\minus}1}} {\times}Resource_{{i,t{\minus}1}} } \right)\beta _{3} \cr & \quad X_{{i,t{\minus}1}} \delta {\plus}G_{i} \lambda {\plus}y_{t} , $$
where Mosque i,t−1 is the mosque density (mosque/area) in each county. We alternatively use the number of mosques normalized by the population size (mosque/population) as a robustness check. β 3 denotes the interactive effects of resources and religious sites.
We additionally use an instrumental variable approach, since religious sites are long-term cultural features that cannot be eradicated or expanded for political or economic reasons in a short period. In this regard, we use the 1949 mosque data as an instrument to examine the recent distribution of mosques. As stated earlier, by using this approach, we can effectively avoid an endogeneity problem if CCP rule and subsequent violence within Xinjiang counties affected the distribution of mosques in the later period. We use two-stage least square (2SLS) estimates to estimate the impact of the presence of religious sites on the onset of violent events.Footnote 73 The number of mosques before 1949 is used as an instrument for the number of mosques in the 1990s in the first stage, with and without other county characteristics. In the subsequent results section, we discuss the issue of exclusive restriction in detail.
To understand the channels through which resource extraction affects the odds of violence, we also analyze whether resource production affects the political economic factors that have been cited as relevant to social violence. Resource extraction may affect the probability of violence by, for instance, changing income levels, transforming demographic composition or affecting the quality of government administration. For the mechanism analysis, we estimate the following equation, using a GLS model employing county and year fixed effects and standard errors clustered at the county level.
 $$y_{{i,t}} \, {\equals}\, Resource_{{i,t{\minus}1}} \beta \, {\plus}\, X_{{i,t{\minus}1}} \delta\, {\plus}\, G_{i} \lambda\, {\plus}\, y_{t} \, {\plus}\, {\varepsilon}_{{i,t}} ,$$
where y it are the outcome of interest, which includes three sets of political economic variables: security spending of the local government, ethnic demographics, and GDP per capita and employment rate.Footnote 74 β is our estimate of interest, which indicates the impact of oil production in county i in year t−1 on the outcome variable in t.
Empirical Findings
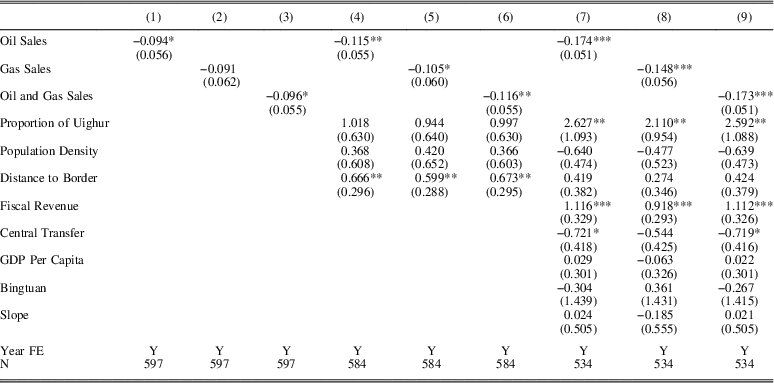
Table 1 presents the main findings of our empirical analyses. Figure A.1 illustrates the predicted probability of violence when a county benefits from oil or natural gas sales. Table 1 shows whether oil and/or gas production are associated with a larger number of conflicts within a county. Many scholars of conflict have argued that resource wealth is positively related to conflict occurrence and duration.Footnote 75 Given the increasing number of conflicts and expanding resource development in Xinjiang, reporters and scholars have thus argued that resource development contributes to increasing grievances and violence in the region.Footnote 76 Contrary to that perspective, we find that oil and gas development does not exacerbate the intensity of ethnic violence. Rather, oil and gas extraction are likely to reduce the intensity of violence, and oil and gas production and sales also reduce the frequency of violent events, controlling for other factors. Comparing oil and gas, the impact of oil is more apparent in the data, potentially as a result of the size and distribution of oil and gas production: although natural gas production has increased sharply in Xinjiang, the quantity of oil production is much larger within the period of our analysis. Furthermore, while oil production sites are widely scattered within Xinjiang, gas production is concentrated in the northern oilfields, particularly Karamay oilfield.Footnote 77
Natural resource extraction and ethnic violence

Notes: Regression results are based on negative binomial model. Robust standard errors clustered at the county level are in parentheses. All time variant variables are lagged one year. All variables except population density, proportion of Uighur, slope and bingtuan are logarithmic values. Estimates of constant and year fixed effects are not reported. * p<0.1; ** p<0.05; *** p< 0.01.
Among the control variables, we find several outcomes that contradict conventional wisdom. First, a higher proportion of Uyghurs in the county population is not linked to a higher probability of ethnic violence, contrary to what is often argued. Special transfers from the central government are not associated with the frequency of violence. The revenue of the local government in the previous year appears to have a significant impact on violent events, although caution is necessary in the interpretation because of the potential endogeneity issue between economic production, natural resource extraction and government revenue. The share of the population residing in bingtuan does not have a significant impact on violence in any of our analyses.
One critical issue to address is the endogeneity of resource production. While the locations of natural resources are exogenous, production is not. Resource producers in Xinjiang may approach relatively safer places, avoiding extraction activities in more contentious area. If this is the case, a concern of reverse causality emerges as one may argue an anticipation of low violence in the future increases current production. Lagging explanatory variables for a year reduces this concern to some extent, but not entirely. It could be the case that the expectation of violence itself drives the production decision.Footnote 78
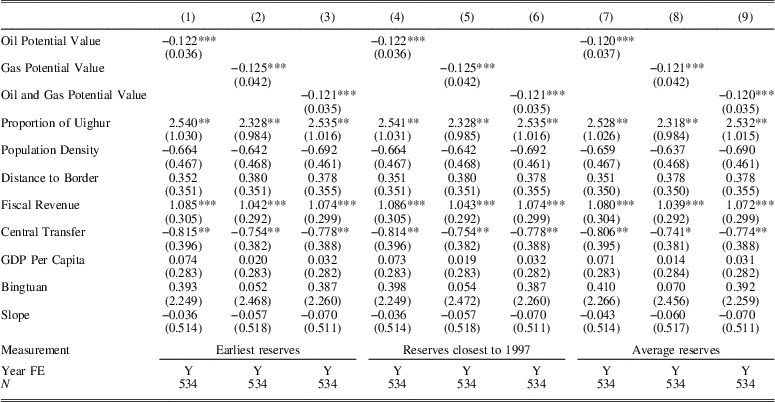
To address the endogeneity concern, we collect oil and gas reserves data from the China Oil and Gas Field Development Report. Reserves, by definition, do not change year by year, unlike production quantity. While this is broadly true in our dataset, as Xinjiang’s oilfield underwent drastic development during the period of our research, we find a few oilfields which reported new or additional reserve discoveries during the period. To address changes in the quantity of resource reserves, we construct three oil/gas reserve variables: the earliest oil/gas reserve, oil/gas reserve closest to the year 1997 and the average oil/gas reserve. We use both reserve quantity and the current value of reserves (reserves × current price) as independent variables. We use domestic oil and gas prices to calculate potential sales. Table 2 (potential sales) and Table A.2 (reserves) both indicate that resource endowments measured by reserves have negative effects on violence. Different timing of the reserves measurement does not make any substantive difference in the statistical results in either table.
Oil/gas potential value from reserves and ethnic violence

Notes: Regression results are based on negative binomial model. Robust standard errors clustered at the county level are in parentheses. All time variant variables are lagged one year. All variables except population density, proportion of Uighur, slope and bingtuan are logarithmic values. Estimates of constant and year fixed effects are not reported. * p<0.1; ** p<0.05; *** p< 0.01.
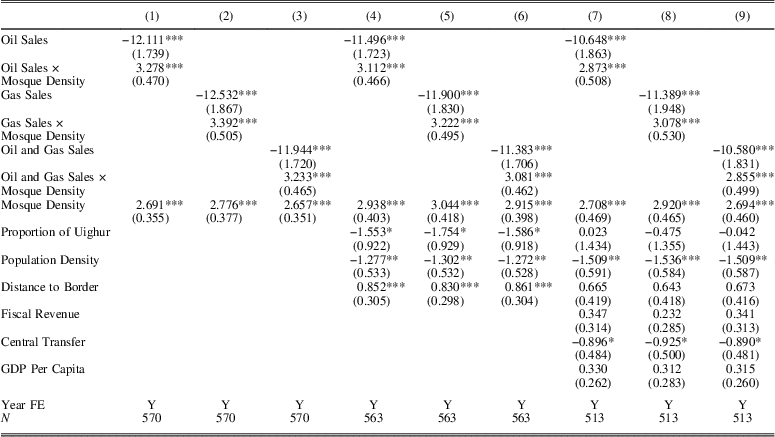
We then examine whether the soothing effects of resource production on violent events are conditional on historical and religious features of areas in Xinjiang. The results presented in Table 3 indicate that the presence of a large number of mosques increases the probability of ethnic violence. More importantly, we find that the mitigating effects of natural resource extraction subside with the number of mosques in a county. An interpretation of the interaction term in Model (9) indicates that when the number of mosques within a county exceeds approximately 550, the soothing effects of oil and gas production disappear. Given that the average number of mosques is 220 and the standard deviation is 280 in our data, the results indicate that the tempering effects of resource extraction disappear when a county has more mosques than one standard deviation above the mean. Indeed, as the Figure 3 in the Appendix illustrates, a few counties, predominantly in southeast Xinjiang – Kizilsu Kirghiz Autonomous Prefecture and Kashgar Prefecture, in particular – have a very high number of mosques as well as a notable degree of ethnic violence.
Natural resources, mosques density (mosque/area) and violence

Notes: Regression results are based on negative binomial model. Robust standard errors clustered at the county level are in parentheses. All time variant variables are lagged one year. All variables except population density, proportion of Uighur, slope and bingtuan are logarithmic values. Estimates of slope, bingtuan, constant and year fixed effects are not reported. * p<0.1; ** p<0.05; *** p< 0.01.
Given these distinguishing features specific to certain prefectures, one may question whether our findings are driven by unobserved omitted variables underlying each prefecture’s distinct historical and cultural background. To address this possibility, we reanalyze the statistical equation used in Table 3 with prefecture fixed effects (Table A.13 in the Appendix). We confirm that the negative effects of natural resources prevail, with a larger coefficient than in Table 3. We also test whether our definition of mosque prevalence drives the result. The robustness check using mosques per population confirms the previous findings that the mitigating effects of resource production on violence diminishes when the density of Muslim religious sites is high in a county (Table A.3).
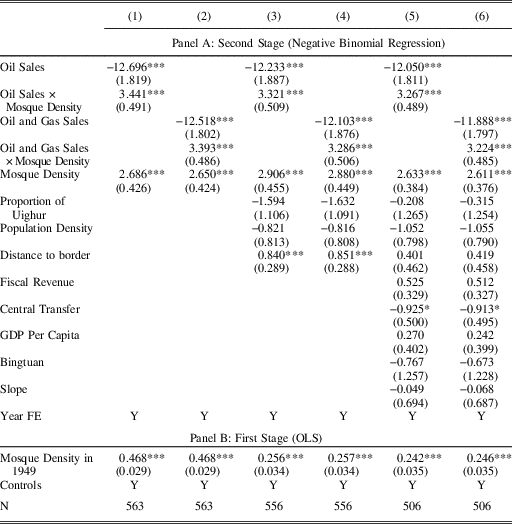
To understand what the mosque density within a county represents, we conduct an instrumental variable analysis using mosques prior to 1949 as the instrument. The main purpose of this approach is to prevent the possibility of a reverse causality story in which the occurrence of ethnic violence and the PRC’s ethnic and religious policy since 1949 have shaped the current distribution of religious sites. Using this approach, we can effectively argue that the current distribution of mosques reflects the long-lasting culture and religion of the area. Table 4 presents the results from a two-stage regression model, employing negative binomial regression at the second stage regression. The results confirm the findings in Table 3. The presence of a high density of mosques in the 1990s, instrumented by the mosque density in 1949, counters the soothing effects of oil and gas production. When a county is historically distinctive in terms of religious culture, it is more likely to experience violence in the current period.
Natural resources, mosque density and violence (instrumental variable analysis)

Notes: Regression results are based on negative binomial model. Robust standard errors clustered at the county level are in parentheses. All time variant variables are lagged one year. All variables except population density, proportion of Uighur, slope and bingtuan are logarithmic values. Estimates of constant and year fixed effects are not reported. * p<0.1; ** p<0.05; *** p<0.01.
For our instrument to be valid, it needs to satisfy the exclusion restriction assumption, beyond being significantly correlated with current mosque density. As Sovey and GreenFootnote 79 emphasize, the plausibility of the exclusion restriction depends on argumentation and there is no empirical test that can assure the restrictions hold in a design. As we do not use a randomized or natural experiment, we should provide theoretical support to satisfy the exclusion restriction. Theoretically, we note that because almost all mosques were physically destroyed during the Cultural Revolution as Figure A.3 and Figure A.4 show, it is unlikely that the pre-PRC existence of mosques has affected current violence through any other mechanism than reflecting a clear Muslim culture and history before the communist era, which has likely been sustained better than in other areas through the communist period. Our theorization of the exclusion restriction is similar to that of Tsai’s.Footnote 80 The author employs the existence of temples before 1949 to instrument for the current existence of a temple manager in a community, using the same justification for the instrument.Footnote 81
Empirically, we need to rule out other alternative channels through which the 1949 mosque density may have affected violence today. If our logic is correct, we should see that the instrument is significantly associated with current mosque density, but not with other potential mediators. We implement three falsification tests using alternative religious sites (churches and temples), school density (primary and middle schools) and governance (the number of government employees and fiscal expenditures). First, we perform a falsification test for the historical social capital argument that historically religious areas contain a culture where the residents interact and co-operate actively in general, not necessarily through a particular religion represented by mosques. We use other religious sites such as churches and temples to test this possibility. Column (2) in Table A.4 rejects this possibility. Relatedly, we test whether the historical Islamic culture was inherited through more generous or more stringent social welfare provisions. We use the number of primary and secondary schools normalized by the population to measure public good provisions. Columns (3) and (4) in Table A.4 show that the current distribution of schools is not statistically related to the historical distribution of mosques. Finally, we examine the possibility that historical distinctiveness in culture and religion facilitates current violence by reducing the penetration of local governance. To measure governance, we employ the budgetary expenditures of the county government per population and the number of government employees normalized by the size of the local population. Again, the last columns of Table A.4 show that the governance measures are not associated with the historical distribution of mosques.
It is noteworthy that we do not interpret these results as suggesting that mosques serve as a network hub for violent actors, as previous studies do.Footnote 82 Our mosque data only include officially registered mosques, which are more likely closely monitored by the government. Instead, we interpret the presence of mosques as a proxy for longstanding historical and cultural distance between the area and the rest of the PRC. This interpretation motivates the use of pre-1949 mosque data, which reflects pre-PRC culture in the area, but not the post-PRC network establishment that may affect the current distribution of ethnic violence. In other words, mosques, at least as measured by this study, are unlikely to provide the physical location to establish terrorist networks or to solve collective action problems among minorities.
Mechanism Analyses
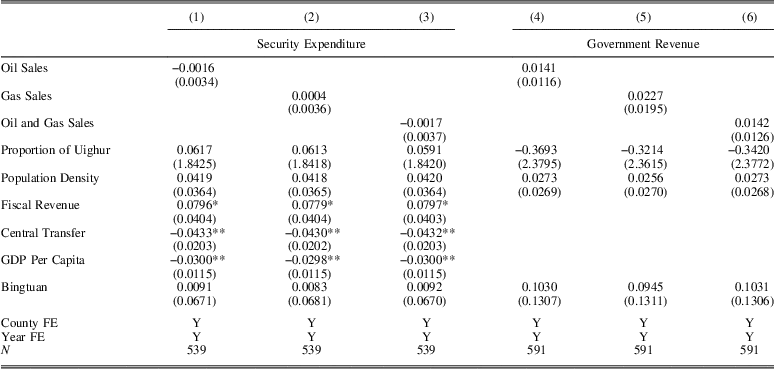
So far, we have indicated that resource extraction soothes ethnic violence. How does it work? The first mechanism we test is local government finances, in particular local expenditures for public security. It is possible that resource extraction provides an expanded source of government revenue collection and reshapes local government finances. To investigate this mechanism, we use GLS regression employing both county and year fixed effects, with robust standard errors clustered at the county level. In particular, we focus on the effect of resource production on local government expenditures for public security, which is closely related to the local government’s repressive power. Models (1)–(3) in Table 5 reject this possibility: no significant relationship is found between resource production and government security spending. We also find that government revenue is also not significantly influenced by oil and gas extraction (Models (4)–(6)).
Mechanism I: public security expenditure

Notes: Robust standard errors clustered at the county level are in parentheses. All time variant variables are lagged one year. All variables except population density, proportion of Uighur, and bingtuan are logarithmic values. Estimates of constant, county fixed effects and year fixed effects are not reported. * p<0.1; ** p<0.05; *** p< 0.01.
The lack of detailed data limits us from further investigating these null findings. The null finding on government revenues may result from the fact that the local governments of Xinjiang do not need to exert excessive effort to maximize revenue collection. In autonomous regions such as Xinjiang, Tibet and Ningxia, where the challenge lies in maintaining stability, local cadres face less pressure for fiscal extraction.Footnote 83 It might be the case that the revenues from oil and gas extraction are not shared by the local governments, as the oil and natural gas companies are state-owned enterprises (SOEs). Our finding that public security spending is not systematically linked to resource production implies that the reduced probability of ethnic violence in resource-rich counties does not reflect tightened security. We also examine whether specific types of government expenditure increase due to oil production. We find no evidence that oil or gas extraction increases specific local government expenditures; no evidence is found in regard to enhanced social welfare, education or infrastructure construction.
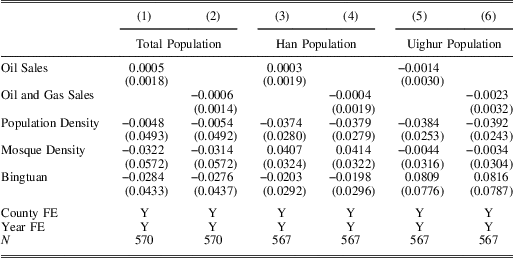
Table 6 presents estimates from demographic analyses. It shows that oil and gas extraction do not induce a statistically significant population influx from outside into the resource-producing counties. Several observers claim that resource production offers jobs mainly to non-local Han ethnic group members, inducing substantial immigration from outside into resource cities. Our findings do not support this argument, as neither the Uyghur nor Han populations increase in oil and gas producing areas.Footnote 84 We also examine ethnic fractionalization and polarization, which the literature suggests is closely associated with ethnic violence.Footnote 85 We find that resource extraction does not affect either measure of ethnic composition.
Mechanism II: ethnic composition changes

Notes: Robust standard errors clustered at the county level are in parentheses. All time variant variables are lagged one year. All variables except population density, proportion of Uighur, and bingtuan are logarithmic values. Estimates of constant, county fixed effects and year fixed effects are not reported. * p<0.1; ** p<0.05; *** p< 0.01.
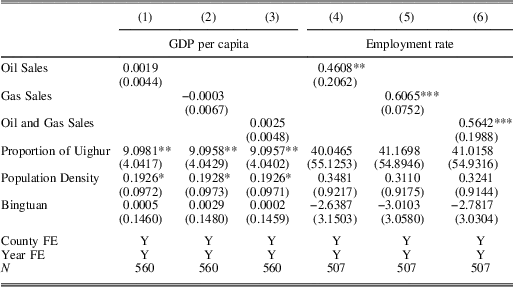
Finally, we test the impact of resource extraction on the local economy. In previous cross-national analyses, natural resources, especially crude oil, have been argued to hamper economic growth in the endowed country.Footnote 86 Yet, a subnational study in China by Hong finds that oil production clearly increases local GDP.Footnote 87 In the case of counties in Xinjiang, our finding is less conclusive. Models (1) to (3) in Table 7 show that county economies in Xinjiang do not clearly benefit from oil and gas industries. Part of the reason may lie in the industrial structure of Xinjiang’s oil industry, particularly during the period of our observation. Oil and gas industries in Xinjiang are mostly an upstream industry; companies produce crude oil and send it outside the province for downstream refinery and processing. While upstream industries are certainly profitable, even larger profitability often comes from the petrochemical processing after the crude oil extraction. What, then, is the benefit that goes to the residents of Xinjiang? Indeed, a concern pervasive in relation to Xinjiang is that the natural resource boom in Xinjiang may not actually benefit the residents there. Models (4) to (6) in Table 7 partially respond to this question. The dependent variables in these analyses are employment rates. We find that oil and gas production lead to a larger number of jobs and a higher employment rate. A 1 per cent increase in oil and/or gas extraction leads to a 0.5 per cent to 0.6 per cent higher employment rate. These findings to some extent reject the expropriation argument that the oil and gas producer simply extracts natural resources without contributing to the local economy.
Mechanism III: economic opportunity

Notes: Robust standard errors clustered at the county level are in parentheses. All time variant variables are lagged one year. All variables except population density, proportion of Uighur, and bingtuan are logarithmic values. Estimates of constant, county fixed effects and year fixed effects are not reported. * p<0.1; ** p<0.05; *** p< 0.01.
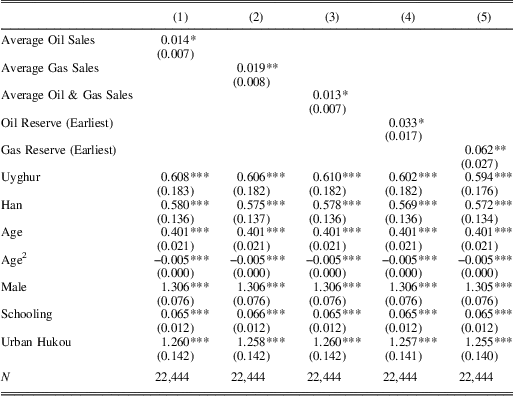
To examine the robustness of the economic opportunity mechanism, we collect additional data to test the positive link between natural resource development and employment. Despite the scarcity of data reflecting micro-level employment and income, particularly by ethnic group, we find suggestive evidence supporting the claim that resource industries contribute to enhancing local economic opportunities, not only to Han residents but also to Uyghur workers, although to a lesser extent. The China 2005 1 % Population Intercensus Survey (the 2005 mini-census, hereafter) provides the most detailed and high-quality information on individual employment and income in Xinjiang.Footnote 88 First, we investigate whether individuals are more likely to be employed when a county produces larger quantities of oil or natural gas. Using the sample of 22,444 survey respondents in Xinjiang, we find a clear positive link between resource production in the period 1998–2005 and an individual’s employment in 2005 (Table 8). The findings are consistent through different measures of resource production, including the quantity of proven reserves.
Natural resources and individual-level employment

Notes: Regression results are based on logit model. Robust standard errors clustered at the county level are in parentheses. Income, oil sales, gas sales, oil reserves, and gas reserves are logarithmic values. Estimates of constant is not reported. * p<0.1; ** p<0.05; *** p<0.01.
We then test how natural resource development affects the level of individual income in general and by ethnic group. In analyzing income, we distinguish between SOE employees and workers in private firms. If our argument is correct, that resource-related industries improve individuals’ economic opportunities, the SOEs, rather than private firms, are more likely to have positive impacts when resource production increases, as the main producers of oil and natural gas are all SOEs in Xinjiang. The results in Table A.5 show that resource endowments and production increase SOE employees’ individual incomes, but they do not affect workers’ incomes in private firms. More interestingly, the positive impact of resource production on SOE employees’ incomes is not limited to the Han population. Although the size of employment in SOEs is smaller for the Uyghur population, the positive effect of resource production on the income of Uyghur SOE workers is evident and the size of the effect is also similar.
In addition, we conduct county-level employment rate analyses using the 2005 and 2000 census data; we use the difference between the employment rate in 2005 and that in 2000 as the dependent variable and average resource revenues from 2000–2005 as independent variables. Analyses presented in Table A.6 are drawn from the county population census. Table A.7 is based on individual census data merged to the county level by the authors to evaluate the change in employment by ethnicity. Results shown in both tables generally reconfirm the positive economic effects of natural resources. Analyses by ethnicity show that resource sales between 2000 and 2005 improve the employment of Uyghur residents more significantly than they do the Han population.
Due to data limitations regarding individuals’ ethnicity and other characteristics, we cannot confirm whether the findings on ethnic minorities are causal. It is worth noting that the minority population benefiting from the resource industries is small, as the size of Uyghur employees in the SOE in Table A.5 suggests. This may indicate that the majority of the population does not experience any improvement in economic conditions. Nevertheless, these analyses suggest that the benefits of resources may be able to be generally shared, as they are not by design restricted to certain ethnic groups.
Robustness Checks
To examine the robustness of our finding, we perform various statistical tests reported in this section. The detailed results of the robustness checks are available in the Appendix.
One assumption in our analysis is the spatially specific effects of resource production. While the setting largely overcomes this concern in that the county is normally the basic unit of administration and public affairs in China, inter-county effects or spillover effects are not entirely impossible. For instance, resource production may intensify inter-county inequality, resulting in increased inter-ethnic grievances and thus violent incidents in neighboring counties rather than in the producing county. We examine potential neighbor effects using spatial lags. Table A.8 presents results from analyses where we employ resource sales of neighboring counties as the independent variable. We find no significant effects of natural resources produced in neighboring counties on a county’s probability of having a violent event. These analyses demonstrate that the effects of resource development are indeed spatially identifiable. Furthermore, the results suggest that while resource production deters violence within resource-producing counties, the spillover effect is limited. Table A.9 additionally examines whether violent events occurring in neighboring counties affect the level of violence. We find no evidence supporting a spatial spillover effect of violence.
We, then, employ alternative measures, statistical models and data to test whether our findings are driven by our choice of measures for analysis. To this point, we have used the logarithmic value of resource sales revenue aggregated at the county level as the independent variable. Ross strongly recommends using per capita income from natural resources to measure oil wealth, and a large number of studies have adopted his measure. Following the suggestion of Ross,Footnote 89 Table A.10 in the Appendix presents the results from analyses using this alternative measure of local resource wealth, per capita rents from natural resource production. We confirm that the per capita measure of resource wealth does not change our findings.Footnote 90
In addition, to minimize the possibility that our violence data collection process drives the findings, we employ an alternative dataset recently compiled by another group of scholars, titled Ethnic Violence in China database (EVC, hereafter).Footnote 91 The EVC data set reports two sets of violent events: Violence I indicates violent events identified at the county level, while Violence II includes violent incidents identified at the prefecture level in addition to Violence I. While our dataset contains fifty-six violent events from 1998 to 2005, the EVC data report fifty-two violence I events and sixty-two violence II incidents during the same period. Despite the minor differences, Table A.11 confirms that our main findings hold using the alternative dataset. We test both violence measures provided by the EVC data, employing both negative binomial and logit models.
We also investigate alternative empirical specifications. First, we test the logit model using the binary indicator of violence in each year. The findings remain the same in the logit estimates, which provide a more stringent specification than the event count model (Table A.12). In addition, we implement the prefecture fixed effects model to address the unobservable prefectural differences within Xinjiang.Footnote 92 Table A.13 replicates the main analyses of Table 1, Table A.2, Table 3, and Table 4, showing that unobservable features specific to a prefecture do not drive our findings.Footnote 93
Another concern in our empirical analysis may be serial correlation. The current level of violence may be closely related to violence in the past. This issue is also related to our empirical strategy of lagging independent variables by one year, as the production volumes in two consecutive years are generally highly correlated. To address the concern of serial correlation in event count data, we adopt the population-averaged negative binomial analysis using the GEE (generalized estimating equation) model suggested by Cameron and Trivedi.Footnote 94 In Appendix Table A.14, the analyses using population-averaged GEE specification show that oil sales and gas sales are negatively and significantly related to violence after addressing the potential serial correlation issue, consistent with the main results.
We also test whether the negative relationship between resources and violence is driven by short-term changes in resource production that are not consistent with longer term patterns, by employing a cross-sectional model. Our analysis reflects how year-to-year changes in oil or gas sales affect the level of violence within a county. However, a short-term year-to-year trend may not be consistent with the long-term equilibrium outcome. In other words, it is possible that the existence of oil and gas, linked with fluctuation in resource prices, may increase violence in the long run, which a short-term analysis may not capture. To address this concern, we employ a cross-sectional analysis using average and total oil and/or gas sales in each county and total violence during the period. Table A.15 shows that the results from a cross-sectional analysis are consistent with our main findings. Both average and total oil sales significantly reduce violence. Similarly, oil and gas sales are significantly and negatively linked with violent events.
In addition, we investigate the possibility of a non-linear relationship between natural resources and violence as a robustness check. The findings in Table A.16 in the Appendix provide evidence that the effects of resources, particularly those of oil, are negative but non-linear: as oil production increases, the marginal negative impact becomes smaller. Nevertheless, the vertex occurs when oil sales (log) equal approximately 11, while the average level of oil sales is 2 and the standard deviation is 7.8. The test of non-linearity thus confirms that the overall negative impact of oil is robust over most ranges of oil production, although the tempering effects of oil appear smaller in the largest oil producing counties in Xinjiang.
CONCLUSION
In this article, we examined how natural resource development contributes to violent ethnic confrontations in Xinjiang, China, where a strong government has a large stake in the stability of the region. We provide evidence contradicting the resource curse claim: our county-level analyses show that increases in oil and gas production lower the probability of violent incidents. This finding suggests that, unlike the vast literature supporting the resource curse in regards to violence, resource abundance in states with strong state capacity, where the state has a strong incentive to ensure political stability, may shape ethnic violence differently.
On the other hand, we find evidence that the mitigating effects of natural resource abundance decrease in places where the density of mosques is historically high. An instrumental variable approach also indicates that counties that had a higher density of mosques before the inclusion of Xinjiang in the PRC in 1949 experience smaller benefits in terms of the soothing effects of resource extraction. This finding suggests that the violence in Xinjiang is indeed embedded in longstanding historical, cultural and religious cleavages. Nevertheless, our estimates show that the soothing effect of resource extraction exists in most counties except for a few counties with exceptionally high mosque density.
Our mechanism tests show that oil and gas production promotes local economic opportunities in places where otherwise limited opportunities have been available as income sources. In particular, resource production helps the local economy, mainly through increasing the local employment rate and the individual incomes of SOE workers. Importantly, however, oil and gas production is not statistically related to drastic population increases or changes in local ethnic composition. Specifically, we find no clear evidence that an influx of Han Chinese is associated with increasing resource production. We also find no evidence that resource-producing counties exert more budgetary efforts to enhance public security.
A couple of noteworthy caveats should be addressed. One concerns data availability. As a pioneering attempt to systematically assess the causes of violence in Xinjiang, this study relies solely on official statistical data, except for the violence data that are not publicly available. Due to the lack of detailed systematic data, we only conduct limited analyses of inter-ethnic differences in employment and income from oil and gas production. For instance, data on salaries, the ethnicities of employers, and the employment status of Han workers versus Uyghur workers in the mining sector in Xinjiang would help to illuminate possible ethnic discrimination in the labor market, which other studies have pointed to as an important source of ethnic tension.Footnote 95 Furthermore, in spite of our and other scholars’ efforts, we should admit inevitable limitations in our violence data due to highly limited access to the real distribution of violence in Xinjiang.
The other caveat is that our study does not provide much evidence on what causes the fluctuation in Xinjiang-related violence. While our analyses largely provide countering evidence to the resource curse claim, it is unclear what has driven the sharp changes in violent events for the past two decades, a period during which resource production has consistently increased and the distribution of religious sites has been stable. In addition, while we currently observe violent events less frequently compared to the late 1990s, we find that ethnic tensions remain high or have even been exacerbated in Xinjiang. These trends require further investigation regarding various socio-economic changes and the influence of external armed conflicts in countries adjacent to Xinjiang. Due to limited data access, it is possible that we are omitting a number of factors or mechanisms that may affect violence in Xinjiang. As our study represents one of the pioneering studies employing systematic data to study this region, many questions remain unanswered. We leave alternative mechanisms to be explored in future research.