


Introduction
Several authors have published discrete-element models describing sea-ice dynamics in the marginal ice zone (MIZ) (e.g. Reference Shen, Hibler and LepparantaShen and others, 1987; Reference Hopkins and HiblerHopkins and Hibler, 1991; Reference Gutfraind and SavageGutfraind and Savage, 1997). The use of discrete-element models in a predictive capacity demands confidence in the model and the methodology (Reference RapaportRapaport, 1995), which is gained through empirical validation. With respect to the discrete-element models of the MIZ, this requires detailed measurements of ice-floe kinematics.
An experiment was conducted in the Ross Sea MIZ on 24−25 January 1999, to measure the kinematic behaviour of individual ice floes using global positioning system (GPS) receivers, triaxial accelerometers and magnetoresistive compasses. Similar experiments have been performed in the Greenland Sea MIZ (Reference Martin and BeckerMartin and Becker, 1987), the east Arctic MIZ (Reference Martin and DruckerMartin and Drucker, 1991) and the Labrador Sea MIZ (Reference McKenna and CrockerMcKenna and Crocker, 1992). The main difference between these experiments and the current one is the use of GPS receivers.
The experiment was conducted from the research vessel Nathaniel B. Palmer, using buoys constructed at Industrial Research Limited, New Zealand. The buoys were designed to be attached to an ice floe and to transmit data continuously during the experiment.
An analysis of the data obtained from this experiment revealed a periodicity in the GPS displacement data that coincided with a peak in the power density spectrum of the accelerometer data. This result suggests that the GPS receivers may be used to detect and measure the kinematic behaviour of ice floes on the time-scale of ocean-wave forcing.
Experiment
The site of the experiment was a region of the MIZ (approximately 68.6° S, 134.7° W) that contained clusters of ice floes. Within each cluster the areal concentration of the ice floes was quite high (70−80%), but between the clusters the concentration was low (10−20%). During the experiment the wind speed was 10−20 kts (18−37 km h-1) and the swell was small (0.5−1.0 m) with a period of approximately 11 s.
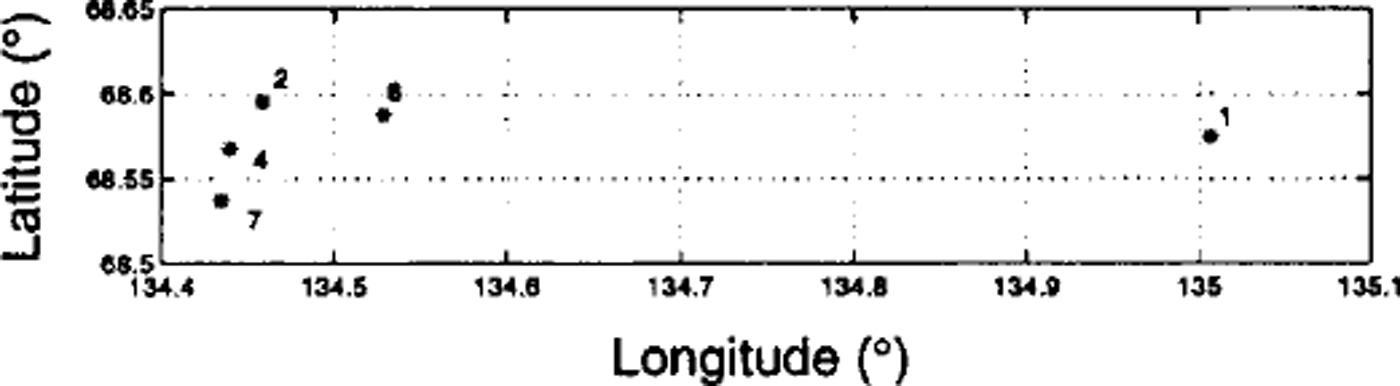
Five buoys were deployed in an L-shaped cluster of ice floes (Fig. 1). The buoys were placed on floes approximately 10−15 m in diameter and 1−1.2 m thick. These dimensions were small compared to the observed ocean-swell wavelength. The signals transmitted by the buoys can be corrupted if the buoys are placed too close together, so they were spaced 2−33 km apart, the lower limit of 2 km proving sufficient to avoid this problem. Once the buoys were in position they were allowed to drift freely for approximately 12 h.
Initial positions of the buoys/floes. Each asterisk represents the position of the buoy/floe, and the number denotes the reference number of the buoy. At this location the distance between vertical gridlines is about 6.9 km and the distance between horizontal gridlines is about 3.3 km.
The buoys were secured to the ice floes by drilling a hole in the ice for a mast and tying the mast down to ice screws. Each of the buoys was fitted with a GPS Allstar OEM module®; a pair of iMEMS® dual-axis accelerometers; and a Honeywell two-axis, magnetoresistive, microcircuit compass. The GPS receivers and the compasses had a sampling frequency of 1 Hz, and the accelerometers had a sampling frequency of 5 Hz. Selective Availability was active during the experiment. This is one of the methods the U. S. Department of Defense uses to deny civilian users full use of the GPS. It is achieved by "dithering" the clock frequency and truncating the navigation data necessary to accurately calculate the positions of the GPS satellites (Reference Hofmann-Wellenhof, Lichtenegger and CollinsHofmann-Wellenhof and others, 1992).
Data were continuously transmitted back to the Nathaniel b. palmer and stored on computer hard drives using Hyper-Terminal®. There were only minor interruptions in transmission during the experiment. At the end of the experiment all of the buoys were recovered in working order.
Analysis
Floe heading
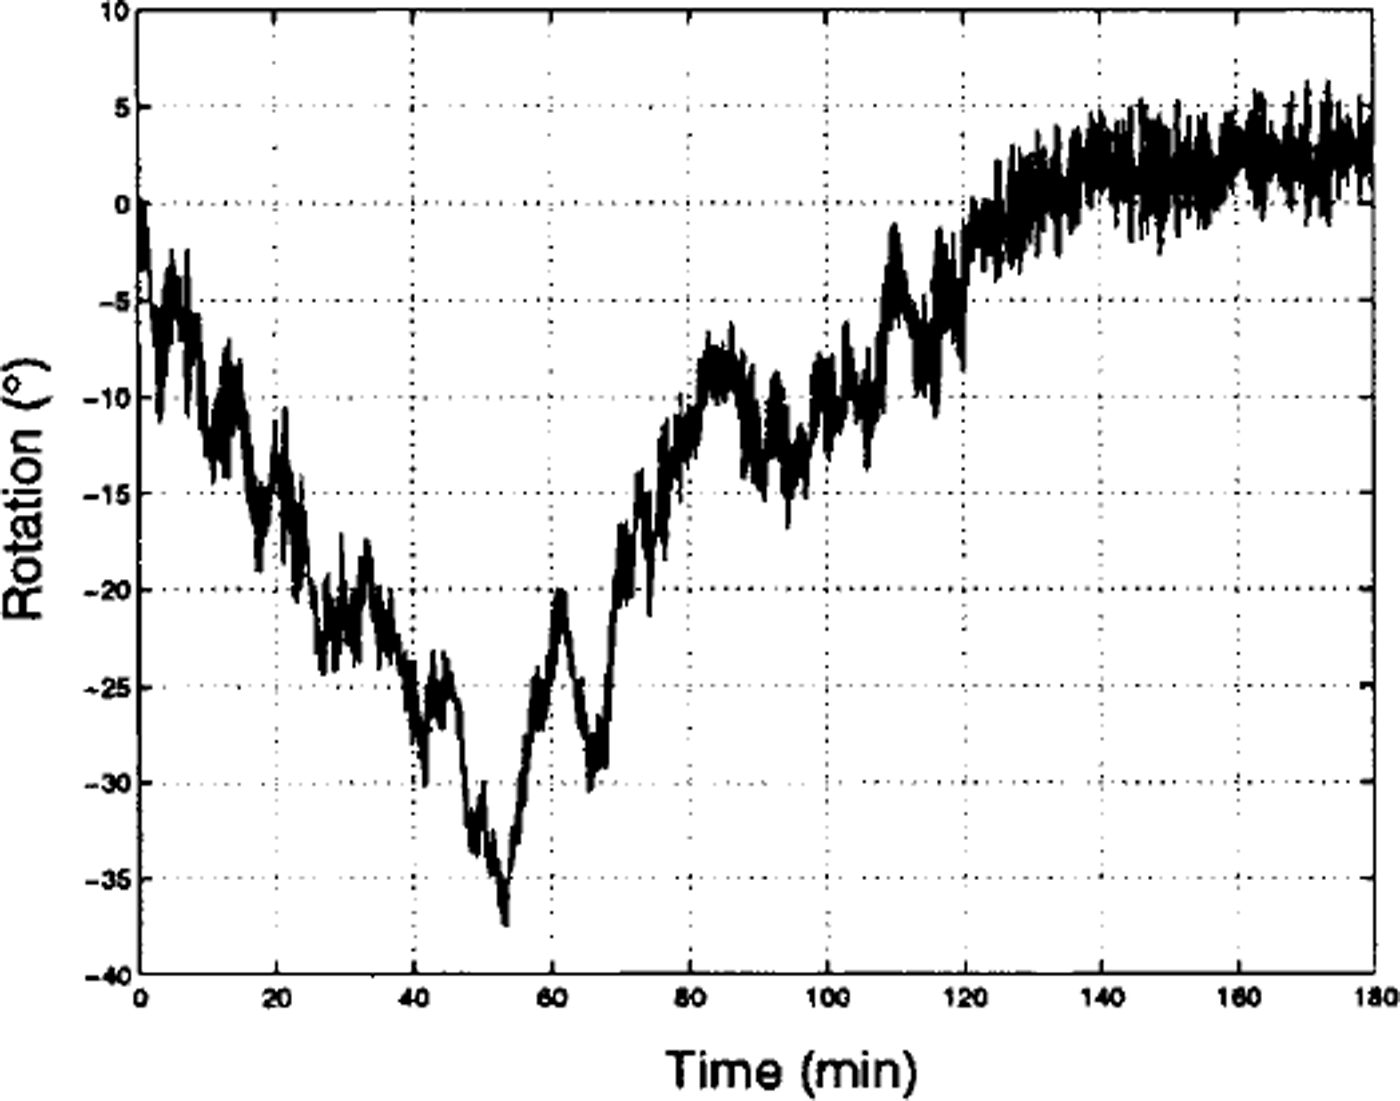
The heading of each buoy (and hence each floe) was recorded for two reasons: to estimate the significance of the floes’ rotational motion, and to adjust for the effect that rotation has on the horizontal acceleration measurements. Figure 2 is an example of compass data from a 3 h period of the experiment, where a rotation of about 30° occurs over the course of 1 h. This example is one of the more rapid rotations found in the data. On top of this drift was a higher-frequency oscillation that was found throughout the compass data (irrespective of buoy or time).
A 3h segment of the rotation data collected during the experiment.
To investigate this high-frequency oscillation a power spectral density (PSD) estimate was calculated using a frequency-averaged periodogram (Reference Kantz and SchreiberKantz and Schreiber, 1997). The signal was broken into contiguous segments each containing 1024 elements. A Harming window of the same length (1024 elements) was employed to reduce the variance and spectral leakage, and a fast Fourier transform (FFT) of each segment was calculated. The PSD was calculated by taking the mean square of these FFTs and dividing through by the square of the norm of the Harming window. All subsequent PSDs in this paper are calculated in a similar way with defending where stated.
Both the smoothing operation of the Harming window and averaging over segments of the data act to reduce the variance and the frequency resolution of the PSD estimate. However, given the amount of data present in each record, it was felt that the resolution sacrificed for the smaller variance was warranted.
The frequency resolution of the PSD estimate (Fig. 3) is KT3Hz, and the 95% confidence interval of the PSD is approximately ± 9% of the PSD estimate. These intervals are small and, for the purpose of clarity, are not included in the figure.
PSD estimate of the compass data (fig. 2).
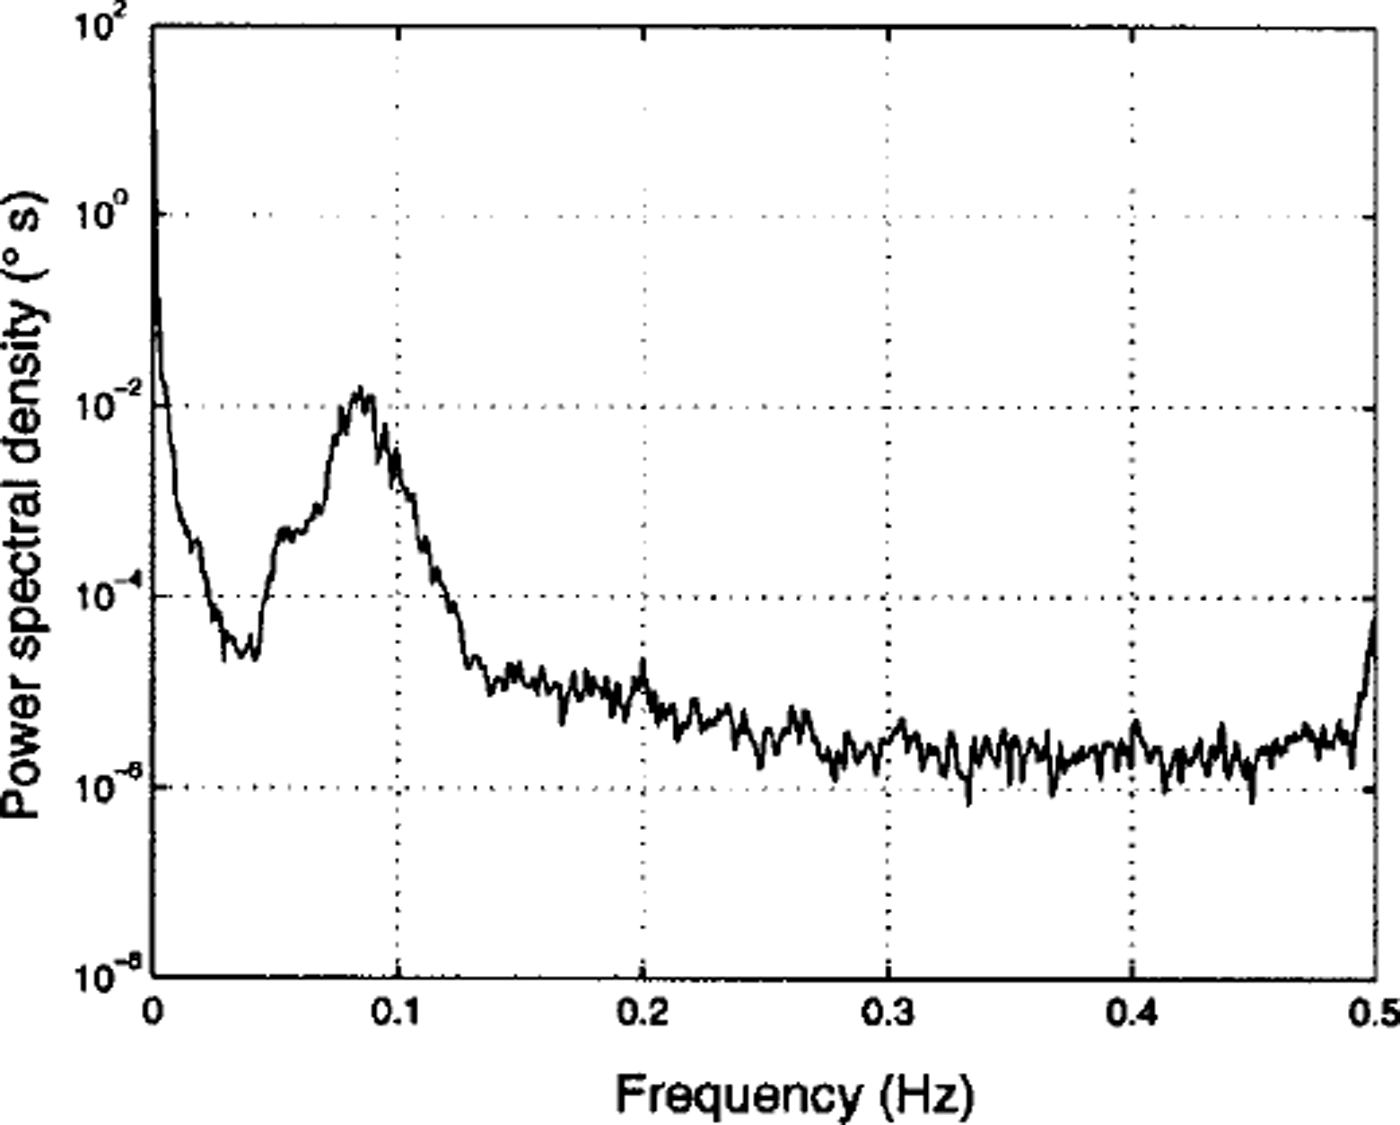
Figure 3 shows the PSD estimate plotted out to the Nyquist frequency limit for the compass data (0.5 Hz). It clearly illustrates the oscillation observed in Figure 2. There is a significant peak in the PSD near 0.08 Hz that is presumably due to wave-induced yaw, i.e. rotational motion about the vertical axis. The mean amplitude of the oscillation (calculated by integrating the PSD over the band 0.05−0.12 Hz and taking the square root) was 2−3°. This estimate is supported by closer inspection of the actual signal.
Floe acceleration
Each accelerometer has three output channels: X, Y and Z. Each of these channels represents the projection of the buoys’ acceleration in a particular direction. The X and Y channels represent two horizontal directions and the Z channel represents the vertical direction (all mutually orthogonal and relative to the upper surface of the ice floe). Figure 4 illustrates typical signals obtained from these channels. There are two obvious differences between the Z and the X and Y channels.
10 min segments of accelerometer data.
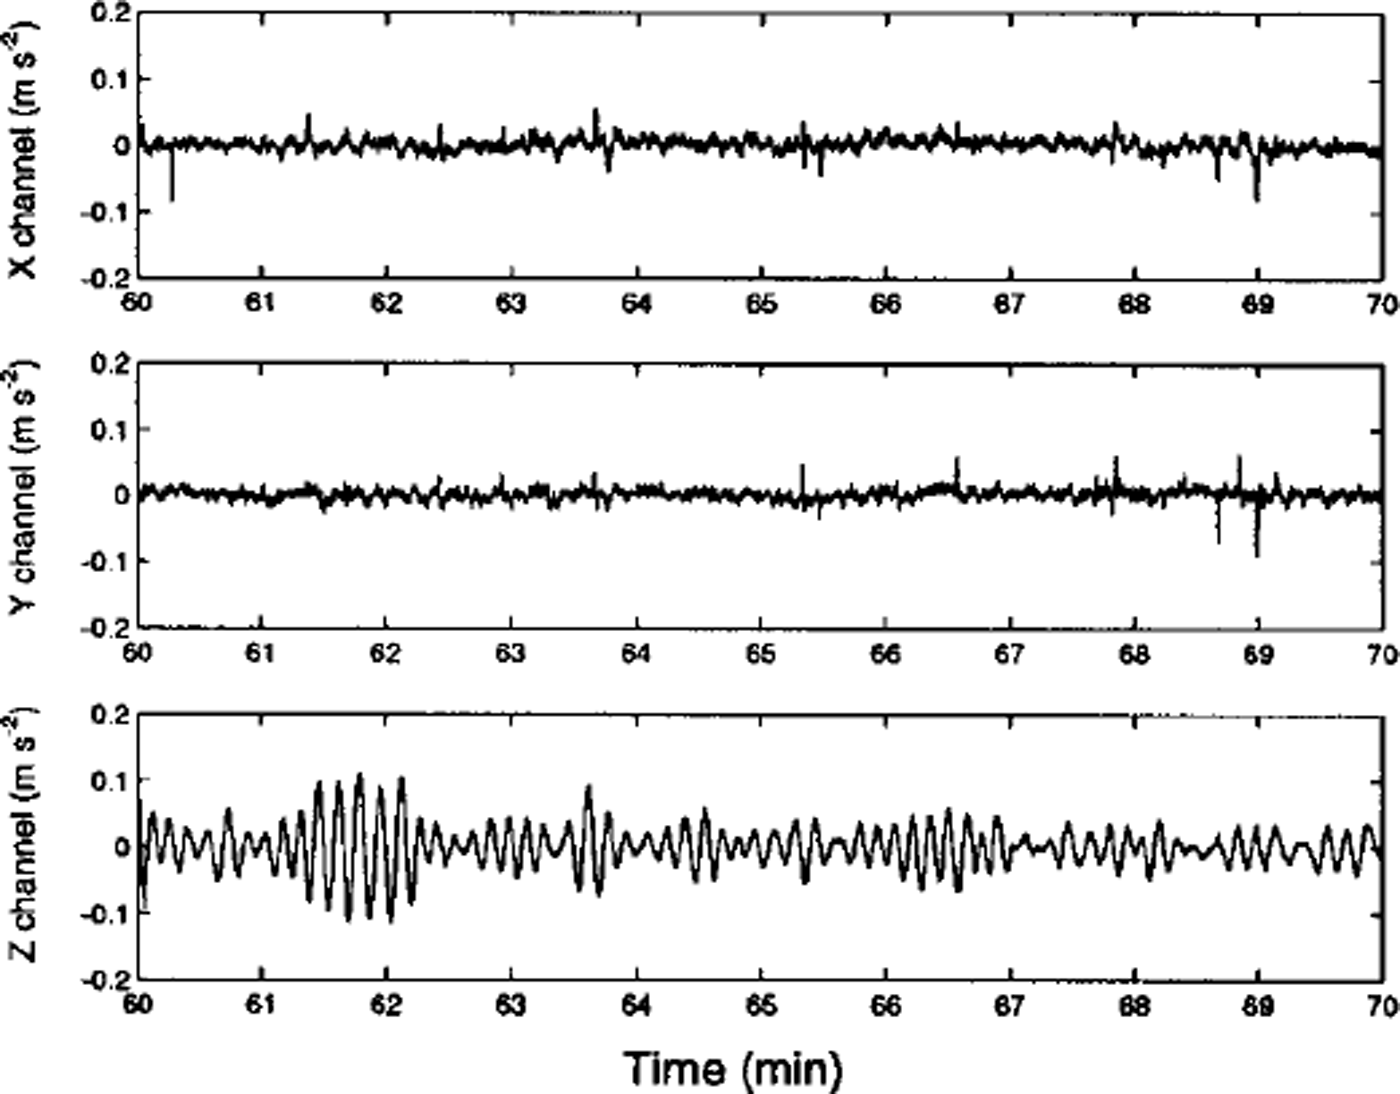
There appears to be a greater level of noise in the horizontal channels than in the vertical channel, arising from the alignment of the accelerometer axes. Typical accelerations due to wave forcing cause the ice floe to pitch and roll about the horizontal plane. The effect of pitching and rolling on the vertical channel is proportional to the cosine of the tilt angle (9), while the effect on the horizontal channels is proportional to the sine of the tilt angle. The tilt angle of the ice floe due to wave forcing is usually quite small, and it is useful to consider the sine and cosine of the tilt angle as power-series expansions of 9 up to second order. Accordingly, the behaviour of the horizontal channels will be proportional to 6, whereas that of the vertical channel will be proportional to  Therefore, the effect on the vertical channel will be an order of magnitude smaller than the effect on the horizontal channels. As a consequence, the horizontal channels can be expected to be more sensitive to small rotational oscillations.
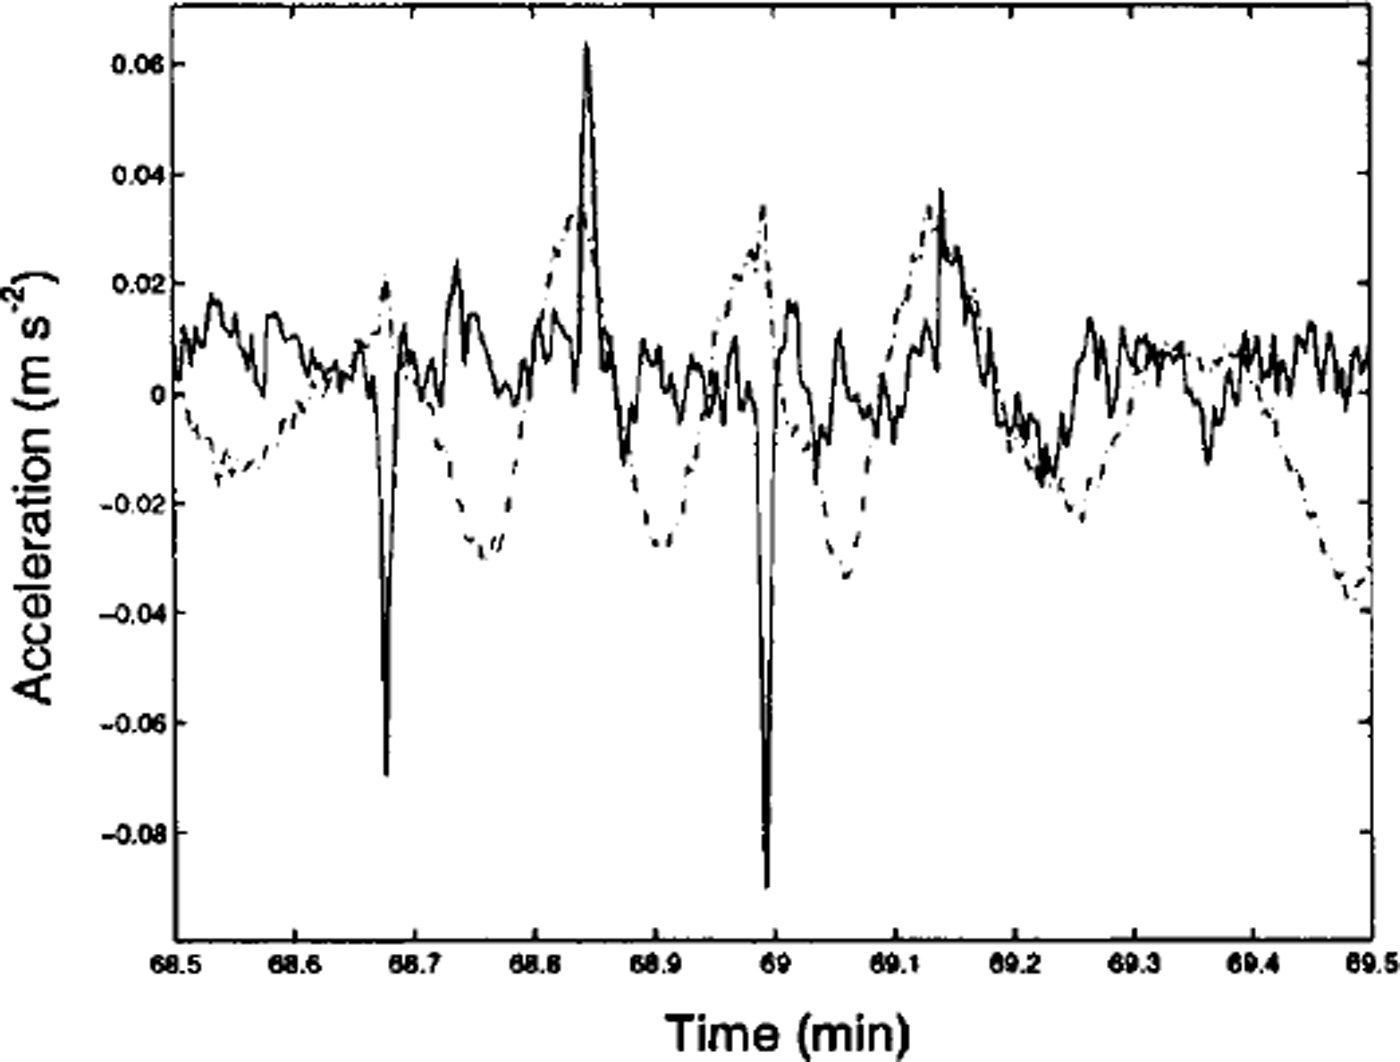
Figure 5 is an enlargement and combination of a short section in Figure 4. There is an obvious periodicity in the acceleration data from the Z channel. In contrast, the acceleration data from the Y channel have no obvious periodicity but do contain three "spikes" that are indicative of an abrupt force to the ice floe.
An enlargement and combination of the z (dashed line) and y ( solid lines) channels of figure 4.
A PSD estimate is used to determine the frequency content of the signals over a 3 h period of the experiment. Figure 6 illustrates the PSD estimates (with linear detrending) for the Z channel and planar acceleration. The planar acceleration is defined here as the X and Y channel data combined as the real and imaginary components, respectively, of a complex signal and adjusted for rotation using compass data from the same period. The frequency resolution of this PSD estimate is KT3 Hz, and the 95% confidence interval is ±2.25% of the PSD estimate.
PSD estimate of the vertical (dot-dashed line) and planar (solid line) acceleration. the dashed line is the noise of the instrument.
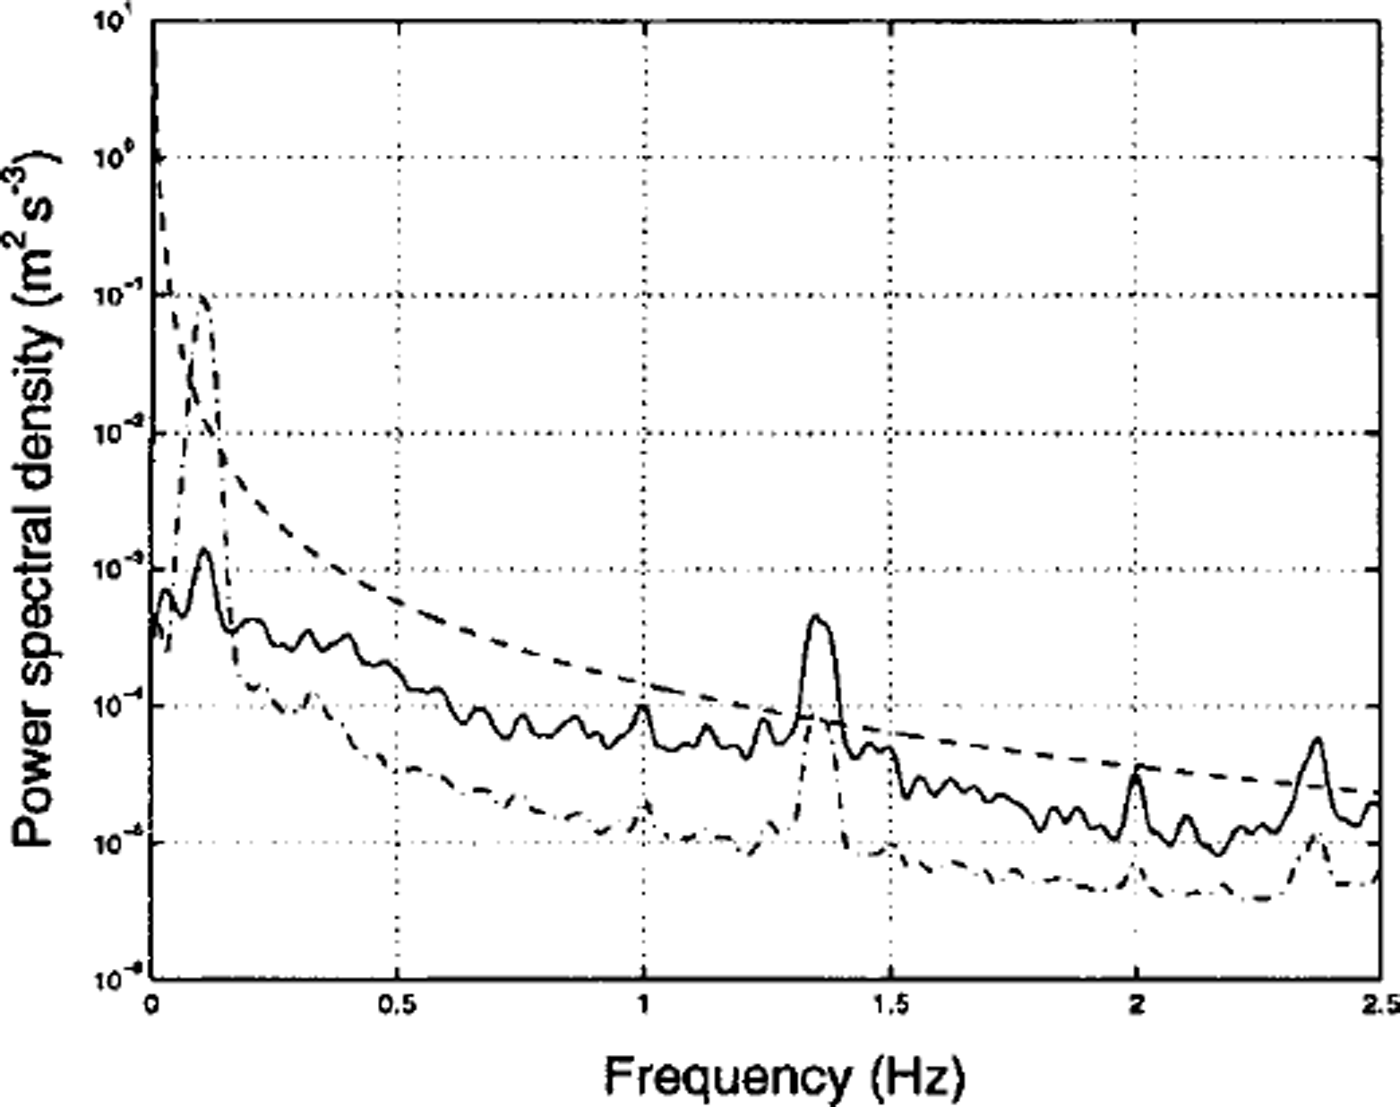
There are peaks in the PSD estimate at 0.1, 1.35 and 2.37 Hz. The peaks are present in both the vertical and horizontal accelerometer data. The peak at 0.1 Hz exceeds the noise threshold in the vertical data but not in the horizontal data. Conversely, the peaks at 1.35 and 2.37 Hz exceed the noise threshold in the horizontal data but not in the vertical data.
Floe position
Figure 7 compares accelerometer data with GPS data by numerically calculating the acceleration from the GPS data. It is clear that the resulting signals differ. The GPS-derived acceleration contains short packets of energy and a small background fluctuation. In contrast, there is a large background fluctuation in the planar acceleration and abrupt spikes, which are absent in the GPS data.
A comparison of GPS displacement data (top signal), numerically differentiated twice with respect to time, with planar acceleration data (bottom signal) for the same period (offset for clarity).
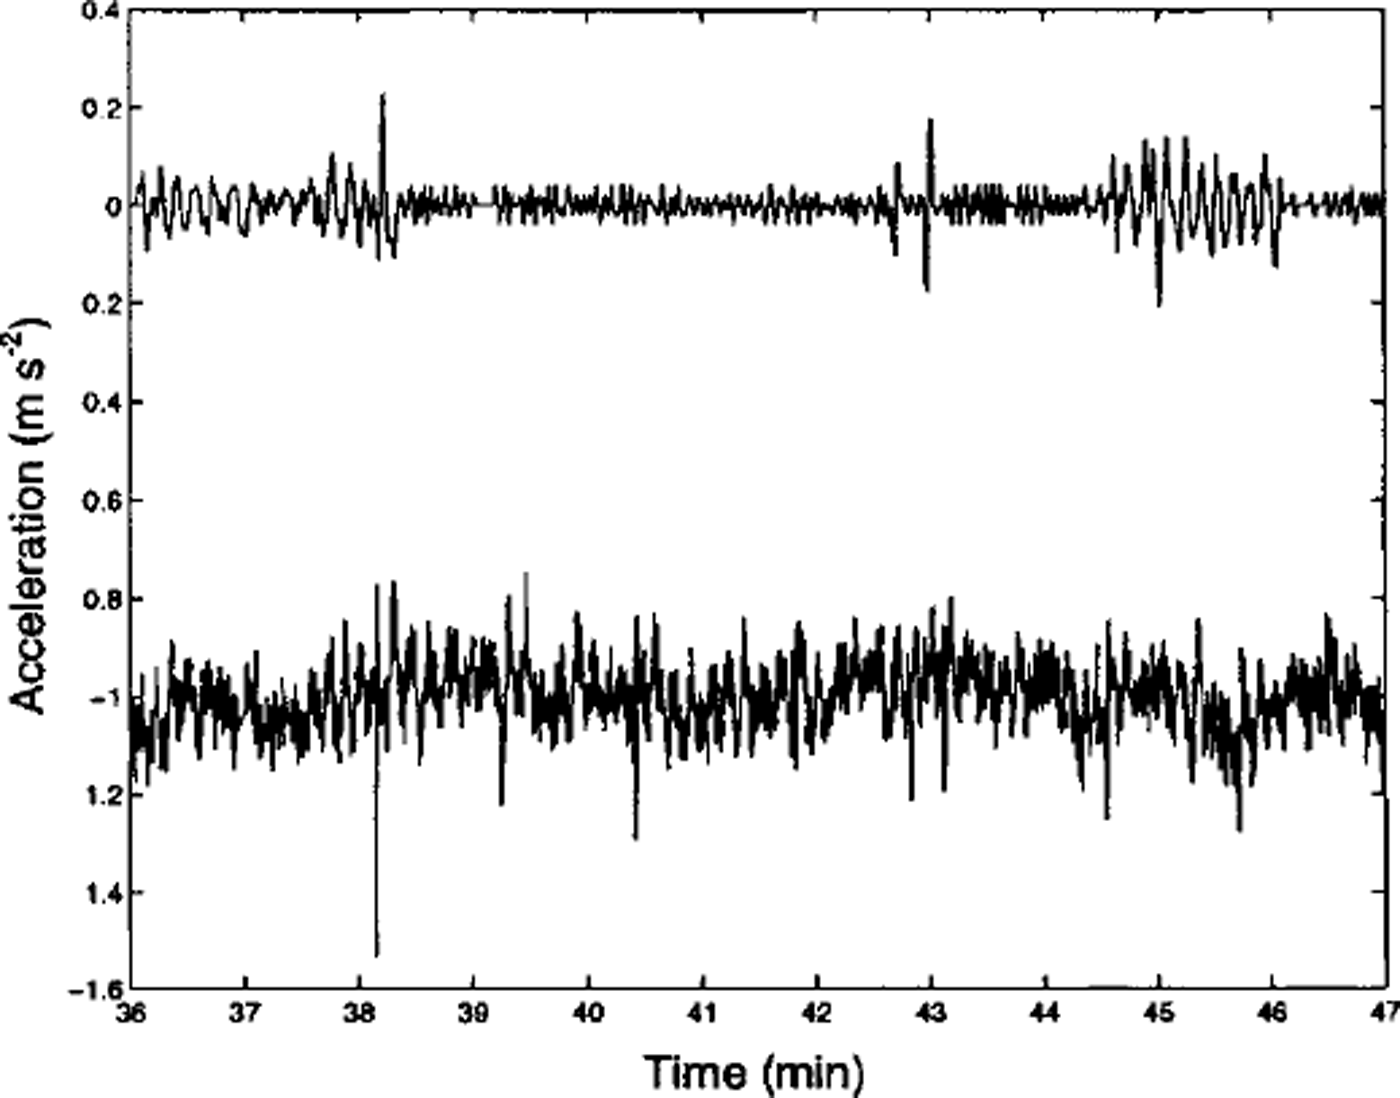
Figure 8 shows the PSD estimate (with linear detrending) calculated from a 3 h segment of displacement data obtained from the GPS receivers. The frequency resolution of the PSD estimate is KT3Hz, and the 95% confidence interval of the PSD is approximately ± 9% of the PSD estimate. Two dashed lines are superimposed on the PSD estimate, representing the upper (40 m) and lower (0.1m) limits of the accuracy of the GPS receivers. The 40 m limit is related to Selective Availability, signal-to-noise, the number of satellites tracked and the angle of the satellites. The 0.1 m limit is the theoretical limit on accuracy due to the phase ambiguity of the carrier wave. The second PSD corresponds to 30min of data collected from a stationary GPS receiver, which provides a useful estimate of the instrument noise and the time-scales of the upper and lower limits of accuracy.
PSD estimate of GPS displacement data taken during the experiment (thick, solid line) and for a stationary buoy (thin, solid line). the 95% confidence interval is ±9% of the estimate, and the frequency resolution is 10−3 HZ.
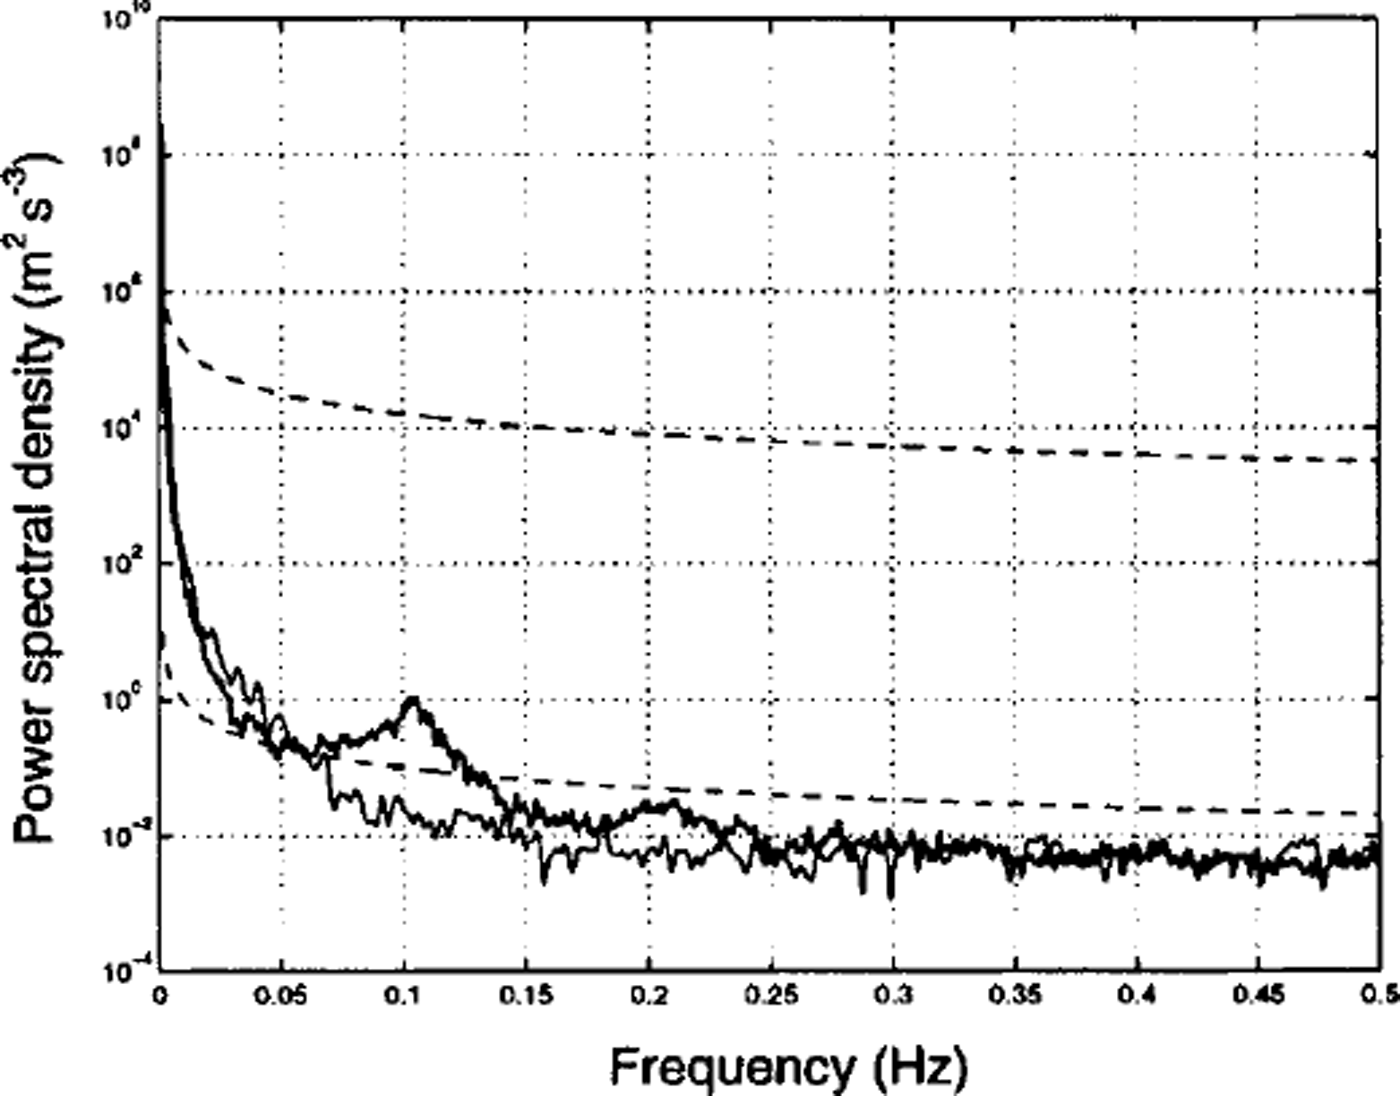
There is a peak in the PSD estimate in the frequency band at approximately 0.06−0.12 Hz. This is similar to the low-frequency peak in the PSD estimate of the acceleration data (see Fig. 6). A mean amplitude of 130 mm is found in this band by integrating the PSD over the interval 0.06−0.12 Hz and taking the square root of the result.
The PSD estimate also indicates significant power at 0−0.05 Hz, which is likely to be related to Selective Availability or other long-term oscillations or drift in the data. The remainder of the signal spectrum falls below the lower limit of accuracy.
Discussion
Low-frequency power in the acceleration data
The dominant behaviour in the vertical acceleration data is expressed as a peak in the low-frequency band 0.04−0.16 Hz (Fig. 6). The PSD also suggests a peak in the planar acceleration, corresponding to the same low-frequency band, although it is small and falls below the noise level of the instrument. The oscillation corresponding to the peak in the vertical acceleration can be observed directly from the data in Figure 5. The oscillation in the horizontal channels is less obvious.
The ice floes used in this experiment were small compared with the wavelength of the observed ocean swell and, according to Reference McKenna and CrockerMcKenna and Crocker (1992), will approximately follow the motion of the sea surface. The frequency of the observed ocean swell was within the low-frequency band. Therefore, we attribute the power in the low-frequency band to ocean-wave forcing.
High-frequency power in acceleration
An interesting feature of the accelerometer data was a peak in the PSD estimate in the high-frequency band 1.30−1.40 Hz (see Fig. 6). This feature was found in each channel of each accelerometer throughout the experiment.
The hypothesis that this high-frequency oscillation was due to unforced pitching or rolling of the ice floe can be tested by a simple analysis. Treating the ice floe as a rigid body (a reasonable assumption for small ice floes), the frequency of pitching or rolling is approximately

(Reference Martin and DruckerMartin and Drucker, 1991), where / is the frequency of pitching/rolling, g is the gravitational acceleration at sea level, Δρ is the density difference between sea water and sea ice, pi is the density of sea ice and h is the thickness of the ice floe. For the ice floes used in this experiment, this equation gives a frequency of approximately 0.15 Hz. Therefore, the power in the high-frequency band is unlikely to be the result of unforced pitching or rolling.
Alternatively, phenomena such as ridging or stick-slip interactions may be responsible for the energy at this frequency; both of these phenomena can produce accelerations in ice floes at this frequency (Reference Martin and DruckerMartin and Drucker, 1991). However, both of these mechanisms rely upon sustained, compressive forces between the ice floes. The combination of ocean-wave forcing, small ice floes and a low average packing density of the ice floes suggests it is unlikely that the necessary conditions for these phenomena existed during this experiment.
A gravity wave with a 1 Hz frequency has a wavelength of about 1 m. It is plausible that wind waves generated in the open water between floes could have caused the ice floes to pitch and roll, although, in accordance with the observations, we have inadequate data at this point to test this hypothesis.
There is also a small peak near 2.37 Hz, which is unlikely to have a physical interpretation. Although the buoys were fitted with anti-aliasing filters, it is possible that there was some spectral leakage and this small peak is an aliasing effect.
Floe-floe interactions
Bumping and jostling between floes causes abrupt accelerations in the horizontal plane. Figure 5 shows an example of accelerometer data containing short spikes in the Y channel that are absent in the Z channel. The spikes in the Y channel are about one period apart. This pattern is found repeatedly in the acceleration data.
The spikes in the ^-channel data appear to coincide with the peaks/troughs of the low-frequency oscillation in the Z channel in this example. However, this is not always the case. As noted by Reference McKenna and CrockerMcKenna and Crocker (1992), it is the relative motion between two ice floes that is important in determining the timing of the interactions, i.e. the phase relationship between the wave-forcing and the timing of the spikes is less meaningful than the time interval between the spikes, which reflects the period of the wave-forcing.
Buoy displacement
The accelerometer data from this experiment are consistent with previous results obtained under similar conditions (Reference Martin and BeckerMartin and Becker, 1987; Reference Martin and DruckerMartin and Drucker, 1991; Reference McKenna and CrockerMcKenna and Crocker, 1992). This supports the use of the accelerometers as controls for gauging the performance of the GPS receivers.
Figure 7 compares the GPS data with the corresponding planar acceleration by numerically differentiating the GPS data twice with respect to time. Although the acceleration calculated from the GPS data contains some spikes, there are also packets of energy with similar amplitude. Furthermore, there are periods where the planar acceleration data contain spikes but the GPS data do not. This result is ambiguous and suggests that the displacement data obtained using the GPS receivers may be unable to resolve the forcing associated with ice floes bumping and jostling. However, this does not rule out the possibility of detecting floe-floe interactions like ridging and shearing, which occur over longer time-scales.
The PSD estimate of the GPS data (Fig. 8) contains an oscillation in the low-frequency band 0.06−0.12 Hz. The power in this band exceeds the power in both the theoretical lower limit on accuracy and the instrumental noise produced by a stationary GPS receiver.
This was true for all of the receivers, each having PSD estimates that were practically identical. From the relationship between the accelerometer data and the ocean-wave forcing, we may infer that the GPS receivers are detecting and measuring the ocean-wave forcing on the ice floe. This remarkable result rests upon the fact that we are resolving differences in displacement on a time-scale where the limit of accuracy is predominantly due to the phase ambiguity of the carrier wave used to transmit the GPS signal.
GPS receivers are commonly used to monitor long-term changes in position or to measure the absolute position of the receiver. To achieve high accuracy often requires units that perform in a differential mode (upper limit of accuracy lm). However, the result of this experiment indicates that less elaborate GPS technology may be capable of measuring changes in displacement on the time-scale of ocean waves without the use of differential GPS or the deactivation of Selective Availability.
The importance of this result is related to the economy and simplicity of current GPS technology. An economical alternative to expensive accelerometers, which is simple to operate and deploy, would allow researchers to conduct experimental programmes of greater scope than is currently feasible.
Summary
This experiment has shown that simple GPS receivers may be capable of measuring ocean-wave forcing on ice floes. This results from the fact that the resolution between GPS measurements, on the time-scale of ocean waves, is very precise. Although the GPS receivers appear unable to accurately resolve abrupt forcing such as when ice floes bump into and jostle with one another, this does not rule out the possibility of detecting floe-floe interactions, like ridging and shearing, which happen over longer time-scales. The relative affordability and availability of GPS technology may permit greater opportunities for research on MIZ dynamics, particularly on the time-scale of ocean waves.
Acknowledgements
The authors would like to thank V. Squire, D. Tan, and T. Dixon for their useful suggestions. This work was funded principally by a grant from the New Zealand Public Good Science Fund, and by a Marsden Grant administered by the Royal Society of New Zealand. We also thank the captain and crew of the nathaniel b. palmer, the U. S. National Science Foundation and the Antarctic Support Associates for their support.



