I. INTRODUCTION
Electromigration (EM), which describes the mass transport due to momentum exchange between conducting electrons and diffusing metal atoms under an applied electric field, has become a serious reliability issue in high-density packaging. This is because, with continuous miniaturization of electronic devices, solder joints are downsized and the current density through them thereby increases even up to 104 A/cm2. Furthermore, current crowding phenomenon occurs in the line-to-bump configuration in flip-chip packages.Reference Chen, Tong and Tu1,Reference Chan and Yang2 The current density in current crowding regions of solder bumps can be 10–20 times higher than the nominal current density through them.
Because atoms are driven from the cathode to the anode, lattice sites in the anode can be created as needed to accommodate the incoming flux of atoms, whereas vacancies are driven in the opposite direction and thus lattice sites in the cathode can be destroyed as needed as vacancies gather. As a result, the anode is in compression while the cathode is in tension,Reference Blech3 and the solder bump creeps under these stresses.
EM causes progressive damages to solder joints. Previous studies revealed that hillock and whisker growth at the anode and void formation-and-propagation at the cathode are related with the EM-induced stresses in solder joints. As to the EM-induced damages at the anode, Xu et al.Reference Xu, Pang and Tu4 investigated the EM-induced back stress by the movement of nanoindentation markers, and the stress gradient near the anode was calculated as high as 97 kPa/µm in Sn–3.8Ag–0.7Cu solder bumps. Ouyang et al.Reference Ouyang, Chen, Tu and Lai5 investigated the hillock and whisker growth at the anode of flip-chip solder bumps and found that the Sn–3.8Ag–0.7Cu solder had a higher back stress than the Sn–37Pb solder. Consequently, EM in the Sn–3.8Ag–0.7Cu solder was slower than that in the Sn–37Pb solder, and the surface of Sn–37Pb solder bumps showed dimple and bilge, whereas that of Sn–3.8Ag–0.7Cu solder bumps remained flat. Zhu et al.Reference Zhu, Liu, Wang and Shang6 investigated the morphological change of Sn–3.8Ag–0.7Cu line-type interconnects and found that Cu6Sn5 segregation on the surface of Sn–Ag–Cu solder generated a large compressive stress, which drove the stressed grains to grow into hillocks at the anode.
As to the EM-induced damages at the cathode, Lin et al.Reference Lin, Hu, Tsai, Kao and Tu7 in situ observed the void formation-and-propagation failure mechanism of Sn–37Pb flip-chip solder bumps at room temperature. They reported that current crowding was a dominant factor responsible for the failure at the cathode–chip side while the cathode–substrate survived the electron current stressing. Jen et al.Reference Jen, Liu and Lai8 investigated EM-induced failure of Sn–3Ag–1.5Cu solder bumps under 1 × 10⁴ A/cm2 and at an ambient temperature of 150 °C. All failures occurred at the cathode–chip side because of the void initiation-and-propagation along the under bump metallization (UBM)/solder interface but not at the cathode–substrate side.
Besides the EM-induced stress, the actual temperature of solder bumps undergoing EM varies even tested at the same ambient temperature because Joules heating effect becomes significant under such a high-current density. Furthermore, the solder composition varied from Sn–37Pb to Sn–xAg–yCu in previous studies. The solder composition definitely has an important influence on the EM behavior. EM-induced damages of the most popular Sn–3.0Ag–0.5Cu lead-free solder bumps (melting point of 217 °C) have attracted much research interest.
In the present work, in situ observations of the EM-induced damages of polished half-size Ni/Sn–3.0Ag–0.5Cu/Ni–P flip-chip solder bumps, that is, at the anode, the cathode, and in the bump, will provide insight into the failure mechanisms of the actual intact solder bumps. Furthermore, the microstructural evolution of solder bumps at the last stage of lifetime was also investigated.
II. EXPERIMENTAL PROCEDURES
The test vehicle was based on flip-chip packages, each involving a 12 × 12 × 0.8 mm3 silicon chip interconnected to a printed circuit board (PCB) with 228 solder balls. Figure 1(a) shows the schematic configuration of the flip-chip solder joints. Sn–3.0Ag–0.5Cu (wt%) solder balls of 300 μm in diameter were used. The UBM on chip was Ni of 6 μm in thickness and 300 μm in diameter. The surface finish on PCB was electroless nickel electroless palladium immersion gold (ENEPIG), that is, a multilayer structure of 4.5 μm electroless Ni–P, 0.05–0.15 μm electroless Pd, and 0.015–0.05 μm immersing Au. The opening diameter of ENEPIG finish was 250 μm. The cross-sections of Cu traces on the PCB and chip were 45 × 225 μm2 and 25 × 260 μm2, respectively.
Schematics of (a) the Ni/Sn–3.0Ag–0.5Cu/ENEPIG solder joint and (b) the daisy chain of electrons across solder joints.

The 22 outermost solder bumps at one edge of chip samples were ground and polished to the half of the solder bumps, and their cross-sections were used for the in situ observation. The 22 half solder bumps were applied with a current density of 1.5 × 10⁴ A/cm2 in silicone oil to keep at 150 °C, as shown in Fig. 1(b). The chip sample was taken out for microstructural examination using a scanning electron microscope (SEM) every other 50 h till the failure after 250.6 h. Electron probe microanalysis (EPMA) was used to identify the compositions of the phases in the solder joints.
III. RESULTS AND DISCUSSION
A. Microstructure of as-reflowed solder joint
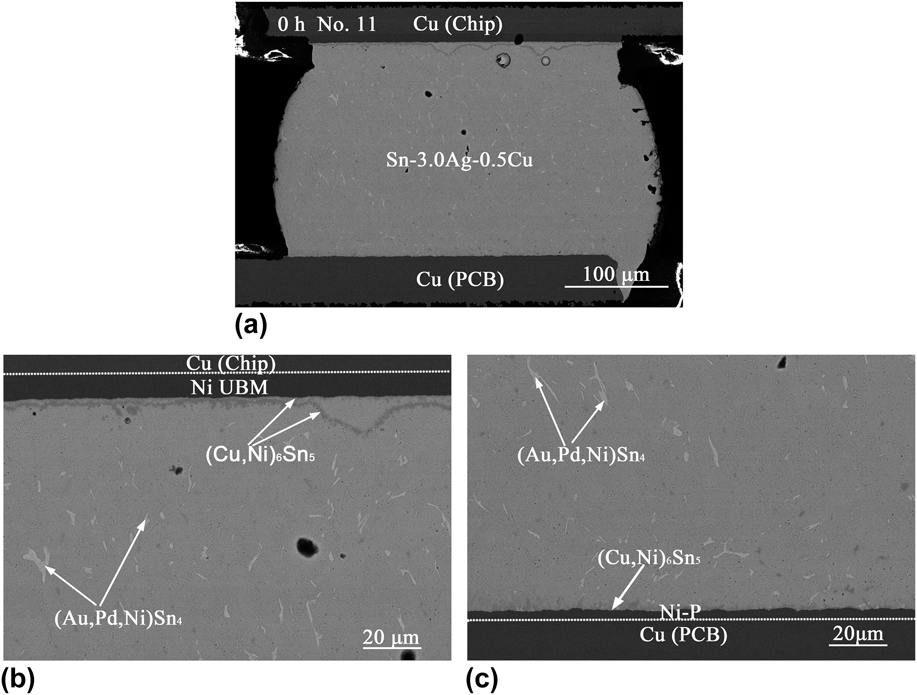
Figure 2 shows a cross-sectional macrograph of an as-reflowed Ni/Sn–3.0Ag–0.5Cu/ENEPIG solder joint. It was observed that a continuous spalled layer of intermetallic compounds (IMCs) was formed at the solder/Ni UBM interface after reflow soldering two times, as shown in Fig. 2(b). The compositions of the interfacial IMCs identified by EPMA analysis were Cu-30.9 at.% Ni-25.7 at.% Sn-43.4 at.%, that is, (Cu0.55,Ni0.45)6Sn5 and Cu-31.5 at.% Ni-23.2 at.% Sn-45.3 at.%, that is, (Cu0.58,Ni0.42)6Sn5, respectively. As shown in Fig. 2(b), the compositions of the continuous interfacial IMC at the solder/Ni–P UBM interface after reflow soldering one time identified by EPMA analysis were Cu-31.0 at.% Ni-22.8 at.% Sn-46.2 at.%, that is, (Cu0.58,Ni0.42)6Sn5. EPMA analysis identified that the white particles precipitated in the bulk Sn–3.0Ag–0.5Cu solder were (Au,Pd,Ni)Sn4 phases with an average composition of Au-14.873 at.% Pd-2.071 at.% Ni-1.883 at.% Sn-81.173 at.%, that is, (Au0.79Pd0.11Ni0.10)Sn4, which are related to the lower solubilities of Au and Pd in the solid solder than those in the molten solder.Reference Huang, Ye and Zhao9,Reference Law, Wu, Yu, Li and Chi10
Cross-sectional microstructure of as-soldered joint. (a) macrograph, (b) enlarged view of the interface on the chip, and (c) enlarged view of the interface on the PCB.
B. Hollows formed at the cathode
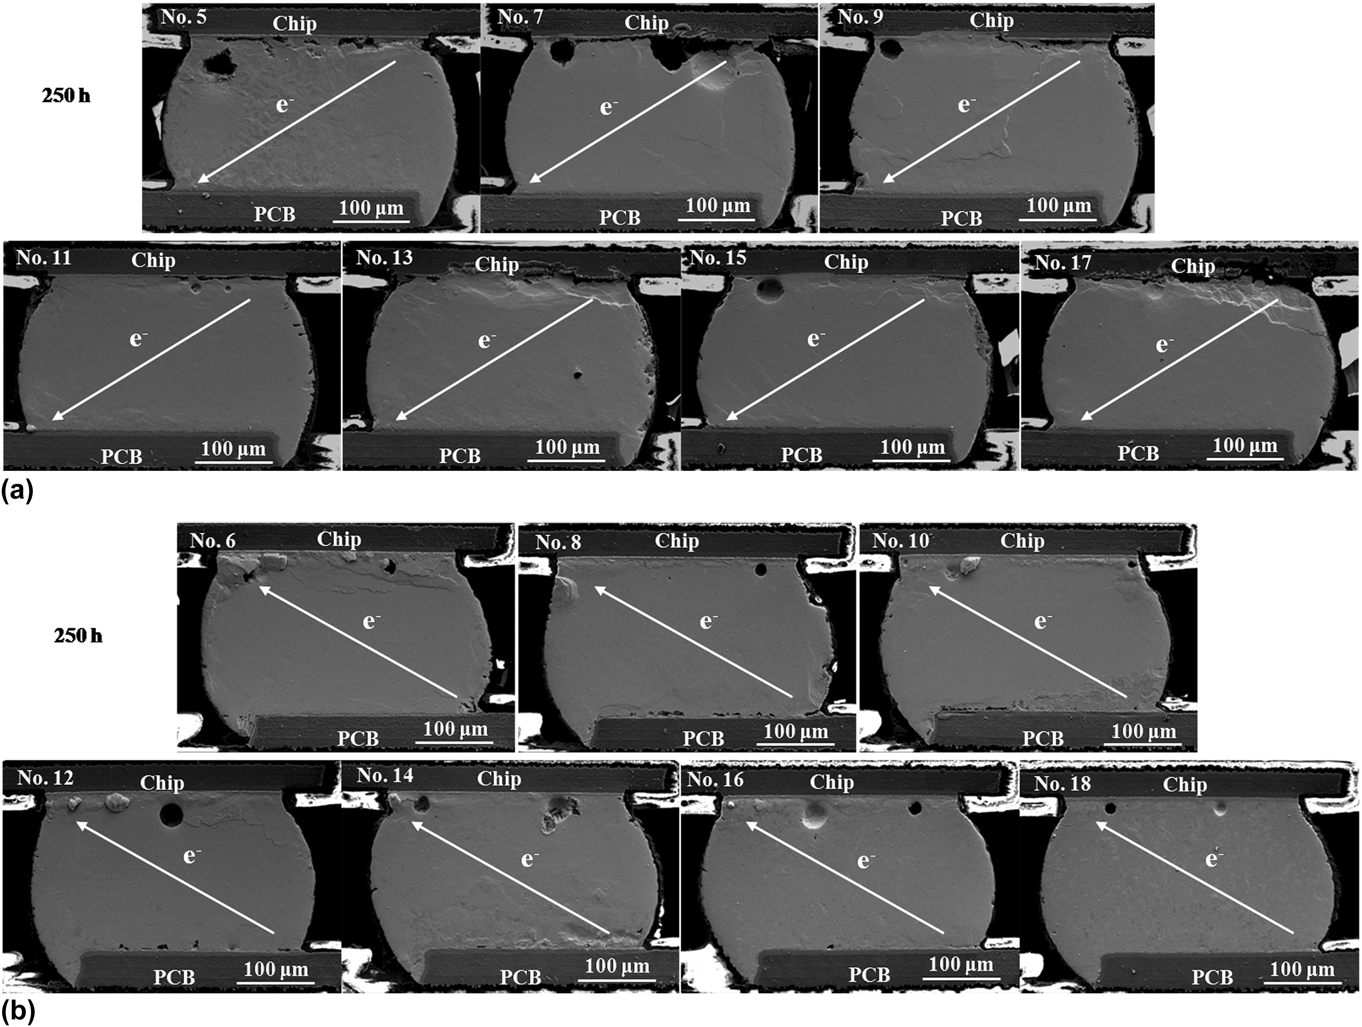
Figure 3 shows the cross-sectional microstructure of the Nos. 5–18 solder bumps after EM for 250 h. The odd solder bumps were with electrons flowing from the chip to the PCB, and the even solder bumps were with electrons flowing from the PCB to the chip. The in situ observation of microstructural evolution showed that the surface morphology of solder bumps became rough due to nonuniform stress distribution, especially at the cathode, as shown in Fig. 3. Upon electron current stressing, nonequilibrium diffusion of atoms occurred in solder bumps, that is, a large amount of atoms gathered at the anode and vacancies gathered at the cathode. Therefore, there was a compressive stress at the anode and a tensile stress at the cathode, resulting in a back stress gradient across the solder bump from the anode to the cathode.Reference Blech3
Cross-sectional microstructure of Nos. 5–18 solder bumps after EM for 250 h. (a) Electrons flowing from chip to PCB and (b) electrons flowing from PCB to chip.
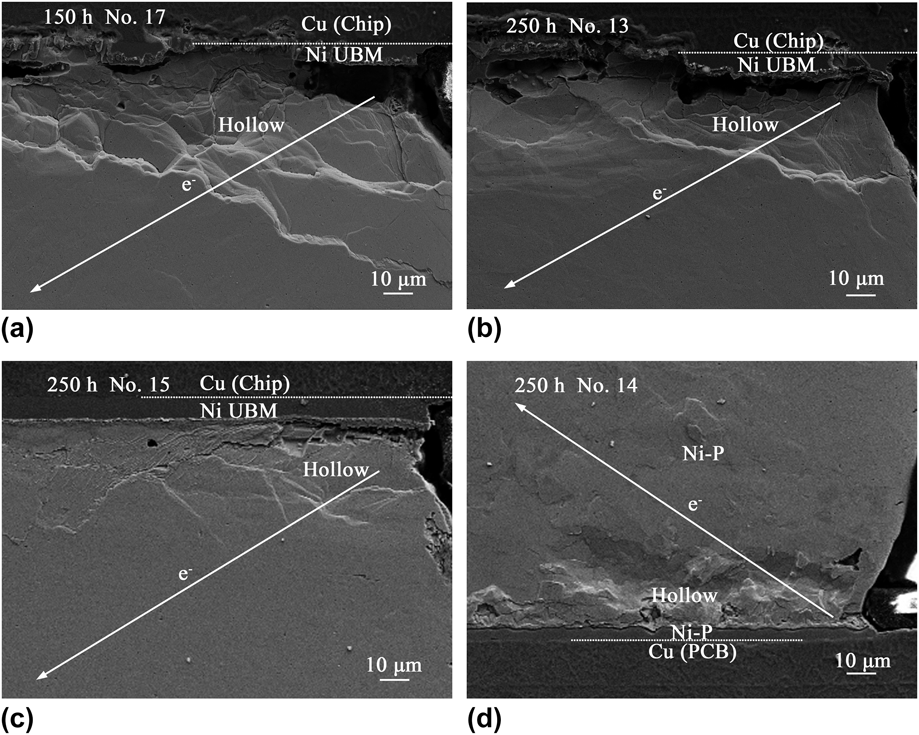
As shown in Fig. 3, voids and hollows were formed at the cathode in all the solder bumps. Figure 4 shows the enlarged SEM images of the electron-entrance corners of Nos. 13, 14, 15, and 17 solder bumps. The hollows at the cathode–chip sides in the Nos. 13, 15, and 17 solder bumps showed terrace morphology. Voids and cracks were formed at the solder/Ni UBM interfaces, and the obvious dissolution of part of the Ni UBMs also occurred. The damage of hollows at the cathode–PCB sides was not as serious as that at the cathode–chip sides, as shown in Fig. 4(d).
The enlarged SEM images of hollows at the cathode in (a) No. 17, (b) No. 13, (c) No. 15, and (d) No. 14 solder bumps.
A large amount of Sn atoms were driven away from the electron-entrance corners by lattice diffusion or grain boundary diffusion, leaving vacancies at the initial current crowding regions. When more vacancies gathered at the cathode, the void formation-and-propagation was observed,Reference Jen, Liu and Lai8,Reference Zhang, Ou, Huang, Tu, Gee and Nguyen11 which consequently induced the redistribution of current. The void formation-and-propagation reduced the effective contact area of current path and induced a more serious current crowding, and thus accelerated the migration of atoms and the propagation of voids along the interface. Meanwhile, vacancies also diffused to the surface of the solder bumps, resulting in sink hollows in the solder bumps. The vacancy concentration was related to the current density.Reference Yeh, Choi, Tu, Elenius and Balkan12 Therefore, the current crowding effect induced the deepest hollow at the extreme top right corner of the cathode, and the sink hollows displayed terrace morphology. The formation of hollows at the cathode reduced the vacancy concentration and relieved the EM-induced tensile stress.
C. Hillocks formed at the anode
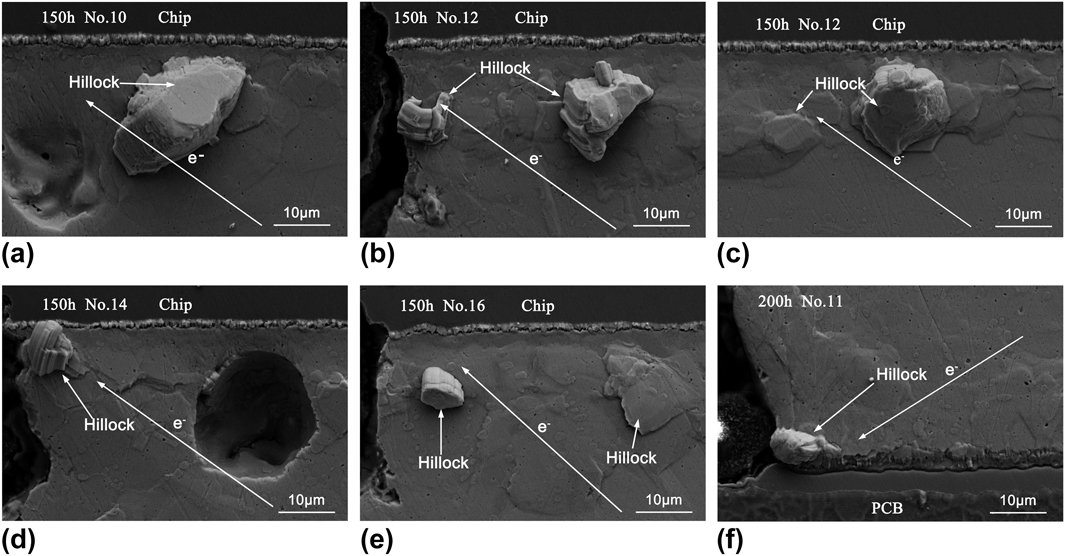
As shown in Fig. 3, although hillocks formed at both the chip and PCB sides, more hillocks were observed at the anode–chip sides than at the anode–PCB sides. Figure 5 shows the enlarged SEM images of the hillocks in the Nos. 10, 11, 12, 14, and 16 solder bumps. In these five solder bumps, No. 11 was the only solder bump with electrons flowing from the chip to the PCB, in which a hillock at the anode was observed after EM for 200 h. In contrast, even after EM for only 50 h, many hillocks were observed at the anode of the solder bumps with electrons flowing from the PCB to the chip. Finite element simulation showed that in the present solder bumps, the current density of electron-exit corner with electrons flowing from the PCB to the chip was around 1.5 times higher than that with electrons flowing from the chip to the PCB.Reference Huang, Ye and Zhao9 The higher current density induced more atoms to gather at the electron-exit corner. This explains why more hillocks formed at the anode–chip sides than at the anode–PCB sides.
The enlarged SEM images of hillocks at the anode in (a) No. 10, (b) No. 12, (c) No. 12, (d) No. 14, (e) No. 16, and (f) No. 11 solder bumps.
The hillocks grew because of the compressive stress at the root rather than the self-growth at the top. As shown in Figs. 5(a) and 5(e), the tops of the hillocks were flat, whereas their side faces exhibited striation feature. Such features indicated that these hillocks were extruded from the matrixes of Sn-rich solder bumps in compressive stress. Upon electron current stressing, a large amount of lattice sites were created to accommodate the incoming flux of atoms, which induced a compressive stress at the anode. The EM-induced compressive stress relaxed through the formation of hillocks at the anode. It was reported that hillocks were more easily extruded from the current crowding corner of Sn–37Pb solder bumps compared with Sn–3.8Ag–0.7Cu solder bumps, because of the lower strength of Sn–37Pb solder.Reference Ouyang, Chen, Tu and Lai5
Because the cross-sections of solder bumps were ground and polished, Sn oxide was formed at the polished surfaces of high-Sn solder bumps. The Sn oxide has a higher hardness than the Sn matrix, which acts as a protective film to inhibit the microdeformation of solder bumps. However, the compressive stress was accumulated with increasing EM time. If the Sn oxide was broken, hillocks might be extruded from the broken areas. As shown in Figs. 5(a) and 5(e), two hillocks with flat tops were extruded from the broken areas, and their trunk sizes were 15 and 5 µm, respectively. In addition, a new hillock of 10 µm in size was just extruded from the broken surface area, as shown in Fig. 5(e). The formation of hillocks at the anode accommodated the incoming flux of atoms and relieved the EM-induced compressive stress. It is noted that the dynamic recrystallization of Sn grains occurred near the anode interfaces. As shown in Fig. 5, tiny Sn grains with sizes of 5–10 µm were observed near the anode interfaces.
D. Sliding of Sn grain boundary in solder bumps
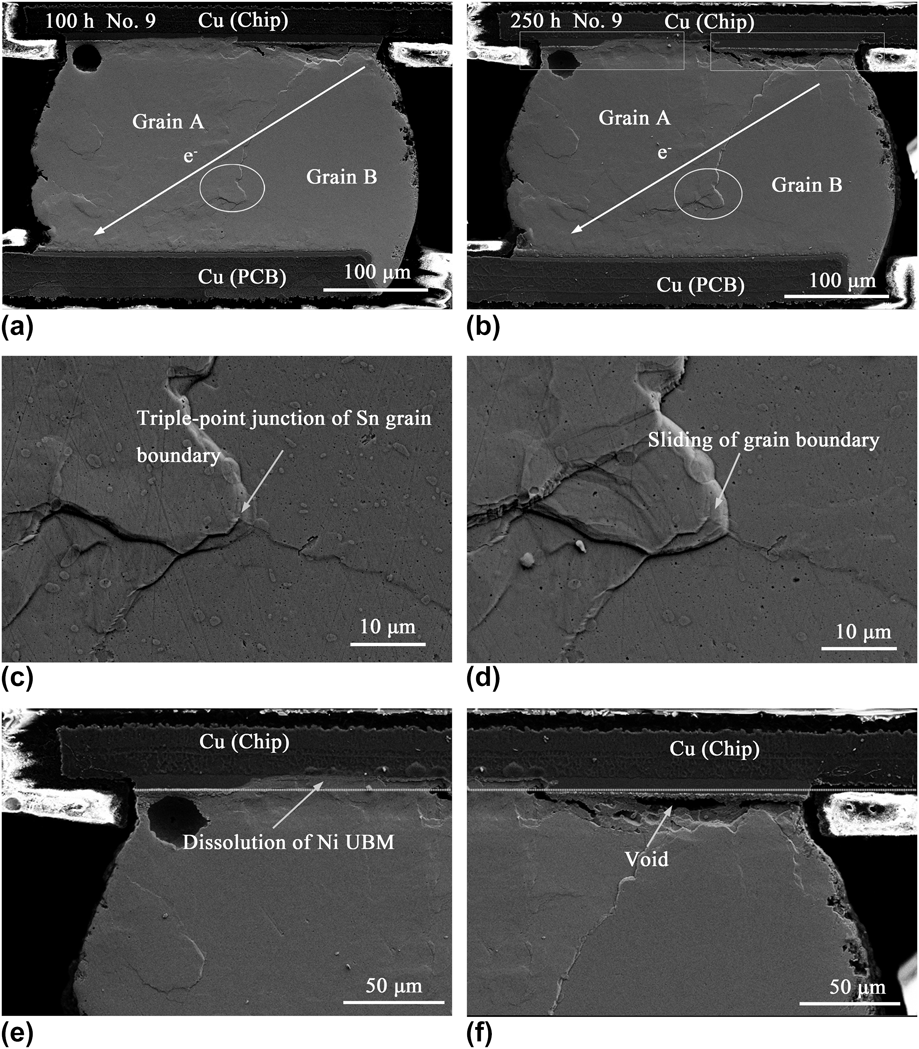
Figure 6 shows the microstructural evolution of the No. 9 solder bump undergoing EM. Sn grain boundaries were observed after EM for 100 h because the sliding of adjacent Sn grains occurred. Figures 6(c) and 6(d) show the enlarged SEM images of the trigeminal Sn grain boundaries in Figs. 6(a) and 6(b), respectively. The top left Sn grain A uplifted gradually, that is, grain boundary sliding was more pronounced with increasing EM time.
Cross-sectional microstructure of No. 9 solder bump after EM for (a) 100 h, (b) 250 h, (c) and (d) are enlarged views of the triple-point junction of grain boundaries in (a) and (b), respectively, (e) and (f) are enlarged views of the cathode interface in (b).
The homologous temperature is 0.86 for Sn–3.0Ag–0.5Cu solder at 150 °C. It is considered that the occurring conditions for diffusion creep of solder bumps are met. The temperature is adequately high so that diffusion of atoms and vacancies are fast enough to generate creep deformation that depends mainly on the directed flows of atoms and vacancies. The stress in solder bumps is low, which generates a rather low dislocation density in the crystal, and the motion of dislocations has a minor contribution to the total creep deformation.
At higher temperature, the diffusion creep whose activation energy is equal to that for lattice diffusion is termed as Nabarro–Herring creep.Reference Herring13 At relatively lower homologous temperature and with smaller grain sizes compared with Nabarro–Herring creep, the grain boundary diffusion prevails the lattice diffusion, and diffusion creep will occur by atomic transport along grain boundaries, which is termed as Coble creep.Reference Coble14 Zhu et al.Reference Zhu, Liu, Wang and Shang6 attributed the grain boundary sliding (groove) of pure Sn to Coble creep at grain boundaries. Actually, there is no evidence that the diffusion creep of Sn-based solder bumps is Nabarro–Herring creep or Coble creep in previous studies and in the present work as well.
The diffusion creep of solder bumps does occur in fact due to the directed flow of atoms toward the anode and directed flow of vacancies to the cathode. In our opinion, the deformation of diffusion creep, including both Nabarro–Herring creep and Coble creep, must be accommodated by grain boundary sliding due to the divergences of vacancy concentration and atom pile up at the grain boundaries. If grain boundary sliding does not occur, voids would form at grain boundaries subjected to internal stresses. The role of grain boundary sliding in diffusion creep principally differs from that in dislocation creep. Grain boundary sliding is an indispensable requisite for diffusion creep, while grain boundary sliding does not need to occur at all if a sufficient number of slip systems operate in dislocation creep regime, that is, every grain in a polycrystalline material can deform freely without any grain boundary void formation.
Furthermore, there were two failure features at the cathode solder/Ni UBM interface, as shown in Figs. 6(a) and 6(b). The first was the void formation-and-propagation into crack and no obvious Ni UBM consumption at the right side of Ni/solder interface, as shown in Fig. 6(f); the second was the obvious dissolution of Ni UBM, as shown in Fig. 6(e). The failure features indicated that the grain orientation had a significant effect on the failure model of flip-chip solder bumps, especially in the fact that there would be only several Sn grains in the whole bump due to continuous miniaturization. This agreed with the results by Lu et al.Reference Lu, Shih, Lauro, Goldsmith and Henderson15 They found that the Ni metallization performed to be consumed when the c axis of Sn grain was aligned with the current direction, while the void formation with no obvious Ni dissolution occurred when the c axis of Sn grain was perpendicular to the current direction. The different orientations of Sn grains in solder bumps induced different diffusion fluxes. Similar results were also observed in the Nos. 13 and 15 solder bumps.
It is noted that because of the strong anisotropic characteristics in mechanical, thermal, electrical, and diffusion behaviors of Sn crystals, Sn grain orientation might govern the stress relaxation and failure behavior of solder bumps, particularly for the highly Sn-containing alloy (i.e., Sn–3.0Ag–0.5Cu) used in this study. This explains why there were two failure features even in a solder bump, as shown in Figs. 6(a) and 6(b). Lu et al.Reference Lu, Shih, Lauro, Goldsmith and Henderson15 also reported that the EM-induced damage of solder bumps strongly depended on the relationship between the Sn grain orientation and the current direction. Moreover, Sn grain boundary sliding occurred between adjacent Sn grains in the solder bump, as shown in Figs. 6(c) and 6(d). It is considered that the anisotropic resistivity causes the divergence of vacancy fluxes at the grain boundaries, and the vacancy gradients along the grain boundaries correspond to the gradients of stress. The opposite sign of the stress along the grain boundaries generates a torque that leads to rotation of the grain by grain boundary diffusion or creep.Reference Wu, Gusak and Tu16 Lee et al.Reference Lee, Liu, Ho and Subramanian17 showed that synchrotron x-ray microscopy was an effective method to gain the information regarding crystallographic orientations and strain fields in solder bumps, aiding the development of a basic understanding of EM in solder bumps.
E. Microstructural evolution of solder bump at the last stage of lifetime
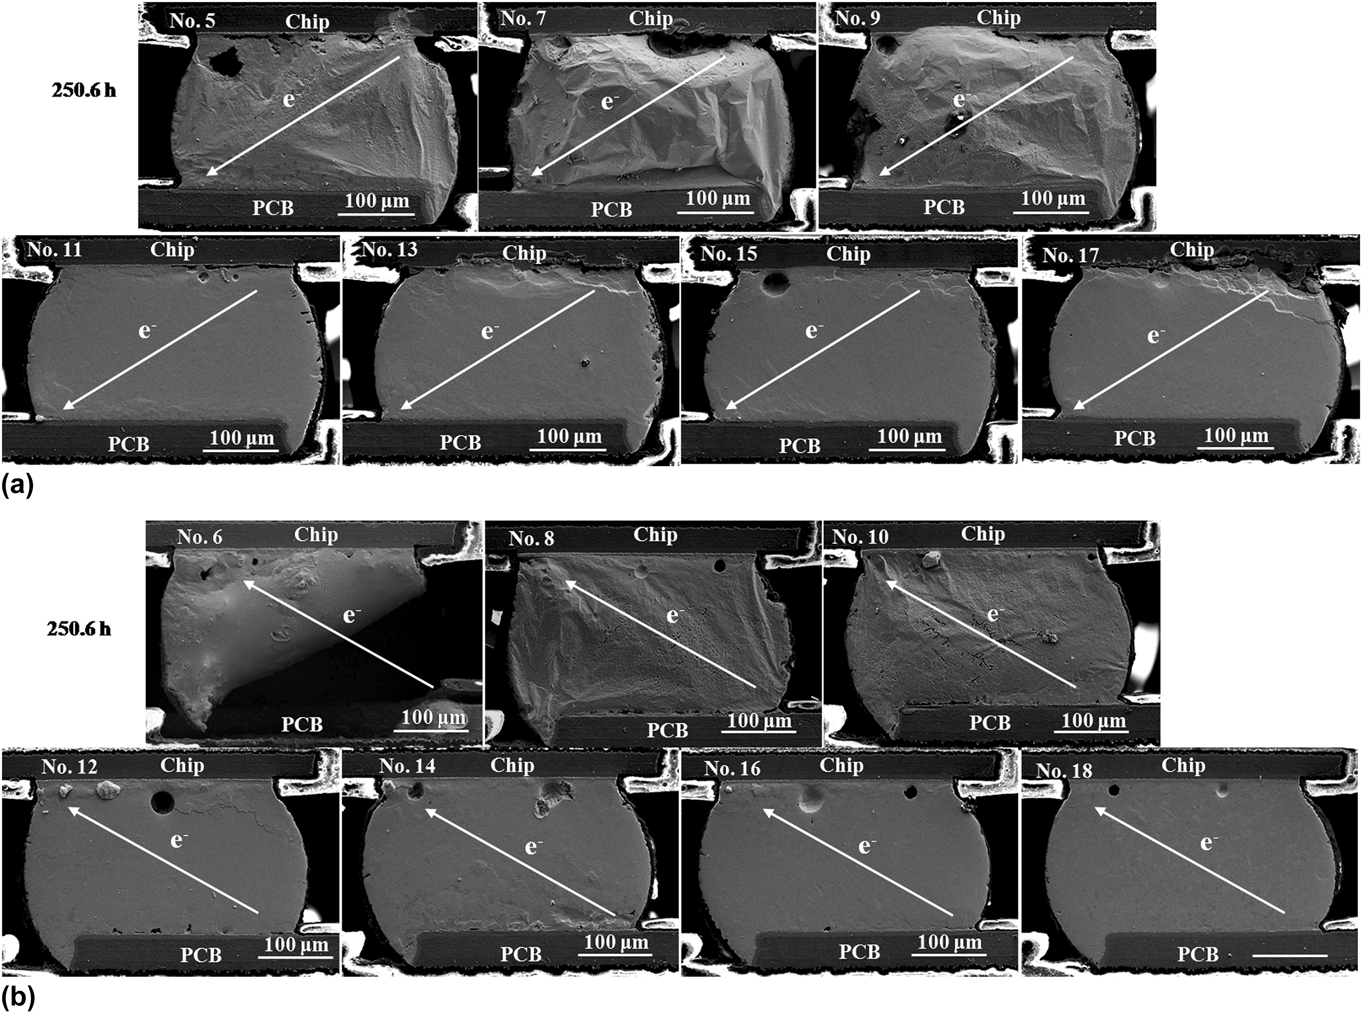
Figure 7 shows the cross-sectional microstructure of the failed solder bumps after EM for 250.6 h. The last 40 min was regarded as the last stage of the lifetime of solder bumps. It was identified that the failure occurred in the No. 6 solder bump, in which part of the solder bump remained on the Ni UBM at the chip side while the other solder at the PCB side disappeared, as shown in Fig. 7(b). The Cu pad on the PCB was completely consumed, which indicates that the local fusion of the solder bump occurred and induced the final failure.
Cross-sectional microstructure of Nos. 5–18 solder bumps after EM for 250.6 h. (a) Electrons flowing from chip to PCB and (b) electrons flowing from PCB to chip.
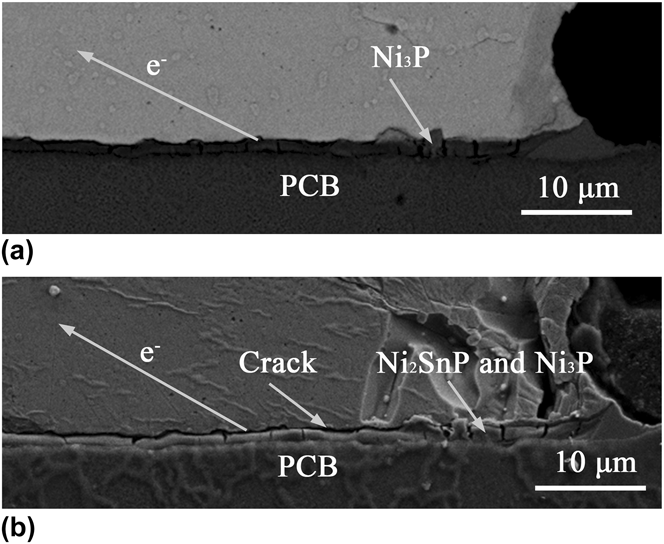
Figure 8 shows the enlarged SEM images of the electron-entrance corner of the No. 6 solder bump after EM for 50 and 250 h, respectively. EM significantly accelerated the dissolution of Ni atoms from both interfacial Ni3Sn4 IMC and Ni–P pad. As shown in Fig. 8(a), after EM for 50 h, the Ni–P pad was completely consumed, which resulted in the formation of Ni3P layer. As shown in Fig. 8(b), after EM for 200 h, the Ni3P layer further transformed into Ni3P/Ni2SnP and crack initiated and propagated throughout the Ni3P/Ni2SnP and solder interface. The formation of cracks consequently reduced the effective contact area of current path in the solder bump, which caused even more serious current crowding and Joule heating. As a result, local fusion of the solder bump occurred. Due to surface tension and protection from the underfill, the solder bump could maintain its initial shape even after melting. However, the Ni3P and Ni2SnP layers as well as Cu pad rapidly dissolved into the molten solder. Because the organic layer on the PCB did not wet with the molten solder, part of the molten solder eventually fell off after the Cu pad was completely consumed, which induced the final failure.
Enlarged SEM images of the electron-entrance corner in the No. 6 solder bump after EM for (a) 50 h and (b) 250 h.
It is noted that the fusion of No. 6 solder bump had a significant effect on the morphology of the adjacent solder bumps. As shown in Fig. 7, the adjacent Nos. 5, 7, 8, 9, and 10 solder bumps became uneven and bulging outward, whereas the other far away solder bumps had no significant changes. It is considered that the morphological changes of the adjacent solder bumps were caused by the local fusion of the No. 6 solder bump.
F. Effect of stress relaxation on EM reliability
EM causes a net atomic transport along the flowing direction of electrons. The atoms pile up at the anode, whereas vacancies gather at the cathode. As a result, back stress is induced from the anode to the cathode during EM. The stress was released in terms of forming hollows at the cathode, hillocks at the anode, and sliding Sn grain boundary in the solder bump. On the basis of the Nabarro–Herring modelReference Herring13 of the equilibrium vacancy concentration, the atomic flux under a combined electrical and back stress is expressed as:
 $$J = C{D \over {kT}}{Z^*}e\rho j - C{D \over {kT}}{{\Omega {\mathop{\rm d}\nolimits} \sigma } \over {{\mathop{\rm d}\nolimits} \,x}}\quad ,$$
where C is the atomic density, D/kT is the atomic mobility, Z* is the effective charge number, e is the electronic charge, ρ is the resistivity of solder bump, j is the current density, σ is the hydrostatic stress, dσ/dx is the stress gradient, and Ω is the atomic volume. The first part represents the flux induced by EM, whereas the second part represents the opposite flux induced by the back stress. A large atomic diffusion flux could induce the failure of solder bumps due to the void formation-and-propagation or the rapid dissolution of UBM at the cathode interfaces.Reference Ke, Yang, Lai and Kao18,Reference Chen, Lin and Jao19 Therefore, the back stress flux has a positive effect on retardation of EM failure. However, due to a large amount of lattice sites are created and destroyed at the anode and cathode during stress relaxation, respectively, the back stress is reduced and so the effect of back stress on retardation of EM is less.Reference Ouyang, Chen, Tu and Lai5,Reference Wei and Chen20
The stress relaxation behavior may directly result in the failure of solder bumps. The void formation-and-propagation at the cathode can induce the open circuit of solder bump; the growth of hillocks at the anode can induce the short circuit between neighboring solder bumps; the Sn grain boundary sliding can induce microdeformation in the solder bumps. Therefore, the stress relaxation behavior deteriorated the EM reliability of solder bumps. Because of the symmetrical structure, there should be no differences in the current and stress distributions between the polished half-size solder bumps and the intact solder bumps. Therefore, the stress relaxation behavior in the polished half-size solder bumps is representative, and the in situ observation of the EM-induced damages of polished half-size solder bumps will provide insight into the failure mechanism of intact solder bumps undergoing EM.
IV. CONCLUSIONS
(1) The anode was in compression while the cathode was in tension undergoing EM, due to the directed flows of atoms toward the anode and vacancies toward the cathode. The stress relaxation of Sn–3.0Ag–0.5Cu flip-chip solder bumps was in diffusion creep regime.
(2) At the cathode, hollows with terrace morphology formed to relieve the tensile stress. The selected dissolution of Ni UBM on the chip occurred, which was subjected to the orientation of Sn grain, whereas no obvious dissolution of ENEPIG finish on the PCB occurred.
(3) At the current crowding corner of the anode, recrystallization of Sn grains occurred and hillocks were extruded to relieve the compressive stress. More hillocks formed at the anode–chip side than at the anode–PCB side due to a higher current crowding density.
(4) In the solder bumps, Sn grain boundary sliding that occurred to accommodate the diffusion creep was more pronounced with increasing EM time. Grain boundary sliding is considered to be an indispensable requisite for diffusion creep.
(5) The final EM-induced failure mode was the local fusion of solder bump resulting from the crack formation and propagation at the cathode.
ACKNOWLEDGMENTS
This work is supported by the National Natural Science Foundation of China under Grant Nos. 51475072 and 51171036. The helpful discussion with Prof. J.S. Zhang is appreciated.