High-entropy alloys (HEAs) were originally suggested as possessing a single-phase structure.[ Reference Yeh, Chen, Lin, Gan, Chin, Shun, Tsau and Chang 1 ] The high configurational entropy due to the presence of multiple elements is believed to facilitate stability of such single phase[ Reference Sheng and LIU 2 , Reference Anand, Goodall and Freeman 3 ] via an entropic reduction of the Gibbs free energy. Single-phase HEAs, including CoCrFeNi,[ Reference Lucas, Wilks, Mauger, Munoz, Senkov, Michel, Horwath, Semiatin, Stone and Abernathy 4 ] CoCrFeMnNi,[ Reference Cantor, Chang, Knight and Vincent 5 ] NbMoTaVW,[ Reference Senkov, Wilks, Scott and Miracle 6 , Reference Senkov, Wilks, Miracle, Chuang and Liaw 7 ] and HfNbTaTiZr,[ Reference Senkov, Scott, Senkova, Miracle and Woodward 8 ] are of current interest for improved mechanical properties and new functionalities.[ Reference Kozak, Sologubenko and Steurer 9 ] Refractory HEA systems are potential candidate materials for high-temperature applications.[ Reference Senkov, Wilks, Scott and Miracle 6 – Reference Senkov, Scott, Senkova, Miracle and Woodward 8 ]
The claim of “single-phase” status is often based on bulk x-ray diffraction (XRD) results. Alloys that appear to be single phase in standard XRD may be revealed by high-energy XRD to consist of multiple phases.[ Reference Dahlborg, Cornide, Calvo-Dahlborg, Hansen, Fitch, Leong, Chambreland and Goodall 10 ] Phase structure is usually sensitive to the processing procedures. For example, decomposition of single-phase HEAs due to heat treatment has been reported in several recent studies.[ Reference Otto, Dlouhý, Pradeep, Kuběnová, Raabe, Eggeler and George 11 – Reference He, Wang, Wu, Li, Wang and Liu 15 ] The existence of elemental segregation is common in the as-solidified refractory HEA systems. In this study, the details on how a complex septenary refractory HEA alloy, CrMoNbReTaVW, appear to possess a single-phase structure according to standard XRD are examined.
To understand the development of “single-phase-like” microstructure, a CALculation of PHAse Diagrams (CALPHAD) approach[ Reference Saunders and Miodownik 16 ] is employed on a new septenary HEA system—CrMoNbReTaVW. Accompanying experimental materials characterization was performed through XRD, scanning electron microscopy (SEM), energy-dispersive spectroscopy (EDS), electron backscatter diffraction (EBSD), and transmission electron microscopy (TEM). Rather than a continuous variation in composition across the entire specimen, compositional segregation in as-solidified CrMoNbReTaVW HEA occurs mainly through a preferential partitioning of refractory elements W, Ta, Re, and Mo first, which forms during the early stage of the solidification process, and of the lower melting temperature elements Cr, Nb, and V into the regions, which form near the end of the solidificaiton process. It is interesting that, despite the significant differences in composition in the W–Ta–Re–Mo-rich grains and the Cr–Nb–V-rich grains, as-solidified septenary CrMoNbReTaVW shows a “single-phase-like” structure according to the standard XRD, such that all observed crystalline diffraction peaks can be indexed to arise from one crystal system only.
CALPHAD calculations were carried out to simulate the solidification process of equimolar CrMoNbReTaVW using the ThermoCalc software package with the TCNI8 database, which incorporates known information for all the binary phases and most ternary phases in the Cr–Mo–Nb–Re–Ta–V–W combinations. Calculations utilizing the TCNI8 database have shown good agreements with experimental observations for various refractory body-center-cubic (BCC) HEAs, such as MoNbTaTiVW,[ Reference Zhang, Gao, Zhang, Yang and Guo 17 ] HfNbTaTiVZr,[ Reference Gao, Zhang, Yang and Guo 18 ] and CrMoNbTaW.[ Reference Zhang, Gao, Zhang and Guo 19 ] In this study, calculations were performed following both the equilibrium solidification scheme and the Scheil–Gulliver solidification scheme,[ Reference Gulliver 20 , Reference Porter and Easterling 21 ] modeling respectively two extreme cooling conditions—annealing-like slow solidification and quenching-like rapid solidification.
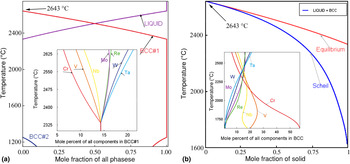
In the equilibrium simulation, solidification proceeds sufficiently slowly such that ample diffusion is allowed to take place in both the liquid and solid states. As shown in Fig. 1(a), equilibrium solidification initiates at ~2643 °C when a single BCC phase (BCC#1) starts to form. The fraction of the BCC#1 phase increases with decreasing temperature and reaches 100% at ~2333 °C, when the solidification process ends. As shown in the inset of Fig. 1(a), the BCC#1 phase starts with enrichment in refractory elements, i.e., the compositions of W, Mo, Ta, and Re are about 15–20 at.% at ~2625 °C, exceeding the equimolar composition of ~14%, with a concomitant depression of the non-refractory elements Cr and V. In the TCNI8 database, the BCC phase is treated with a two sub-lattice model, which assumes that sub-lattice one consists of corners of the cubic lattice and sub-lattice two consists of centers of the cubic lattice. When the fractions of an element in these two sub-lattices are identical, this BCC phase is determined to be a fully disordered one. By checking the elemental site fraction of both sub-lattices in the ThermoCalc simulation for the present case, the BCC#1 phase is found to be a fully disordered solid solution phase. As the temperature decreases, the compositions of the refractory elements within BCC#1 decrease continuously, and converge to the equimolar compositions at the end of equilibrium solidification, at ~2333 °C. From ~2333 to 1250 °C, the equilibrium simulation shows the presence of one single phase, BCC#1. At ~1250 °C, indications of phase separation are seen through the appearance of a second BCC phase (BCC#2), which is dominated by Cr and V (over 75 at.%). The existence of a single-disordered solid solution phase of BCC#1, excluding any possible intermetallic compounds over a wide temperature range of 2333–1250 °C, is indicative of the tendency for the equimolar CrMoNbReTaVW system toward single BCC phase formation.
The solidification process and composition segregation of the CrMoNbReTaVW HEA system predicted by CALPHAD simulations: (a) equilibrium solidification; (b) Scheil–Gulliver solidification.

Conditions for equilibrium are, however, often not reached in actual solidification processes, especially for systems rich in refractory elements. Therefore, the Sheil–Gulliver solidification scheme was also followed to probe the influence of extremely large cooling rate, which is closer to the experimental cooling process. Assumptions made in the Sheil–Gulliver model[ Reference Sheng and LIU 2 Reference Sheng and LIU 2 ] are: (1) zero diffusion in the solid phase and (2) an infinite diffusion rate in the liquid phase. As shown in Fig. 1(b), the effect of turning off solid-state diffusion is significant, even though the solidification process still involves the liquid phase together with a single BCC phase. First, the solidification range is broadened: calculated liquidus and solidus temperatures are now at ~2643 and 1625 °C, respectively. Second, as shown in the inset of Fig. 1(b), which shows compositions of the portion of the BCC phase formed at the corresponding temperature, compositional segregation in the solid phase is accentuated. Similar solid-phase enrichment of Ta, W, Mo, and Re occurs in the beginning of solidification, ~2643 °C. At the end of solidification, ~1625 °C, the solid phase shows significant depression of refractory elements, with the compositions of W, Mo, Ta, and Re approaching zero, while the V and Cr compositions are significantly enhanced, 20–60 at.%. The continuous decrease in refractory element compositions as temperature decreases, coupled with the assumption of zero solid-state diffusion, suggests the possible existence of significant compositional variations in the solid BCC phase as the growth front evolves.
To assess the fidelity of the CALPHAD simulations to the physical situation, experimental characterizations were performed on as-solidified CrMoNbReTaVW HEA specimens. CrMoNbReTaVW HEA specimens were prepared in an arc-melter (Edmund Bühler /MAM-1). Raw metal powders (99.5 at.%) were mixed uniformly in a polystyrene ball mill jar for ~15 min and then melted in a water-cooled copper hearth of the arc melter. The overall specimen compositions were nominally equimolar, based on starting powder proportions. To ensure compositional homogeneity, melted ingots were inverted and re-melted three to four times. After cool down, as-solidified ingots were sectioned using a low-speed saw to expose a flat surface. The exposed surface was successively mechanically polished, before wet-polishing with 1, 0.3, and 0.05 µm Al2O3 suspensions. A PANalytical Empyrean XRD system with CuKα radiation was used to perform XRD measurements. Additional morphological and compositional characterizations were carried out on an FEI Quanta3D FEG dual-beam instrument, which houses a 30 kV field-emission electron column, a 30 kV high-current Ga+ ion column, secondary electron and backscatter electron (SE/BSE) detectors, an EBSD system, an EDS system, and an OmniProbe for specimen lift-out. TEM specimens were prepared following standard site-selective Ga+ milling and lift-out procedures, and final thinned/cleaned in a Gatan PIPS II ion mill using 100 eV Ar+. Bright-field (BF) and phase-contrast electron imaging as well as selected area electron diffraction (SAD) were carried out on a JEOL JEM2011 microscope operated at 200 KV.
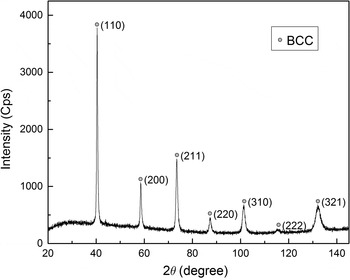
The structure of the CrMoNbReTaVW specimen was first examined by the XRD. A typical symmetrical θ–2θ diffraction pattern obtained from the polished surface of the as-solidified CrMoNbReTaVW specimen is shown in Fig. 2. Corresponding to all observed diffraction peaks, all observed d-spacings can be indexed to a single BCC structure. Through a Nelson–Riley extrapolation of the data shown in Fig. 2, the lattice constant a of this BCC structure was determined to be 0.3151 nm.[ Reference Porter and Easterling 21 ] This “single-phase-like” BCC diffraction pattern appears consistent with the CALPHAD simulations shown in Figs. 1(a) and 1(b), which suggest that the equimolar CrMoNbReTaVW HEA should be predominately single-phase BCC after solidification.
A typical XRD pattern obtained from the as-solidified CrMoNbReTaVW HEA specimen.

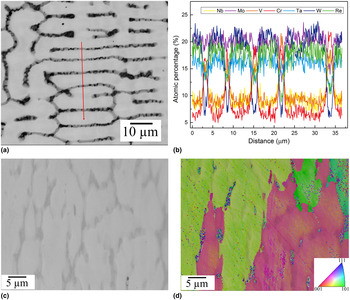
The actual microstructure of as-solidified CrMoNbReTaVW HEA specimen is better illustrated by the BSE image shown in Fig. 3(a), typical of BSE images obtained from the polished specimen surface. The as-solidified microstructure consists of bright regions with branches (10–40 µm in size) together with dark regions. In the BSE image, the bright and dark regions exhibit significant differences in contrast, suggesting compositional segregation. The higher brightness of the bright regions suggests enrichment of higher Z elements. To be more quantitative, EDS line scans were performed across the bright and dark regions [marked in Fig. 3(a)], and the observed elemental compositions are plotted in Fig. 3(b). The bright regions are enriched in refractory elements W, Ta, Re, and Mo, with Cr, Nb, and V compositions below 10 at.%. The elements Cr, Nb, and V are preferentially segregated into the dark regions, where Cr compositions may exceed 20 at.%. One expects that the bright regions were formed at the beginning of the solidification process at higher temperatures, whereas the dark regions were formed toward the end of the solidification process at lower temperatures. Thus, the observed enrichment of refractory elements within the bright regions and their depletion within the dark regions is consistent with the CALPHAD calculations shown in Fig. 1(b), in accordance with the Sheil–Gulliver model prediction. Elements Cr, V, and Nb are enriched in the solid toward the end of the solidification process at lower temperatures, thus are forced into the dark regions. It is also worth noting that: (1) compositional segregations appear to be reasonably abrupt, e.g., sharp rises in Cr and V compositions are observed at the boundaries between the bright regions and the neighboring dark regions; (2) variations in composition exist in individual bright and dark regions, e.g., the Cr compositions differ between the five dark regions shown in Fig. 3. Additional SE imaging and EBSD inverse pole figure mapping, shown in Figs. 3(c) and 3(d), indicate that both the W/Ta/Re/Mo-rich bright regions and the Cr/Nb/V-rich dark regions have the BCC structure. Furthermore, according to the EBSD orientation map, adjacent bright and dark regions are close to each other in crystal orientation.
(a) BSE image of a polished cross-section of the as-solidified CrMoNbReTaVW HEA specimen, the red line marks the location of the EDS line scan measurement; (b) atomic percentages across the EDS measurement line; (c) SE image of the as-solidified CrMoNbReTaVW HEA at the 70° tilt needed for EBSD imaging; (d) corresponding EBSD inverse pole figure mapping on the specimen region shown in (c).

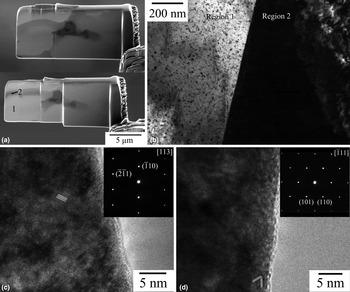
Further structural characterization was carried out with TEM. Site-selective TEM specimens were prepared via FIB to contain both the bright and dark regions. In one such lifted-out lamella, as shown in Fig. 4(a), one marked region (region 1) is a refractory-element-enriched bright region and the adjacent region (region 2) is the Cr, Nb, V-enriched dark region. Figure 4(b) shows a BF image taken around the interface between regions 1 and 2. The sharp boundary between regions 1 and 2 is indicative that these are two crystallographically distinct grains. Phase contrast images taken from the two grains are shown in Figs. 4(c) and 4(d), which clearly demonstrate the single-crystal nature of each grain. The corresponding SAD patterns are shown respectively in the insets of Figs. 4(c) and 4(d), and are indexed respectively to BCC [113] and
 $[\bar 111]$
zone axis patterns. The absence of any extra diffraction spots in the diffraction patterns shown indicates the absence of any second-phase precipitates with a distinct crystal structure. A definitive determination of the exact atomic arrangements responsible for the observed contrast in Fig. 4(b) awaits additional studies in the future.
TEM characterization of the as-solidified CrMoNbReTaVW HEA: (a) SE images of the FIB lift-out before (top) and during (bottom) Ga+ thinning; (b) a BF image of the interface between regions 1 and 2 identified in (a); (c) phase-contrast image of region 1 with the associated SAD pattern shown in the inset; (d) phase-contrast image of region 2 with the associated SAD pattern shown in the inset.

The lattice constants determined from these two SADs, by referencing a Si 〈110〉 zone axis pattern taken at nominally identical microscope settings, are 0.316 and 0.318 nm, respectively. The TEM data shown in Fig. 4 indicate that, despite the significant compositional segregation existing between the bright and dark regions, the crystal structures of these two regions are both BCC. Furthermore, their lattice constants are close in value, to within 1%. Therefore, the TEM results are consistent with the XRD data shown in Fig. 2. From the width of the BCC (110) x-ray peak shown in Fig. 2 (full width at half maximum (FWHM) = 0.353° at 40.399° 2θ), the maximum lattice constant difference within the entire specimen region sampled in the XRD measurement is ~0.0027 nm, or ~1%. Moreover, based on the atomic radii of all participating elements and their corresponding atomic percentages, Fig. 3, the averaged lattice constants are also found to have a variation of 0.0025 nm, or ~1% between the bright and dark regions. The results above show that, as the system attempts to minimize its overall free energy during solidification, including strain energy contributions, it arrives at a microstructure in which bright and dark regions with distinctly different compositions possess the same BCC structure with very similar lattice parameters.
In summary, CALPHAD calculations suggest the tendency of BCC phase formation during solidification of equimolar CrMoNbReTaVW HEA, which is confirmed by structural characterizations with XRD and TEM. The observations of significant compositional segregation between the bright and dark regions, together with compositional variations from one region to another, suggest that the quenching-like rapid solidification, as described by the Sheil–Gulliver model, more closely describes the actual solidification process. Although XRD measurements showed “single-phase-like” diffraction patterns, clear evidence of significant compositional segregation within as-solidified CrMoNbReTaVW HEAs is obtained from BSE imaging and EDS line scans. TEM examinations show distinct grains crystallize in the same BCC structure with close lattice parameters, despite the significant compositional segregation, thus corroborating the observed “single-phase-like” XRD patterns. It is suggested that the existence of multiple grains with significant compositional differences yet identical crystal structure and similar lattice constants may be a common feature in other compositionally segregated HEA systems.
Acknowledgments
The current work is funded in part by the NSF EPSCoR CIMM project under award #OIA-1541079 and LA BoR LEQSF(2013-16)-RD-B-01. The use of the LSU Shared Instrumentation Facility (SIF), a part of the CIMM Core User Facilities (CUFs), is acknowledged.