





Suicide is a major public health and psychiatric concern globally. Whereas psychiatric disorders are established risk factors for suicide, suicidal behaviour may also represent an early indicator of underlying mental illness. One systematic review of psychological autopsy studies found that approximately 10% of individuals who die by suicide have no identifiable psychiatric illness. Reference Cavanagh, Carson, Sharpe and Lawrie1 Recent meta-analytic evidence further indicates that clinical factors, particularly mental disorders and prior self-harm, show the strongest associations with suicide, whereas broader psychosocial and sociodemographic factors tend to exhibit comparatively smaller effect sizes. Reference Favril, Yu, Uyar, Sharpe and Fazel2 Another review conducted across multiple countries reported that, among studies assessing only Axis I disorders, up to 66.7% of suicide cases had no psychiatric diagnosis; in studies evaluating both Axis I and personality disorders, 37.1% had no diagnosis; and in studies considering Axis I as well as subthreshold or mild conditions, 37% had no such conditions. Reference Milner, Sveticic and De Leo3 Although mental disorders, including depression and psychotic illnesses, are well-established risk factors for suicide, these findings collectively indicate that a substantial proportion – ranging from 10 to 66.7% – of individuals who die by suicide have no recorded psychiatric diagnosis. This raises a critical question: whether conventional suicide risk indicators differ between suicide decedents with and without a recorded psychiatric diagnosis prior to death.
Several population-based and registry studies have directly compared suicide decedents with and without recorded psychiatric diagnoses. For example, Stone et al reported that a substantial proportion of suicide decedents had no documented mental health diagnosis at the time of death, and they differed from diagnosed individuals in patterns of healthcare utilisation and life stressors. Reference Stone, Simon, Fowler, Kegler, Yuan and Holland4 Similarly, Kim et al found that individuals without psychiatric diagnoses were more likely to be characterised by acute situational crises and lower engagement with mental health services. Reference Kim, Kim, Lee, Choi, Yook and Shin5 A recent review by Sher further emphasised that non-psychiatric suicide cases often present distinct profiles, including fewer prior clinical contacts but comparable exposure to psychosocial stressors. Reference Sher6
Although relatively uncommon, suicide among individuals without identifiable psychiatric diagnoses has been documented across multiple settings. Prior studies have reported associations with acute life stressors, relationship problems, legal or disciplinary issues, social disconnection and specific personality traits. Reference Stone, Simon, Fowler, Kegler, Yuan and Holland4,Reference Kleinhendler-Lustig, Hamdan, Mendlovic and Gvion7–Reference Bi, Liu, Zhou, Fu, Qin and Wu10 These findings suggest that a range of psychosocial and behavioural factors may contribute to suicide risk outside clinically recognised psychiatric conditions.
Identifying suicide risk among individuals without formal psychiatric diagnoses is critical, because it highlights potential gaps in detection and access to mental healthcare. Using linked mortality and health record data from UK Biobank – a large, population-based cohort not limited to clinical samples – this study aims to examine the demographic and clinical characteristics of individuals who died by suicide, comparing those with and without documented psychiatric diagnoses. This approach allows for insights that may be more generalisable to real-world populations beyond clinical settings.
Despite extensive psychological autopsy research, population-based evidence directly comparing suicide decedents with versus without recorded psychiatric diagnoses remains limited, particularly outside clinical or forensic settings. Prior studies largely focused on the presence of psychiatric disorders rather than assessing whether commonly cited psychosocial markers retain practical discriminative value for undiagnosed cases in non-clinical populations. Reference Cavanagh, Carson, Sharpe and Lawrie1,Reference Milner, Sveticic and De Leo3,Reference Kim, Kim, Lee, Choi, Yook and Shin5,Reference Joiner, Buchman‐Schmitt and Chu11
In the present study, the term ‘detection gap’ refers not only to potentially underrecognised psychiatric disorders, but more broadly to the possibility that certain pathways to suicide vulnerability may not be adequately identified through diagnosis-centred psychiatric detection frameworks alone, even among individuals without recorded psychiatric diagnosis. To our knowledge, no prior study has leveraged a population-based cohort with comprehensive health record linkage to evaluate this question from a detection-gap perspective. Accordingly, this study compares sociodemographic, psychosocial and service use characteristics of suicide decedents with and without recorded psychiatric diagnoses within the UK Biobank cohort, examining whether conventional indicators meaningfully differentiate undiagnosed individuals.
This analysis was designed as a hypothesis-informed exploratory study, with variables selected a priori based on domains consistently identified in prior literature on suicide risk, while also reflecting the structure and availability of measures within the data-set.
Method
Data source and extraction
We used data from UK Biobank, a population-based prospective cohort of approximately 502 000 participants aged 40–69 years recruited between 2006 and 2010, with longitudinal linkage to hospital episode statistics and national death registries. Reference Allen, Sudlow, Downey, Peakman, Danesh and Elliott12,Reference Sudlow, Gallacher, Allen, Beral, Burton and Danesh13
Data access, cohort-building and variable export were performed in a secure cloud environment via the Compass platform (Cipherome, Inc., San Jose, California, USA), which provides a structured environment for variable selection, cohort definition and reproducible data extraction.
Cohort selection and grouping
From the ∼500 000 UK Biobank participants, we identified 194 individuals whose underlying cause of death was suicide based on ICD-10 codes for intentional self-harm (X60–84), and included these as the analytic sample. Deaths of undetermined intent (Y10–34) were not included in the primary analysis. Reference Penfold, Johnson, Shortreed, Ziebell, Lynch and Clarke14
Decedents were classified into two groups according to recorded mental and behavioural disorder diagnoses prior to death: those with any ICD-10 F-chapter code (F00–99; psychiatric diagnosis, PtD) and those without such codes (no psychiatric diagnosis, NPD).
The selection of variables was guided by prior literature on established suicide risk indicators, including demographic, clinical, psychosocial and behavioural factors, while also reflecting the availability of measures within the UK Biobank data-set. Accordingly, the analytic approach was hypothesis-informed but retained an exploratory component.
Psychosocial and mental health variables were derived from baseline self-reported assessments, reflecting symptoms and traits measured prior to death rather than at or near the time of death.
Variables
For comparison of PtD and NPD, we extracted harmonised measures spanning demographics, lifestyle, physical health, psychosocial characteristics, mental health, service use and area-level context. Demographics included age, sex/gender, race and year of birth; household/context variables included number of vehicles and willingness to attempt cognitive tests. Lifestyle and tobacco exposure comprised smoking status (current, past, ever), current tobacco use, smokers in household, exposure to tobacco smoke at home and outside, maternal smoking around birth and past tobacco smoking. Physical health included diabetes mellitus, hypertension, hyperlipidaemia, body mass index (BMI) and medication categories (immunosuppressants, anti-inflammatory agents, anti-hypertensives, lipid-lowering agents and anti-diabetic drugs). Psychosocial and mental health variables were grouped into domains reflecting social support and connectedness, mood and affect, anxiety- and stress-related symptoms, trait-related indicators, personality and mental health service use. Social support and connectedness included ability to confide, frequency of family/friend visits and participation in leisure/social activities. Mood and affect variables included fed-up feelings, depressed mood (past 2 weeks), anhedonia (past 2 weeks), lethargy (past 2 weeks), guilty feelings and feeling miserable. Anxiety- and stress-related variables included anxiety/tenseness (past 2 weeks), nervous feelings, worrying/anxious feelings, tense/highly strung, suffering from nerves, worrying too long following embarrassment, external stress in the past 2 years and irritability. Trait-related indicators included mood swings, sensitivity/hurt feelings and risk-taking. Personality was indexed by Eysenck Personality Questionnaire–Revised Short-Form neuroticism level. Mental health service utilisation captured having seen a psychiatrist or general practitioner (GP) for nerves, anxiety, tension or depression. Area-level socioeconomic context comprised education, employment, health, housing and income scores, and the Index of Multiple Deprivation (IMD), with additional environment and access metrics (living environment, community safety, physical environment, access to services and crime scores). In the present analysis we used the overall IMD and domain-specific deprivation scores, including income, employment, health, education and housing scores. For participants residing in England, the following UK Biobank fields were used: IMD, Field 26410; income score, Field 26411; employment score, Field 26412; health score, Field 26413; education score, Field 26414; and housing score, Field 26415. Higher scores indicate greater area-level deprivation. Descriptive statistics are presented as mean ± standard deviation. For mechanism-specific documentation, we also retained a coding indicator identifying suicide deaths involving self-inflicted poisoning by domestic gases. A detailed summary of analytic domains and included variables is provided in Supplementary Table 1. Variables were selected a priori based on established risk factors identified in prior literature on suicide, while also considering the structure and availability of measures within the database.
Statistical analysis
Continuous variables were summarised as mean ± standard deviation and compared between PtD and NPD using independent t-tests (or Mann–Whitney U-tests when assumptions were not met). Categorical variables were summarised as counts (%) and compared using chi-square tests (or Fisher’s exact tests for sparse cells). Two-sided p < 0.05 was considered statistically significant. For families of psychosocial and mental health comparisons. Analyses were conducted on available cases; variable-wise missingness is reported in the summary tables.
To further examine associations between psychosocial variables and psychiatric diagnosis status, logistic regression analyses were performed with PtD versus NPD as the dependent variable. Unadjusted models were first fitted separately for each variable; minimally adjusted models were then conducted to account for basic confounding and partially overlapping psychosocial constructs.
In addition, to address the interrelated nature of psychosocial variables while avoiding overfitting given the modest sample size, we implemented domain-specific multivariable logistic regression models. Variables were grouped into conceptual domains (e.g. mood, anxiety, personality traits and mental health service use), and separate models were constructed within each domain. Each model included age and gender as covariates, along with a limited number of related variables within the same domain. This parsimonious modelling strategy was used to balance adjustment for confounding with model stability and interpretability.
Odds ratios and 95% confidence intervals are reported. Continuous variables were modelled per unit increase, and categorical variables were coded as indicated.
Statistical analyses were performed using Python for Linux (version 3.14.6; Python Software Foundation, Wilmington, Denver, USA; https://www.python.org/downloads/release/python-3146/) with the NumPy, pandas (version 3.0.5), SciPy and statsmodels (version 0.14.6) packages.
Ethical standards
All procedures were approved by the Institutional Review Board of Kangwon National University (no. KWNUIRB-2025-05-015) and conducted in accordance with the Declaration of Helsinki. This study was conducted using the UK Biobank resource under application no. 52031.
Results
Among the entire UK Biobank cohort, 194 individuals were identified as suicide decedents. Of these, 109 individuals (56.2%) had documented psychiatric diagnoses (PtD group), with 84 individuals (43.8%) having no such diagnoses (NPD group). To further characterise the PtD group, the distribution of broad psychiatric diagnostic categories is summarised in Supplementary Table 2. Depressive disorders were the most frequently recorded diagnoses (56.0%), followed by anxiety disorders (45.0%). Because participants could have multiple psychiatric diagnoses, diagnostic categories were not mutually exclusive and percentages do not sum to 100%. Males accounted for 73.7% of all suicide decedents (71.6% in the PtD group versus 76.5% in the NPD group), with no statistically significant difference between groups (p = 0.54).
The distribution of comorbid physical illnesses by organ system (e.g. cardiovascular, respiratory, neurological, etc.) showed similar patterns across groups (Fig. 1).
Distribution of comorbid physical illnesses by organ system among suicide decedents. Number of suicide decedents with comorbid physical illnesses across major organ systems, stratified by psychiatric diagnosis status. Bars represent counts of individuals with at least one diagnosis in each system: psychiatric diagnosis prior to death (PtD; solid black bars) and no psychiatric diagnosis (NPD; hatched white bars).

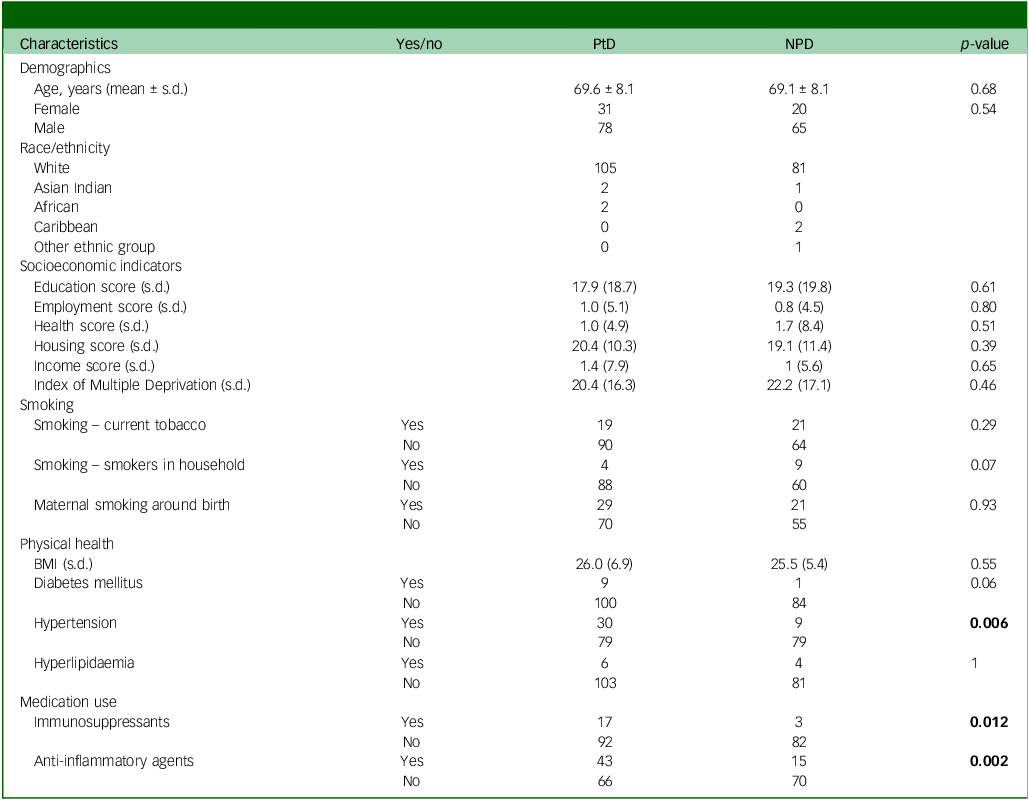
No significant between-group differences were observed for socioeconomic indicators (Table 1), including education score (p = 0.61), employment score (p = 0.80), health score (p = 0.51), housing score (p = 0.39), income score (p = 0.65) or IMD score (p = 0.46). Notably, none of the individuals in either group reported planning suicide. There were no significant differences between groups in smoking-related variables (current tobacco use, smokers in the household, maternal smoking around birth), diabetes mellitus, hyperlipidaemia or BMI. However, hypertension (p = 0.006), as well as the use of immunosuppressants (p = 0.012) and anti-inflammatory agents (p = 0.002), were significantly more prevalent in the PtD group.
Baseline demographic, socioeconomic and clinical characteristics of suicide decedents

Table 1 Long description
A table comparing demographic, socioeconomic, and clinical characteristics of suicide decedents. The table has 23 rows and 5 columns. The columns are labeled Characteristics, Yes/no, PtD, NPD, and P-value. The rows are grouped under different headings: Demographics, Socioeconomic indicators, Smoking, Physical health, and Medication use. Each row provides specific data points under these headings. For example, under Demographics, the table lists Age, Female, Male, and various ethnic groups. Under Socioeconomic indicators, it lists Education score, Employment score, Health score, Housing score, Income score, and Index of Multiple Deprivation. Under Smoking, it lists Smoking – current tobacco, Smoking – smokers in household, and Maternal smoking around birth. Under Physical health, it lists BMI, Diabetes mellitus, Hypertension, and Hyperlipidaemia. Under Medication use, it lists immunosuppressants and Anti-inflammatory agents. Each row provides specific values for PtD and NPD groups and a P-value indicating statistical significance.
PtD, psychiatric diagnosis prior to death; NPD, no psychiatric diagnosis; BMI, body mass index.
Values are presented as mean ± standard deviation for continuous variables and counts for categorical variables; continuous variables were compared using independent t-tests or Mann–Whitney U-tests where appropriate; categorical variables were compared using chi-square or Fisher’s exact tests.
Socioeconomic deprivation scores were obtained from the UK Biobank Indices of Multiple Deprivation data fields. These scores were derived by UK Biobank by linking participants’ baseline residential postcode output areas to government-published, small-area deprivation indices. Values are presented as mean ± standard deviation. Higher scores generally indicate greater levels of the respective domain, as defined within the UK Biobank data-set. BMI was calculated as weight in kilograms divided by height in metres squared. Physical health conditions and medication use were based on self-reported medical history and medication records. Bold values indicate statistical significance (p < 0.05).
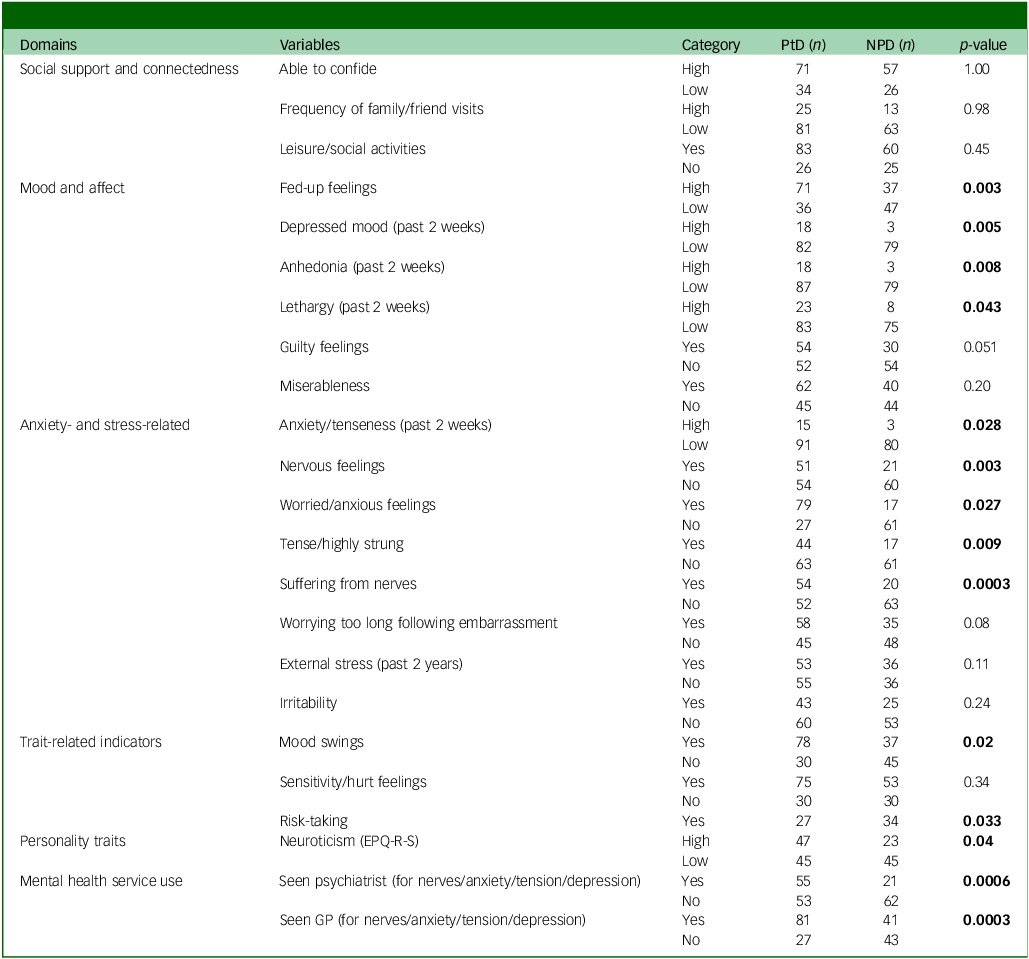
Psychosocial and mental health variables are presented in Table 2 and Fig. 2. Social support (ability to confide, p = 1.00) and social connectedness (frequency of friend or family visits, p = 0.98) did not differ significantly between groups. Anxiety (p = 0.028), lethargy (p = 0.043), anhedonia (p = 0.008) and neuroticism (p = 0.04) were significantly higher in the PtD group compared with the NPD group. Most notably, the proportions of individuals who had seen a psychiatrist for nerves, anxiety, tension or depression (p = 0.0006), and those who had seen a GP for these concerns (p = 0.0003), were significantly higher in the PtD group than in the NPD group.
Group comparison of psychosocial and mental health variables

Table 2 Long description
A table comparing psychosocial and mental health variables between two groups, PtD and NPD. The table has 5 domains, 21 variables, 2 categories, and P-values for each variable. Domains include Social support and connectedness, Mood and affect, Anxiety- and stress-related, Trait-related indicators, Personality traits, and Mental health service use. Each domain lists variables with categories High, Low, Yes, or No, and the number of individuals (n) in each category for PtD and NPD groups. P-values indicate the significance of differences between the groups. Notable variables with significant P-values include Fed-up feelings (0.003), Depressed mood (0.005), Anhedonia (0.008), Lethargy (0.043), Anxiety/tenseness (0.028), Nervous feelings (0.003), Worried/anxious feelings (0.027), Tense/highly strung (0.009), Suffering from nerves (0.0003), Mood swings (0.02), Risk-taking (0.033), Neuroticism (0.04), Seen psychiatrist (0.0006), and Seen GP (0.0003).
PtD, psychiatric diagnosis prior to death; NPD, no psychiatric diagnosis; EPQ-R-S, Eysenck Personality Questionnaire–Revised Short-Form; GP, general practitioner.
Values are presented as counts. Categorical variables were compared using chi-square or Fisher’s exact tests where appropriate. Psychosocial and mental health variables were derived from baseline self-reported questionnaire items in UK Biobank. Variables reflecting recent symptoms (e.g. ‘past 2 weeks’) indicate self-reported frequency of symptoms during the specified period, whereas personality-related variables (e.g. neuroticism) reflect trait-level characteristics. Binary classifications (e.g. ‘high’ versus ‘low’ or ‘yes’ versus ‘no’) were defined based on response categories indicating higher frequency or presence of symptoms, as specified in the UK Biobank data fields. Bold values indicate statistical significance (p < 0.05).
Significant differences in psychological and behavioural traits between PtD and NPD groups. Bar charts depict the proportion (%) of participants in the PtD (solid black bars) and NPD groups (hatched bars) across categories (high/low or yes/no) for psychological and behavioural variables that demonstrated statistically significant group differences. Only those variables meeting the predefined significance threshold (two-sided test, p < 0.05, multiple testing-corrected) are shown. PtD, psychiatric diagnosis prior to death; NPD, no psychiatric diagnosis; EPQ-R-S, Eysenck Personality Questionnaire–Revised Short-Form; GP, general practitioner.

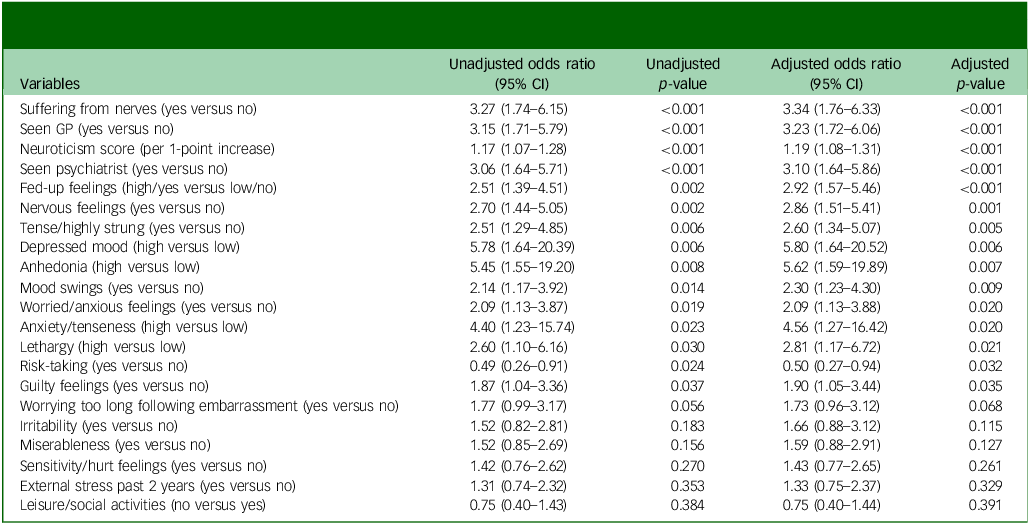
Psychosocial and mental health variables were further examined using logistic regression analyses (Table 3). In unadjusted analyses, multiple variables including depressed mood, anhedonia, anxiety/tenseness, nervous feelings and neuroticism were significantly associated with psychiatric diagnosis status. Similarly, healthcare utilisation variables, including prior contact with psychiatrists and GPs, showed strong associations with PtD status.
Unadjusted and minimally adjusted logistic regression analyses of psychosocial and mental health variables associated with psychiatric diagnosis status (PtD versus NPD) among suicide decedents

Table 3 Long description
A table comparing unadjusted and adjusted odds ratios for various psychosocial and mental health variables associated with psychiatric diagnosis status among suicide decedents. The table has 20 rows and 5 columns. The columns are labeled as follows: Variables, Unadjusted odds ratio (95% CI), Unadjusted p-value, Adjusted odds ratio (95% CI), and Adjusted p-value. The rows list different variables such as suffering from nerves, seen GP, neuroticism score, seen psychiatrist, and others. Each row provides the unadjusted odds ratio with a 95% confidence interval, the unadjusted p-value, the adjusted odds ratio with a 95% confidence interval, and the adjusted p-value for each variable. Notable trends include significant associations between psychiatric diagnosis status and variables like depressed mood, anhedonia, anxiety/tenseness, nervous feelings, neuroticism, and healthcare utilization variables such as prior contact with psychiatrists and GPs.
PtD, psychiatric diagnosis prior to death; NPD, no psychiatric diagnosis; GP, general practitioner.
Psychiatric diagnosis status (PtD versus NPD) was used as the dependent variable. Odds ratios and 95% confidence intervals were estimated using logistic regression models. Unadjusted models were fitted separately for each variable. Minimally adjusted models were performed to account for basic confounding and interrelated psychosocial constructs. Continuous variables were modelled per unit increase, and categorical variables were coded as indicated. Analyses were conducted on available cases.
These patterns remained broadly consistent in minimally adjusted models, with most effect estimates showing limited attenuation. However, given the conceptual overlap among many psychosocial variables, these findings should be interpreted as exploratory and descriptive rather than reflecting independent effects.
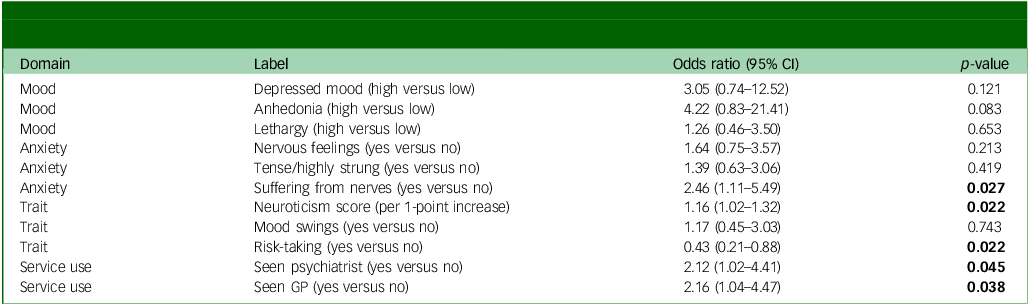
To address this limitation, we conducted domain-specific, multivariable logistic regression analyses (Table 4). Within the mood domain, associations for depressed mood (odds ratio 3.05, 95% CI 0.74–12.52, p = 0.121), anhedonia (odds ratio 4.22, 95% CI 0.83–21.41, p = 0.083) and lethargy (odds ratio 1.26, 95% CI 0.46–3.50, p = 0.653) were attenuated and no longer statistically significant following adjustment.
Domain-specific multivariable logistic regression models examining adjusted associations between psychosocial variables and psychiatric diagnosis status (PtD versus NPD) among suicide decedents

Table 4 Long description
A table with 11 rows and 4 columns. The columns are labeled Domain, Label, Odds ratio (95% CI), and P-value. The table examines the association between various psychosocial variables and psychiatric diagnosis status among suicide decedents. Row 1: Domain, Mood; Label, Depressed mood (high versus low); Odds ratio (95% CI), 3.05 (0.74-12.52); P-value, 0.121. Row 2: Domain, Mood; Label, Anhedonia (high versus low); Odds ratio (95% CI), 4.22 (0.83-21.41); P-value, 0.083. Row 3: Domain, Mood; Label, Lethargy (high versus low); Odds ratio (95% CI), 1.26 (0.46-3.50); P-value, 0.653. Row 4: Domain, Anxiety; Label, Nervous feelings (yes versus no); Odds ratio (95% CI), 1.64 (0.75-3.57); P-value, 0.213. Row 5: Domain, Anxiety; Label, Tense/highly strung (yes versus no); Odds ratio (95% CI), 1.39 (0.63-3.06); P-value, 0.419. Row 6: Domain, Anxiety; Label, Suffering from nerves (yes versus no); Odds ratio (95% CI), 2.46 (1.11-5.49); P-value, 0.027. Row 7: Domain, Trait; Label, Neuroticism score (per 1-point increase); Odds ratio (95% CI), 1.16 (1.02-1.32); P-value, 0.022. Row 8: Domain, Trait; Label, Mood swings (yes versus no); Odds ratio (95% CI), 1.17 (0.45-3.03); P-value, 0.743. Row 9: Domain, Trait; Label, Risk-taking (yes versus no); Odds ratio (95% CI), 0.43 (0.21-0.88); P-value, 0.022. Row 10: Domain, Service use; Label, Seen psychiatrist (yes versus no); Odds ratio (95% CI), 2.12 (1.02-4.41); P-value, 0.045. Row 11: Domain, Service use; Label, Seen GP (yes versus no); Odds ratio (95% CI), 2.16 (1.04-4.47); P-value, 0.038.
PtD, psychiatric diagnosis prior to death; NPD, no psychiatric diagnosis; GP, general practitioner.
Psychiatric diagnosis status (PtD versus NPD) was used as the dependent variable. Odds ratios and 95% confidence intervals were estimated from multivariable logistic regression models. Each domain-specific model included age and gender as covariates, along with selected psychosocial variables within the same domain to account for interrelated constructs. These models were designed to evaluate adjusted associations within domains rather than to identify fully independent predictors across all variables. Continuous variables were modelled per unit increase, and categorical variables were coded as indicated. Analyses were conducted on available cases. Bold values indicate statistical significance (p < 0.05).
By contrast, within the anxiety domain, ‘suffering from nerves’ remained significantly associated with PtD status (odds ratio 2.46, 95% CI 1.11–5.49, p = 0.027) whereas other variables such as nervous feelings and tense/highly strung were not significant following adjustment.
Within the personality domain, neuroticism remained independently associated with PtD status (odds ratio 1.16 per 1-point increase, 95% CI 1.02–1.32, p = 0.022) whereas mood swings were not significant. Interestingly, risk-taking showed an inverse association (odds ratio 0.43, 95% CI 0.21–0.88, p = 0.022).
Within the service use domain, both prior psychiatric consultation (odds ratio 2.12, 95% CI 1.02–4.41, p = 0.045) and GP visits (odds ratio 2.16, 95% CI 1.04–4.47, p = 0.038) remained significantly associated with PtD status.
These findings are summarised in Fig. 3, which illustrates adjusted odds ratios across all variables. Notably, although many variables appeared significant in univariate analyses, several associations were attenuated or became non-significant following multivariable adjustment, highlighting the influence of overlapping psychosocial constructs.
Adjusted associations of psychosocial, behavioural and service use variables with psychiatric diagnosis status among suicide decedents. Forest plot showing adjusted odds ratios (ORs) and 95% confidence intervals for associations among psychosocial, behavioural and mental health service use variables and psychiatric diagnosis status (PtD versus NPD) among suicide decedents. Odds ratios were estimated using multivariable logistic regression models adjusted for age and gender. For categorical variables, odds ratios represent comparisons between indicated categories (e.g. high versus low or yes versus no), whereas continuous variables (neuroticism) were modelled per 1-point increase. The vertical dashed line indicates the null value (odds ratio 1). Points represent adjusted odds ratios and horizontal lines indicate 95% confidence intervals. Variables with confidence intervals not crossing 1 are considered statistically significant at p < 0.05. GP, general practitioner; PtD, psychiatric diagnosis prior to death; NPD, no psychiatric diagnosis.

Overall these results suggest that, although multiple psychosocial and behavioural factors are associated with psychiatric diagnosis status, relatively few variables retain independent associations after accounting for interrelated domains.
Importantly, the absence of statistically significant associations for several variables should not be interpreted as evidence of equivalence between groups, but rather may reflect limited statistical power and overlapping constructs.
Discussion
In this study, using data from Biobank, we compared suicide decedents who had received at least one psychiatric diagnosis prior to death with those who had no such diagnosis. To the best of our knowledge, this is the first investigation employing this large, well-characterised cohort to directly examine differences between these two groups. By doing so, we sought to evaluate whether the prevailing framework, focusing primarily on undetected or unrecognised psychiatric patients, is indeed justified. No statistically significant differences were observed between groups. These findings do not support equivalence and may reflect limited statistical power, given the modest sample size. Effect sizes were small and/or inconsistent, indicating that subtle or heterogeneous differences may not have been detected. These results do not imply an absence of vulnerability among undiagnosed decedents; rather, commonly referenced psychosocial markers may have limited discriminative utility in this mortality-confirmed sample. The absence of between-group differences should not be interpreted as evidence that these markers are not associated with suicide risk; rather, such factors may be similarly elevated in both PtD and NPD groups. The findings may be compatible with a detection-gap interpretation, but require confirmation in large and more sensitive studies. Because the present analysis is restricted to comparisons within suicide decedents and does not include a non-suicide control group, conclusions regarding the utility markers for population-level risk detection cannot be drawn.
The NPD group probably represents a heterogeneous population comprising at least two conceptually distinct subgroups: (a) individuals with potentially undetected or subthreshold psychiatric symptoms and (b) individuals whose suicide risk may arise through pathways less well captured by conventional diagnostic frameworks. The present data do not permit differentiation between these pathways, because diagnostic status was defined based on recorded clinical diagnoses. Accordingly, the detection-gap framework should be interpreted as an interpretive framework that highlights the limitations of diagnosis-centred detection strategies, rather than as a definitive explanation of underlying mechanisms.
In a 2017 article, Joiner et al raised concerns regarding the finding that the proportion of suicide decedents with a detected mental disorder in psychological autopsy studies is less than 100%. Reference Joiner, Buchman‐Schmitt and Chu11 They suggested several interpretations: the individual may have had no mental disorder at the time of death, may have had an undetected disorder and/or may have exhibited clinically significant or subclinical psychiatric symptoms that were not recognised. To further investigate this issue, they reviewed 130 case studies of suicide decedents reported in Robins’ (1981) psychological autopsy study. Based on their analysis, they concluded that, without exception, the individuals either met criteria for a diagnosable mental disorder or demonstrated clinically meaningful psychiatric features even if not fully meeting diagnostic thresholds. Reference Joiner, Buchman‐Schmitt and Chu11
Furthermore, a study involving US military veterans reported that fewer than 50% of suicide decedents had a documented psychiatric diagnosis at the time of death. Reference Ilgen, Bohnert, Ignacio, McCarthy, Valenstein and Kim15 Previous studies have identified a range of psychosocial and behavioural factors, including relationship problems, acute stressors, legal difficulties, social disconnection and personality traits, as being associated with suicide among individuals without diagnosed psychiatric disorders. Reference Stone, Simon, Fowler, Kegler, Yuan and Holland4,Reference Sher6–Reference Dwivedi8,Reference Bi, Liu, Zhou, Fu, Qin and Wu10,Reference Marttunen, Henriksson, Isometsa and Heikkinen16 By contrast, the present study did not observe prominent differences in these domains between individuals with and without recorded psychiatric diagnoses.
This discrepancy may reflect differences in study design, including the use of population-based data and within-decedent comparisons, as well as variation in measurement approaches. It may also suggest that theses factors are broadly elevated among suicide decedents regardless of diagnostic status, rather than being specific to undiagnosed individuals.
In a recent commentary, Sher also emphasised ‘an overlooked issue of suicide in persons with no psychiatric disorders’. This reflects a growing trend to move beyond viewing suicide solely within the domain of psychiatry and to support a broader, more inclusive approach to understanding suicide and developing comprehensive prevention strategies. Reference Sher6
These results may have implications for suicide prevention frameworks strategies that have traditionally emphasised the identification of suicide risk in clinical settings, particularly through the assessment of psychiatric symptoms and related clinical risk indicators. Reference Franklin, Ribeiro, Fox, Bentley, Kleiman and Huang9,Reference Hawton, Lascelles, Pitman, Gilbert and Silverman17 If individuals without a recorded psychiatric diagnosis are not readily distinguishable based on conventional psychosocial profiles, this may indicate limitations of diagnosis-centred approaches and highlight the need for broader, population-level strategies.
In this context, references to community-based, behavioural or digital indicators signals should be interpreted as illustrative examples of potential non-clinical signals that may contribute to suicide risk detection beyond conventional diagnostic frameworks, rather than as specific prevention strategies or solutions supported by the present data. Such indicators may include behavioural or social changes observable outside traditional healthcare settings, although their clinical utility and predictive value remain to be established. Reference Kim, Kim, Lee, Choi, Yook and Shin5,Reference Franklin, Ribeiro, Fox, Bentley, Kleiman and Huang9,Reference Nesi, Burke, Bettis, Kudinova, Thompson and MacPherson18,Reference Buscher, Winkler, Mocellin, Homan, Josifovski and Ciharova19
A notable finding of this study, which distinguishes it from prior research, is the absence of prominent differences in personality traits (e.g. neuroticism, aggression, impulsivity), life stressors, Reference Stone, Simon, Fowler, Kegler, Yuan and Holland4 legal or disciplinary problems, Reference Marttunen, Henriksson, Isometsa and Heikkinen16 social disconnection 20 and relationship problems or loss Reference Stone, Simon, Fowler, Kegler, Yuan and Holland4 between individuals with no psychiatric diagnosis (NPD) and those with psychiatric disorders. This pattern suggests that conventional risk markers may have limited discriminative utility in identifying suicide risk within the NPD group under the current measurement framework. The NPD group should not be interpreted simply as comprising individuals with undetected severe mental disorders. Prior literature on medically serious suicide attempts indicates that high-lethality suicidal behaviour is clinically heterogeneous and may occur in individuals with major mental disorders, personality pathology or no documented psychiatric diagnosis. In addition, adjustment disorder and other acute stressor-related syndromes have been associated with suicidal ideation and behaviour, suggesting that suicidal vulnerability may arise in response to proximal stressors even in the absence of severe or persistent mental illness. Taken together, these perspectives support a broader interpretation of the present detection gap: some suicide decedents may indeed have had unrecognised psychopathology whereas others may have followed more acute, stress-related, impulsive or personality-related pathways that are not fully captured by recorded psychiatric diagnoses. Reference Gvion and Levi-Belz21,Reference Bolton and Robinson22
Accordingly, alternative indicators – including, for example, digital phenotypes or biological markers – are best viewed as hypothesis-generating directions for future research aimed at improving detection strategies beyond traditional clinical frameworks.
This study is limited by the absence of detailed information regarding the method and timing of suicide, which restricts a more nuanced understanding of the circumstances surrounding death. Given the observational design and limited statistical power for subgroup differences, these interpretations should be viewed as hypothesis-generating rather than definitive.
Additionally, data on healthcare utilisation at or near the time of death were unavailable, limiting our ability to assess potential clinical contacts or interventions preceding suicide.
Several limitations related to the characteristics of the UK Biobank cohort should also be considered. First, the cohort consists predominantly of middle-aged and older adults, which may limit generalisability to younger populations in whom suicide risk profiles might differ. Second, UK Biobank is subject to a healthy volunteer bias whereby participants tend to be healthier and more socially advantaged than the general population. This may result in underrepresentation of individuals at higher risk of suicide, particularly those with more severe psychiatric or socioeconomic vulnerabilities. Third, socioeconomically disadvantaged populations are relatively underrepresented in the cohort, which may further limit the applicability of our findings to more marginalised or high-risk groups.
In addition, the absence of a non-suicide control group limits our ability to determine whether the examined variables represent risk factors for suicide. Rather, our findings reflect differences in characteristics between suicide decedents with and without recorded psychiatric diagnoses and should not be interpreted as establishing causal or predictive relationships for suicide risk.
Furthermore, psychosocial and mental health variables were assessed at baseline, often several years prior to death, and may not accurately reflect the individual’s mental state at or near the time of suicide. This temporal gap limits our ability to capture proximal or acute risk factors preceding death. This is particularly relevant for variables that can fluctuate over time, such as mood- and anxiety-related measures, which may be more state-dependent than stable individual characteristics. As a result, these measures may not reflect the psychological state closer to the time of death, and the observed associations may therefore have been attenuated by exposure misclassification. Accordingly, these findings should not be interpreted as evidence that such factors were absent or unimportant near the time of suicide. Instead, our results may be more informative for population-level detection frameworks than for individual-level clinical prediction.
Nevertheless, the use of UK Biobank, a well-designed, large-scale, population-based cohort provides substantial strengths, including the ability to examine a wide range of sociodemographic, clinical and biological variables, thereby offering important implications for understanding suicide risk in the general population.
Summary and implications
Our findings indicate that nearly half of suicide decedents had no recorded psychiatric diagnosis, and conventional psychosocial risk factors were not clearly differentiated in this group. Although known mental health symptoms and service use were elevated among those with psychiatric diagnoses, such indicators were far less apparent in undiagnosed cases. Together, these findings highlight a structural blind spot in current suicide-risk frameworks – that a substantial subset of individuals who die by suicide may not be detectable through traditional clinically anchored markers.
Supplementary material
The supplementary material is available online at https://doi.org/10.1192/bjo.2026.12084
Data availability
The data underlying this article are available from UK Biobank (https://www.ukbiobank.ac.uk/), but restrictions apply to the availability of these data, which were used under licence for the current study (application no. 52031). Data are available for bona fide researchers upon application to UK Biobank. The statistical analysis code used in this study is available from the corresponding author upon reasonable request.
Acknowledgements
Artificial intelligence-assisted tools were used to support the literature search and language editing. All sources were manually screened, verified and interpreted by the authors, and final decisions regarding inclusion and content were made independently by the authors.
Author contributions
Conceptualisation: M.H., J.K.P., H.J.L. Methodology: S.K.K., W.S.K., Y.L. Formal analysis: S.K.K. Data curation: S.K.K., M.O. Writing – original draft: M.H. Writing – review and editing: M.H., A.R.L., S.M.L. Supervision: S.M.L., J.K.P., H.J.L. Funding acquisition: M.H.
Funding
This research has been conducted using the UK Biobank Resource under application no. 52031. This work was supported by grant no. 2023R1A2C1006712 from the National Research Foundation of Korea. The funder had no role in the design and conduct of the study; collection, management, analysis and interpretation of the data; preparation, review or approval of the manuscript; or decision to submit the manuscript for publication.
Declaration of interest
None.




 Open access


eLetters
No eLetters have been published for this article.