





1. Introduction
Laurentian French (henceforth LF) encompasses the varieties of Canadian French spoken in Ontario and Quebec, but excludes other varieties such as Acadian French, which is spoken in the Maritime provinces.Footnote 1 LF includes a phonological process known as high vowel laxing, where the high vowels /i y u/ are realized as lax [ɪ ʏ ʊ] when they appear in syllables closed by certain consonants. Previous work on vowel laxing has focused primarily on describing the environments in which it occurs and on providing an acoustic characterization of the process. Far less work has explored vowel laxing from an articulatory perspective, with Dalton (Reference Dalton2011) being the sole articulatory study. In the current study, we explore vowel laxing in LF from both an acoustic and an articulatory perspective to provide a clear picture of the realization of the process. We do this by carrying out an ultrasound study in which seven native speakers of LF participated. The remainder of this article is organized as follows: section 2 provides the necessary background on vowel laxing, section 3 presents our methodology, section 4 details the results, section 5 provides a discussion, and section 6 concludes.
2. Laurentian French vowel laxing
Vowel laxing in LF is the alternation between tense /i y u/ and their lax allophones, which are expected to be more central in the acoustic space as compared to their more peripheral tense counterparts. According to traditional accounts, laxing occurs when these high vowels appear in a final syllable closed by a consonant that is not one of /ʁ/, /v/, /z/, or /ʒ/, the so-called lengthening consonants (Walker Reference Walker1984, Gauthier Reference Gauthier and Luo2013, Hall Reference Hall2016). Examples of this alternation are given in (1) below.

In petit /pəti/ ‘small (masc.)’, the vowel /i/ is in an open syllable and so it does not undergo laxing, surfacing as the tense [i] in [pət͡si]. In contrast, the same vowel in petite /pətit/ ‘small (fem.)’ is in a final syllable closed by a consonant other than a lengthening consonant, causing it to undergo laxing and surface as the lax [ɪ] in [pət͡sɪt].
Much of the existing work that has considered laxing has done so from a phonological perspective, aiming to provide accounts of laxing using frameworks such as the Contrastive Hierarchy (e.g., Hall Reference Hall2016) or Optimality Theory (e.g., Bosworth Reference Bosworth2011). A smaller body of work has set out to consider laxing from an acoustic perspective, with two main goals: (1) understanding how lax vowels differ acoustically from their tense counterparts and (2) providing acoustic evidence for laxing occurring in the environments as stated in the phonological accounts. With respect to the first goal, since they are high vowels, becoming more mid-central likely involves lowering, which we expect to correspond to a higher first formant frequency (F1), since tongue height and F1 are inversely correlated (e.g., Stevens Reference Stevens1998, Johnson Reference Johnson2003). How centralization manifests in the front/back dimension depends on the backness of the vowel. For the front vowels /i/ and /y/, a more centralized variant would entail the vowel becoming farther back and thus a lowering of the frequency of the second formant (F2), given the general relation between F2 and backness (e.g., Stevens Reference Stevens1998, Johnson Reference Johnson2003). For /u/, a back vowel, a more central realization would involve the vowel becoming farther front and thus raising F2. The findings of the acoustic vowel laxing literature are consistent in terms of the effect of laxing on F1: laxed vowels have a significantly higher F1 than their tense counterparts. However, F2 results are less consistent. Most studies have found that laxed front vowels have significantly lower F2 and that laxed back vowels have significantly higher F2, as would be expected for centralization (Paradis Reference Paradis1985, Martin Reference Martin2002, Arnaud et al. Reference Arnaud, Sigouin, Roy and Nicolaidis2011), but others find no difference in F2 between tense and lax vowels (Dalton Reference Dalton2011; Sigouin and Arnaud Reference Sigouin, Arnaud, Estève and Morin2014, Reference Sigouin and Arnaud2015).Footnote 2 This variation in findings represents the first main goal of the current study: to provide a careful look at the spectral properties of tense and lax vowels in LF.
With respect to the second goal articulated above, while the acoustic literature generally supports the traditional accounts, in that laxing does not occur before the voiced fricatives /v/, /z/, or /ʒ/, the role of /ʁ/ is less clear, with some acoustic work suggesting that it triggers laxing (e.g., Sigouin and Arnaud Reference Sigouin and Arnaud2015, Burness et al. Reference Burness, MacLeod, Tahtadjian and Ahn2022, Lamontagne et al. Reference Lamontagne, Owens, Rosychuk and Villeneuve2023). This issue represents the second main goal of the current project, which is to determine whether /ʁ/ triggers laxing in LF or not.Footnote 3
While the body of research examining laxing from an acoustic perspective is relatively small, that considering laxing from an articulatory perspective is almost non-existent, being essentially limited to Dalton (Reference Dalton2011), which used ultrasound tongue imaging (UTI), but only considered a single speaker. Studying speech production from an articulatory perspective allows us to explore more direct representations of vocal tract gestures and their potentially fine-grained variation, generates real-time data on coarticulation, and provides the opportunity to explore how articulatory gestures and acoustic measures are correlated. Furthermore, as noted above, there is almost no articulatory data available for LF vowel laxing. As such, the third main goal of our study is to contribute to filling this gap by considering how the pattern of vowel laxing can be characterized using ultrasound data.
With this background in mind, our research questions are as follows:
1. Do high vowels in laxing environments centralize and lower or just lower?
2. Does laxing occur before the rhotic /ʁ/?
To achieve our goals, we consider these research questions from two perspectives: (1) using acoustic data looking at the first and second formant frequencies, and (2) using articulatory data via ultrasound tongue imaging.
3. Methodology
3.1 Participants
Seven native speakers of LF (6 female speakers), aged 21 to 60 years (mean = 36), took part in our study. An additional four speakers were tested, but their data were excluded from analysis for the following reasons: two spoke a different dialect of French, and the images or data collection for the other two were incomplete or of poor quality. All participants had lived in Ottawa or Quebec their entire lives, with French being their first language. Their age of onset for acquisition of English ranges from birth to 10 years old. Participants received compensation of either course credit if recruited via the University of Ottawa participant system or $20 CAD if recruited separately.
3.2 Materials
The word list consisted of 60 real words, with 52 words designated for the current study and 8 words as fillers. The target words were either disyllabic or trisyllabic, with the target vowel /i/, /y/ or /u/ in the final syllable. The final syllable had one of four structures: open, closed by /ʁ/, closed by a voiced fricative /v z ʒ/, and closed by consonants other than /v z ʒ ʁ/ (which we refer to as laxing contexts). Examples of these words for each vowel and context are given in Table 1, with the entire word list provided in Appendix A. According to the general pattern, we expect the high vowels to remain tense in open syllables and before /v z ʒ/ and to become lax before consonants other than /v z ʒ ʁ/. Whether vowels become lax before /ʁ/ is our second research question.
Sample words in the word list (complete list available in Appendix A)

Table 1 Long description
Five columns organize word examples in three row groups for the vowels i, y, and u, each vowel paired with an open syllable context and three closed syllable contexts. For i, magie meaning magic appears in an open syllable, litige meaning litigation before a voiced fricative, elixir before the rhotic, and basilic meaning basil before another consonant. For y, abus meaning abuse appears in an open syllable, amuse meaning amuses before a voiced fricative, the feminine adjective obscure before the rhotic, and immune before another consonant. For u, echoue meaning fails appears in an open syllable, approuve meaning approves before a voiced fricative, amour meaning love before the rhotic, and etouffe meaning chokes before another consonant. The pattern illustrates how each vowel is realized across open and closed syllable positions in French.
3.3 Procedure
For the articulatory data, we used ultrasound tongue imaging, a non-invasive method allowing us to investigate the entire tongue shape during vowel production (e.g., Davidson Reference Davidson, Cohn, Fougeron and Huffman2012). Prior to the session, participants were asked to sign a consent form. They were then seated in the chair in the sound-attenuated booth at the University of Ottawa Sound Patterns Laboratory. Participants read a word list aloud as images of their tongue were recorded using a Micro ultrasound system with a Telemed MC4-2R20S-3 convex probe that was stabilized with the UltraFit helmet (Spreafico et al. Reference Spreafico, Pucher and Matosova2018). The ultrasound recordings were made at a framerate of approximately 82 Hz with a depth set at 8 cm. Simultaneously, the audio was recorded with a Røde NT1 microphone and a Scarlett Solo II preamp. Both ultrasound and audio data were collected using Articulate Assistant Advance software (AAA, Articulate Instruments Ltd 2012). Words were presented on a screen, and participants were directed to read them naturally in isolation after hearing a beep sound. After each token was automatically recorded, the research assistant outside the booth clicked the button on AAA to advance to the next word. Each word was produced six times and each set’s word order was randomized. Following the experiment, participants completed a demographic questionnaire.
3.4 Analysis
3.4.1 Acoustic data
The acoustic data were segmented and analyzed using Praat (Boersma and Weenink Reference Boersma and Weenink2024). We marked the beginning and end of each vowel manually based on the onset and offset of F2 and used these points to calculate the midpoint of each vowel. We then extracted the F1 and F2 at the midpoint using a Praat script. Both measures (for the three high vowels together) were normalized using the Lobanov method on a speaker-by-speaker basis. This method is appropriate for our dataset because it reduces inter-speaker variation caused by physiological differences but does not require reference values from other vowels.
3.4.2 Articulatory analysis
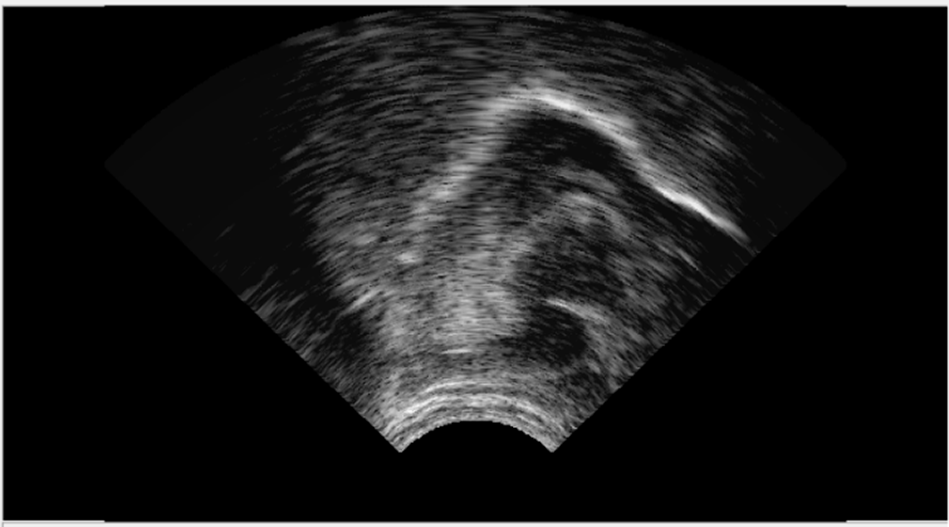
Tongue tracing involved a semi-automated process with AAA, with each tracing later manually confirmed by two research assistants. To synchronize with the acoustic data, we chose the frame nearest to the vowel midpoint as marked in the acoustic data. Subsequently, we traced the tongue contour in those frames for each token. An example of a tongue image is shown in Figure 1.
Raw ultrasound frame; right side is tongue front, and the left side is tongue back. (Speaker 4, /u/ in ‘pelouse’).

Figure 1 Long description
The image shows an ultrasound frame. The right side represents the front of the tongue, while the left side shows the back.
Then, we extracted 42 X and Y coordinates from each tongue image. Smoothing Spline ANOVA (SS ANOVA: Gu Reference Gu2002, Davidson Reference Davidson2006) was used to compare the entire tongue for vowels in each condition with polar coordinates to better capture the tongue root position (Mielke et al. Reference Mielke2015). SS ANOVA is an effective tool for visually assessing differences in tongue positions. The SS ANOVA plots contain splines, which correspond to the image of the tongue contour generated by the ultrasound. The curve represents the tongue surface in the midsagittal plane, the rightmost side is the tongue front, and the leftmost side is the tongue back. An example of an SS ANOVA plot is provided in Figure 2. The SS ANOVA was calculated using polar coordinates and converted back to Cartesian coordinates for the presentation. This plot shows the first speaker’s production of /y/ in the four contexts. Bayesian confidence intervals of 95% are plotted around the curves. Two curves are considered significantly different from each other if their confidence intervals do not overlap or crossover with each other for a considerable length.
Example of SS ANOVA plot for S1’s production of /y/ in four different contexts. X represents the length and Y represents the height of the tongue. The “open” and “VF” conditions show a more fronted tongue position compared to the “laxing” and “rhotic” conditions, as the back of the tongue in the “open” and “VF” conditions has higher x- values, indicating they are more fronted (red arrow).

Figure 2 Long description
The graph shows SS ANOVA plots for tongue positions in four contexts: laxing, open, rhotic and VF. The x-axis represents the length of the tongue and the y-axis represents the height of the tongue. Four curves are plotted, each representing a different context. The ‘open’ and ‘VF’ conditions show a more fronted tongue position compared to the ‘laxing’ and ‘rhotic’ conditions, as indicated by higher x-values. A red arrow highlights the difference in tongue position between the ‘open’ and ‘VF’ conditions.
SS ANOVA plots cannot be aggregated across speakers, because individuals have different tongue shapes and the imaged portion of the tongue may vary among speakers, influenced by factors such as the visibility of the tongue when using ultrasound and the placement of the probe (e.g., Davidson Reference Davidson, Cohn, Fougeron and Huffman2012). Despite this limitation, SS ANOVA plots are advantageous since the entire tongue is visible. As a result, we can glean information that is otherwise difficult to see when we only focus on one point in the tongue. For example, with SS ANOVA plots we can determine the crossover point of two curves, the relation between tongue back, tongue body, and tongue front, etc. For tongue backness, we focus on the overall backness of the tongue curve with a particular emphasis on the back third of the tongue (Ahn Reference Ahn2018).
4. Results and Discussion
In this section, we report the acoustic and articulatory results of each research question in a separate subsection and discuss them.
4.1 Research Question #1: Does laxing cause lowering only or also centralization?
To explore this question, we compared the realizations of the high vowels in open syllables, which provides the canonical realization of the vowels, to those in laxing contexts. Recall that laxing contexts are those where the vowels are in closed syllables preceding consonants other than /ʁ/, /v/, /z/, or /ʒ/. As noted above, if laxing causes lowering only, then we would expect to find higher F1 and lower tongue body in laxing contexts as compared to open syllables, with no differences in F2 or tongue backness between these contexts. On the other hand, if laxing also causes centralization, then we would expect to additionally find a lower F2 and farther back tongue body for /i/ and /y/ and a higher F2 and farther front tongue body for /u/ in laxing contexts as compared to in open syllables.
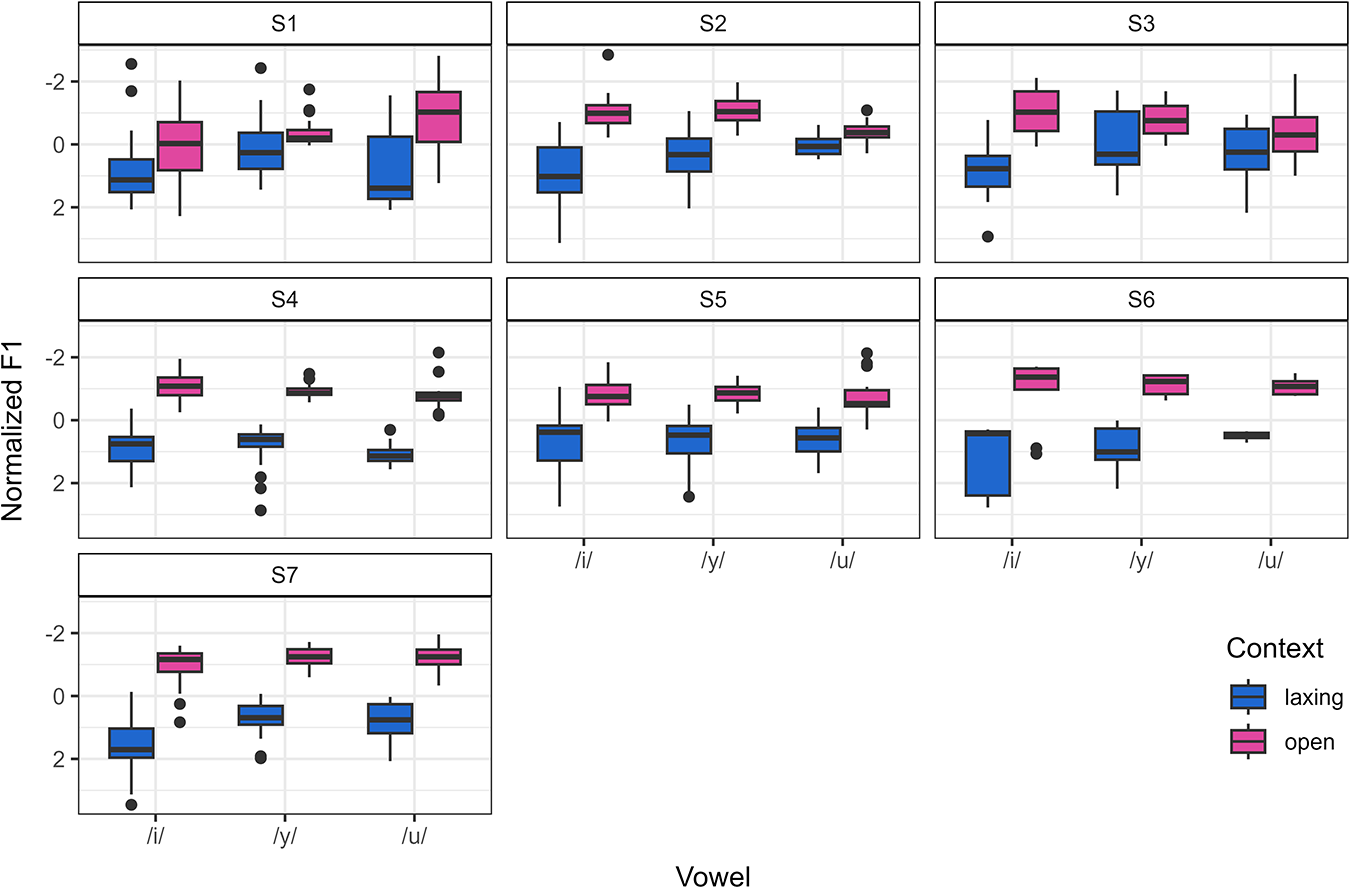
First, we consider the height dimension, via F1 for acoustics and tongue body height for articulation. Figure 3 shows the distribution of F1 of the three high vowels in laxing contexts (blue boxes) and in open syllables (pink boxes) split by individual speaker. Note that the direction of the scale on the y-axis is reversed, such that vowels with lower F1 are higher on the plot. We can see that for each speaker and each vowel, F1 tends to be higher for vowels in laxing contexts. This suggests that, for all seven speakers, lax vowels are lower than their tense counterparts. However, we can observe individual variation among the speakers in how much of a difference in F1 they make between these contexts. For example, while S4, S5, S6, and S7 show quite sharp differences in F1 between the contexts, S1, S2, and S3 have more overlap between the distributions.
Boxplots of normalized F1 by vowel for laxing and open contexts, split by individual speaker. The direction of the scale on the y-axis is reversed: vowels with lower F1 are higher on the plot.

Figure 3 Long description
The image consists of seven boxplots arranged in three rows and three columns, each labelled with a speaker identifier: S1, S2, S3, S4, S5, S6 and S7. The x-axis is labelled ‘Vowel’ and includes /i/, /ɪ/ and /u/. The y-axis is labelled ‘Normalized F1’ with a reversed scale, where lower F1 values are higher on the plot. Each boxplot displays two contexts: laxing (blue boxes) and open (pink boxes). The plots show variations in F1 values for each vowel across different speakers, indicating individual differences in how F1 changes between contexts. Some speakers, like S4, S5, S6 and S7, show distinct differences between contexts, while others, like S1, S2 and S3, have more overlap. The legend indicates the colour coding for contexts: blue for laxing and pink for open.
Next, we examine the articulatory results for tongue height and compare the individual findings to those for F1. Figure 4 shows the SS ANOVA plots by individual speaker. The colour of the curves differs by context, with red representing vowels in laxing contexts and blue representing vowels in open syllables. If the articulatory findings align with the acoustic findings, we would expect to see that all speakers have a higher tongue body height for all three vowels in open syllables as compared to in laxing contexts. In fact, generally speaking, this is, what we find in Figure 4, except for /i/ and /u/ for S2 and /u/ for S3, who make no difference between the contexts for those vowels. Taken together, the acoustic and articulatory results answer the first part of our first research question by suggesting that high vowels become lower when realized as lax.
SS ANOVA plots by individual speaker, split by vowel and context (red, dashed line = laxing contexts; blue, solid line = open syllables).

Figure 4 Long description
The image contains SS ANOVA plots for seven speakers labelled S1 to S7, each showing three plots for vowels /i/, /y/ and /u/. Each plot displays two curves: a dashed line and a solid line, representing different contexts. The arrangement is in a grid format with speakers listed vertically and vowels horizontally.
The second part of our first research question asks whether lax vowels are realized as more central compared to their tense counterparts. For the front vowels /i/ and /y/, being more central when lax would entail having a lower F2 (from an acoustic perspective) and being produced with the tongue position farther back. For the back vowel /u/, centralization would entail the opposite: lax [ʊ] would have a higher F2 and a more fronted tongue position.
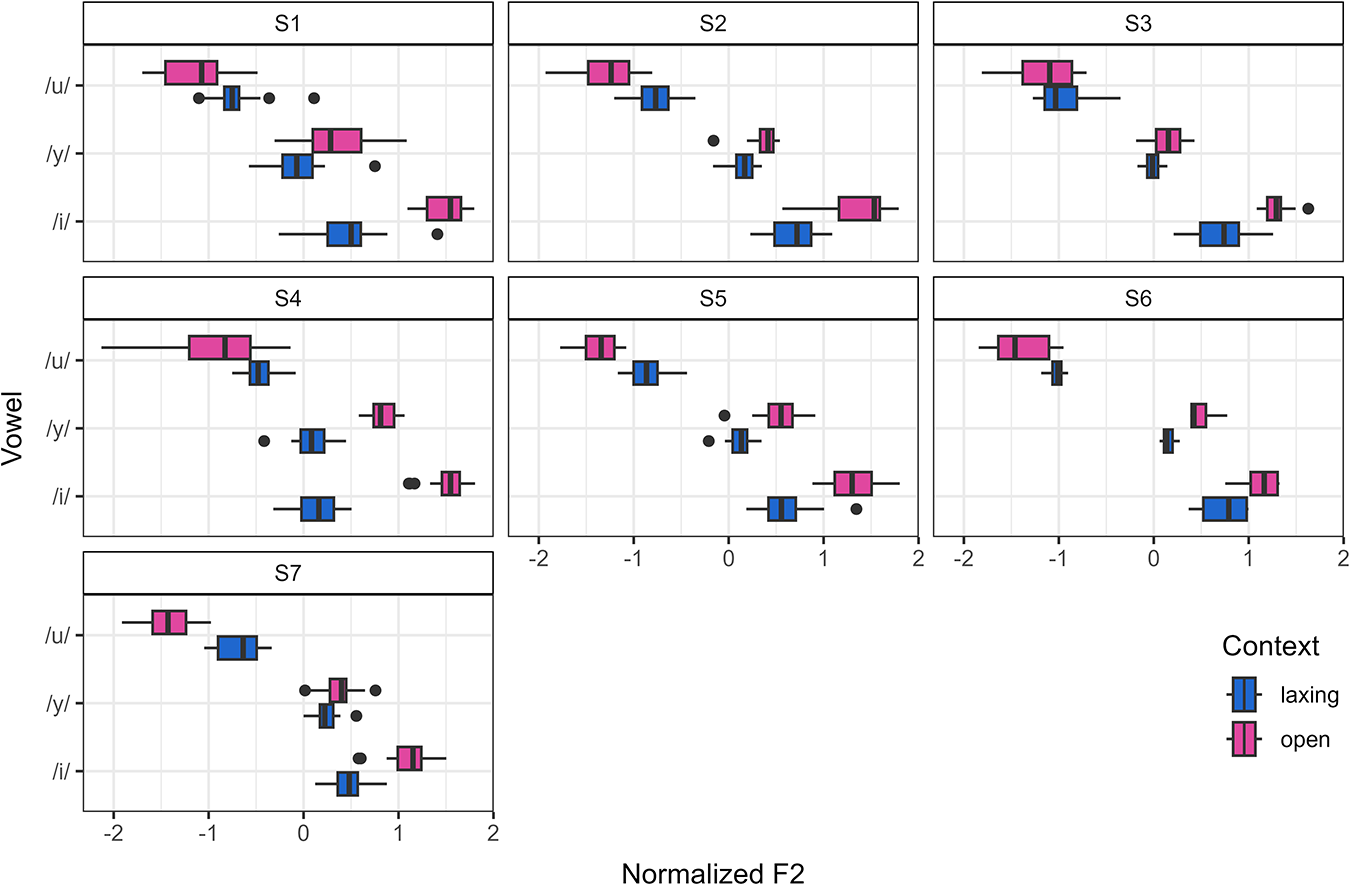
Figure 5 shows the distribution of F2 for each vowel in laxing contexts (blue boxes) and open syllables (pink boxes), split by speaker. If the vowels are realized as more central when lax, we would expect the blue boxes to occupy a more central position on the x-axis (F2) compared to the pink.
Boxplots of normalized F2 by vowel for laxing and open contexts, split by individual speaker. The x-axis is not reversed to maintain consistency with the articulatory data. Therefore, positions toward the left present a lower F2 (more backed tongue position), while positions toward the right indicate a higher F2 (more fronted tongue position).

Figure 5 Long description
The image contains seven boxplots, each representing normalized F2 values by vowel for different contexts, split by individual speakers labelled S1 to S7. Each boxplot has two sets of boxes: blue for laxing contexts and pink for open contexts. The x-axis is labelled 'Normalized F2' and the y-axis is labelled ‘Vowel’. The boxplots show the distribution of F2 values, with positions toward the left indicating a lower F2 and positions toward the right indicating a higher F2. Each speaker's boxplot displays variations in F2 values across different vowels and contexts.
This does appear to be the case for all vowels and all speakers (except possibly for S3’s production of /u/), suggesting that, from an acoustic perspective, the participants realize lax high vowels as more central on the F2 dimension than the tense counterparts. Note, however, that the magnitude of the difference in F2 between the contexts appears to be smaller in the case of /u/ as compared to the front vowels. As with F1, there is individual variation among the speakers in terms of how much of a differencein F2 they make between tense and lax vowels. For example, S4 produces lax /i/ and /y/ with a much lower F2 than the tense variants, while S3 and S6 show less of a difference in this respect.
Next, we explore the articulatory findings in terms of tongue backness and compare the individual findings to those for F2. Figure 4 shows the SS ANOVA plots by individual speaker. If the articulatory findings align with the acoustic findings, we would expect to see that all speakers have a more backed tongue position for /i/ and /y/ and a more fronted tongue position for /u/ in laxing contexts as compared to in open syllables. We can see that, for the front vowels, almost all speakers show the expected pattern (except for S4 for /i/ and S2 for /y/, who show no difference in tongue backness between the contexts). The back vowel /u/ is a bit more variable, with four out of seven speakers showing the expected pattern and S2, S3, and S7 showing no difference between the contexts. Taken together, the acoustic and articulatory results both suggest that lax vowels are realized as more central than their tense counterparts, where the extent of the difference and the consistency of the pattern among individuals are lower for /u/.
Taken together, our acoustic findings (F1 and F2) and articulatory findings (tongue body height and tongue backness) suggest that the LF high vowels become both lower and more centralized when they are realized as lax. This pattern was quite consistent for the front vowels across participants and somewhat less so for the back vowel.
4.2 Research Question #2: Does laxing occur before the rhotic /ʁ/?
In this section, we present the acoustic and articulatory findings pertinent to our second research question to determine whether vowels before rhotics are realized similarly to vowels in laxing contexts or not. We first examine the acoustics (F1, F2), and then present the articulatory data.
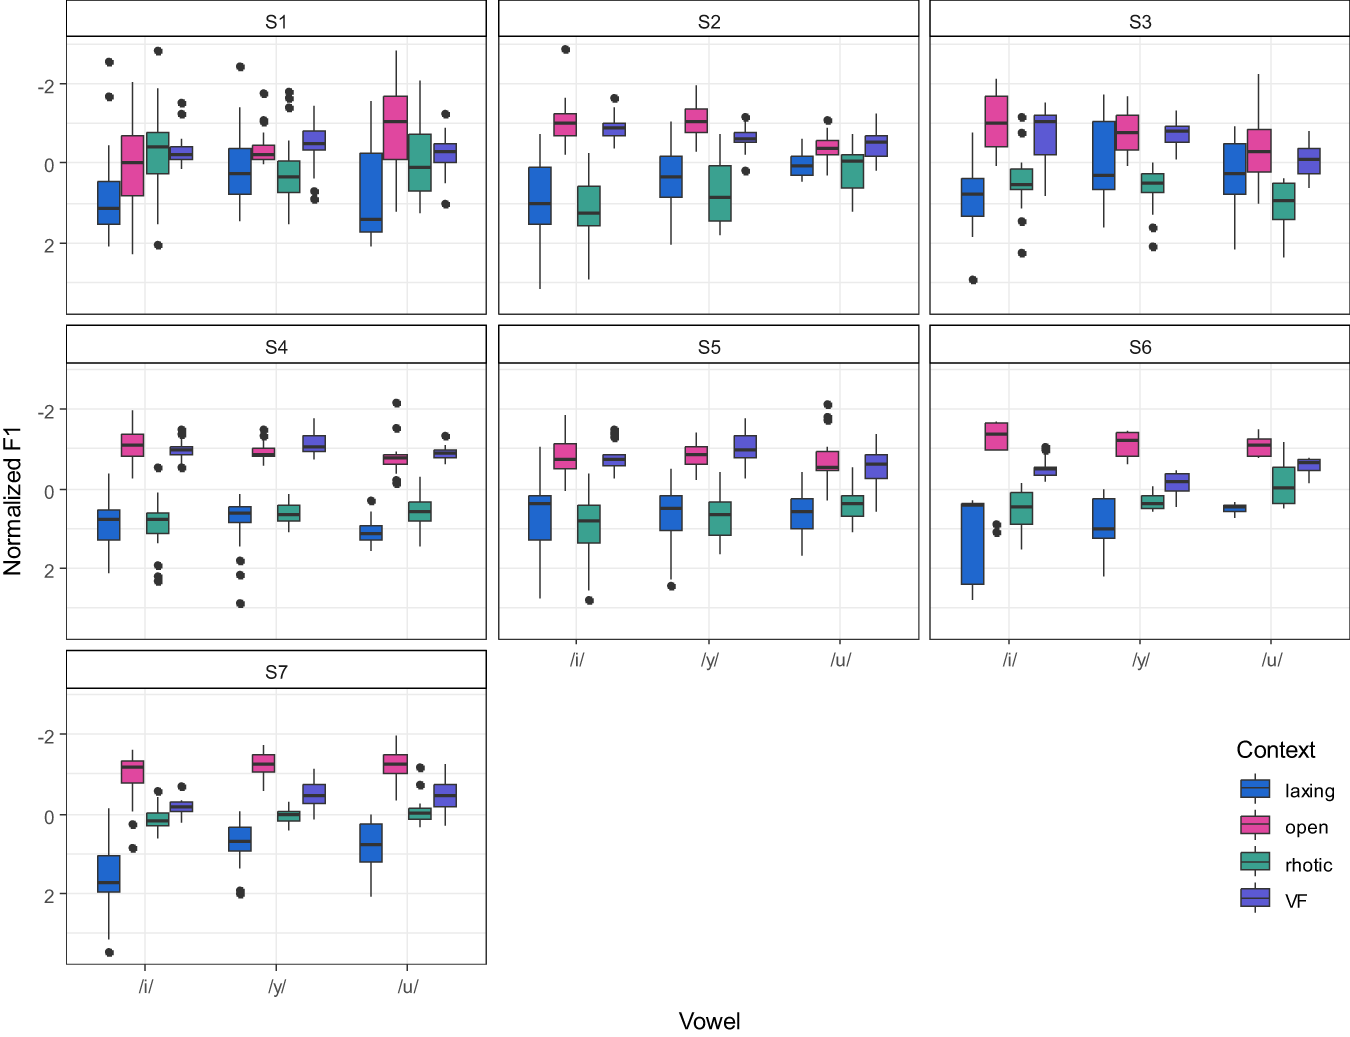
Figure 6 represents the normalized F1 of all three vowels in all four contexts. For five speakers, the rhotic (green boxes) patterns with laxing contexts (blue boxes). This means vowels before rhotics have similar tongue lowering as vowels in the laxing contexts. In other words, the green boxes and blue boxes overlap for all the speakers except S1 and S7. The first speaker is an exception in that their /i/ and /u/ vowels do not follow the same pattern before rhotics as those in laxing contexts. For S7, vowels before rhotics are realized between the laxing (blue) and voiced fricative (purple) contexts.
Boxplots of normalized F1 by vowel for each context, split by individual speaker. Four conditions: laxing contexts, open syllables, rhotic, and VF (voiced fricatives). The direction of the scale on the y-axis is reversed: vowels with lower F1 are higher on the plot.

Figure 6 Long description
The image contains seven boxplots labelled S1 to S7, each representing a different speaker. The x-axis is labelled ‘Vowel’ with categories /i/, /y/ and /u/. The y-axis is labelled ‘Normalized F1’. Each boxplot displays data for four contexts: laxing, open, rhotic and VF, indicated by different colours. The direction of the scale on the y-axis is reversed, with lower F1 values higher on the plot. Each speaker's boxplot shows variations in F1 values across the different contexts and vowels. Outliers are marked as individual points outside the boxplot ranges. The legend on the right identifies the colour coding for each context.
There are also differences between front and back vowels. Although all three vowels show lowering of tongue position in rhotic contexts, if we inspect the results more carefully, /u/ is different from /i/ and /y/. For S4, S6, and S7, tongue height for /u/ before rhotics is between laxing and voiced fricative contexts.
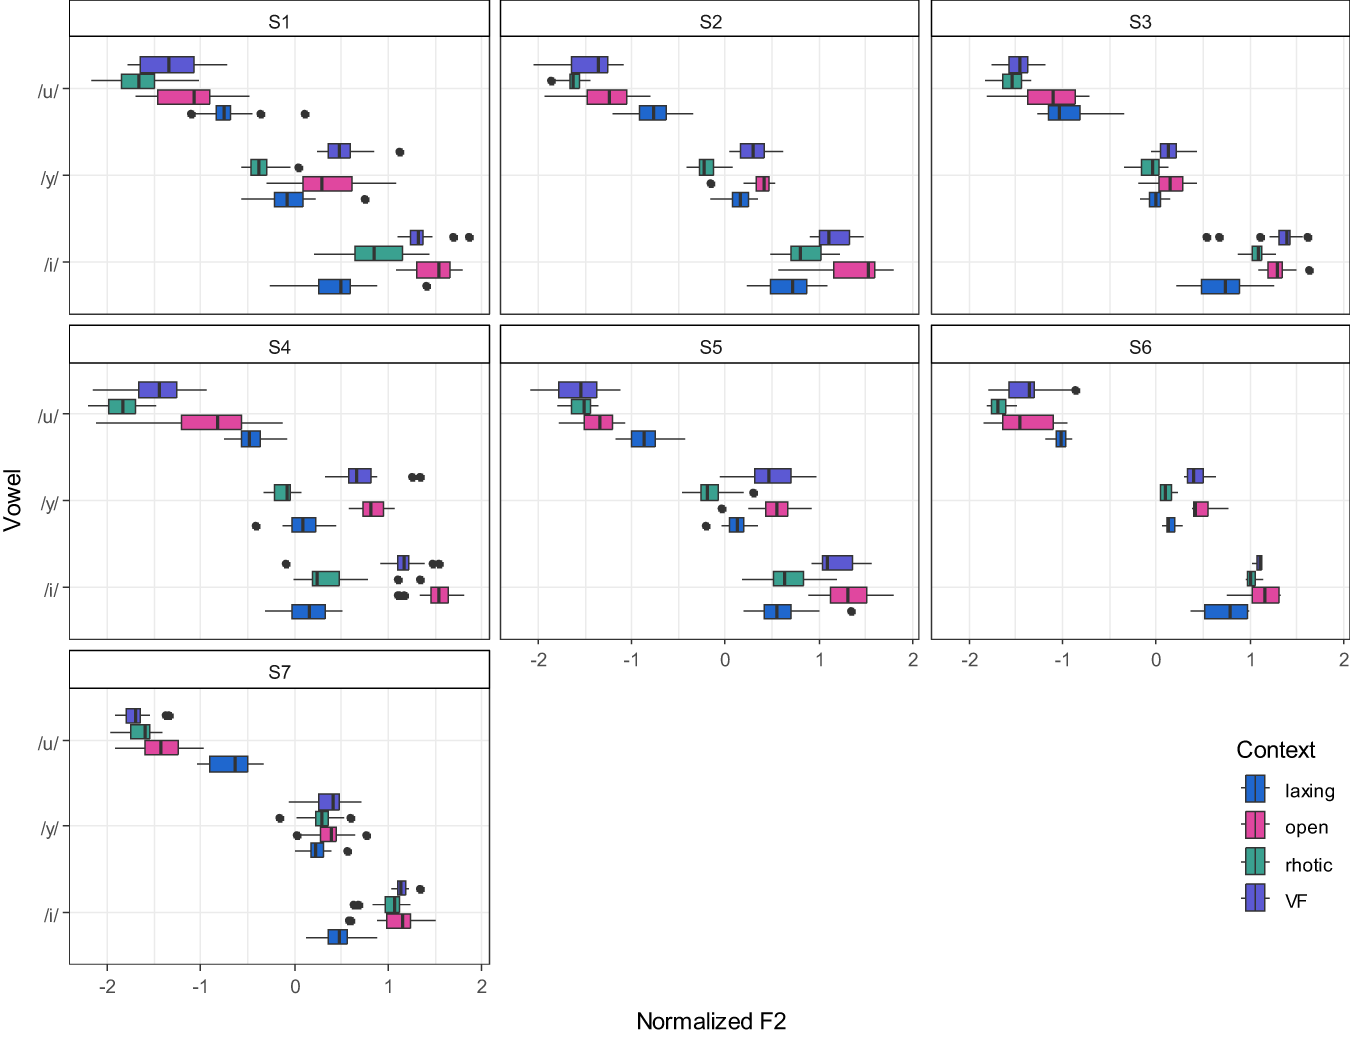
In Figure 7, even more distinct patterns emerge between front vowels /i y/ and the back vowel /u/ in terms of F2. For front vowels, pre-rhotic contexts (green boxes) either align with laxing contexts (blue boxes) or fall between voiced fricatives (purple boxes) and laxing contexts (blue boxes). One noteworthy observation about the difference between front vowels and back vowels is that, across all participants, the F2 of vowels preceding rhotics is consistently lower than vowels in voiced fricative contexts. On the other hand, in the case of the back vowel /u/, rhotics consistently exhibit the lowest F2 across all speakers, which indicates more backing of the tongue position, with no overlap observed with laxing conditions.
Boxplots of normalized F2 by vowel for each context, split by individual speaker.

Figure 7 Long description
The image contains seven boxplots labelled S1 to S7, each representing different speakers. The y-axis is labeled ‘Vowel’ with /u/, /y/ and /i/ vowels. The x-axis is labelled ‘Normalized F2’. Each plot shows data for four contexts: laxing, open, rhotic and VF, represented by different colours. The plots display variations in F2 values for each vowel across different contexts.
In sum, the acoustic pattern of F1 shows that vowels produced before rhotics are similar to those in laxing contexts, with a slight difference between front and back vowels, but F2 shows that /u/ is vastly different from the front vowels.
For articulation, the SS ANOVA plots of each speaker for the three vowels are shown in Figure 8. For ease of comparison, we only include the splines for three conditions (laxing, rhotic, and VF) here; the SS ANOVA plots for all four contexts can be found in Appendix B. For tongue height, the results show that for all three high vowels, the tongue position of vowels before voiced fricatives is always higher. Sometimes, it is the same height as those in laxing contexts or those before rhotics. Nevertheless, the vowels before voiced fricatives never show lower tongue height compared to other contexts. The vowels before rhotics (green, long-dashed line) can pattern either with those before voiced fricatives (purple, short-dashed line), those in laxing contexts (blue, solid line), or in between. The details of each speaker’s pattern are summarized in Table 2. The articulatory results show that, unlike the acoustic results, vowels before rhotics do not always pattern with laxing contexts in terms of tongue height. Nevertheless, there is no case where the vowels in rhotic contexts have higher tongue position than those before voiced fricatives.
SS ANOVA plots by individual speaker, split by vowel and context (blue, solid line = laxing contexts; green, long dashed line = before rhotics; purple, short dashed line = before voiced fricatives).

Figure 8 Long description
The image contains SS ANOVA plots for seven speakers labelled S1 to S7. Each row corresponds to a speaker and each column represents a vowel: /i/, /y/ and /u/. The plots illustrate tongue height and backness patterns across different contexts. The lines in each plot are differentiated by style: solid, long dashed and short dashed, representing various contexts. Each plot shows the variation in tongue height and backness for the respective vowel and speaker combination.
Summary of tongue height and backness patterns. VF = voiced fricatives; L = laxing contexts, R = rhotics. For height, > means higher, and for backness, > means more fronted. This was determined by the SS ANOVA plots, by assessing whether there was any overlap between tongue splines of each condition

Table 2 Long description
The table summarizes tongue height and backness patterns for the vowels /i/, /y/, and /u/ across different speakers in voiced fricative, laxing, and rhotic contexts. Voiced fricatives consistently lead to higher tongue height and more fronted tongue backness compared to laxing and rhotic contexts. Speaker-specific variations exist, such as speaker 3 showing similar tongue height for rhotics and laxing in /i/, and speaker 7 exhibiting more fronted tongue backness in laxing contexts for /u/. These patterns suggest that voiced fricatives have a significant impact on tongue positioning, though individual differences among speakers are notable.
In terms of tongue backness, /i/ and /y/ before rhotics are further back except for two speakers: S4 (for /i/ only) and S7. For S7, the vowels in laxing contexts are further back compared to the vowels in other contexts. For all the speakers, the vowels are always most fronted in voiced fricative contexts, which indicates tongue body centralization in vowels in laxing contexts and those before rhotics for most speakers. On the other hand, the notable aspect is that for /u/, the vowels before rhotics are always, without exception, the furthest back, which is consistent with the F2 acoustic results.
Table 2 provides a summary of the patterns across speakers and vowels, including both vowel height and backness, based on the SS ANOVA plots in Figure 8.
In sum, focusing first on the height dimension, our data showed that F1 was very similar in laxing and rhotic contexts – a finding that held for all three vowels. However, for the articulatory data on tongue body height, the results are more variable. For F1, the vowels before rhotics pattern with the laxing contexts, so it is tempting to say that rhotics also trigger the laxing of the preceding vowel. Articulatory data suggests, however, that the pattern in rhotic contexts is less consistent.
Moreover, when we consider F2 and vowel backness, we see an asymmetry. While the front vowels /i y/ are farther back before rhotics in a way that is comparable with the backness of the vowels in laxing contexts, /u/ shows a different pattern. If rhotics were another laxing context, we would expect /u/ to have a comparable frontness both before rhotics and in laxing contexts. However, as we saw in Figures 7 and 8, /u/ before rhotics are among the farthest back of all contexts. Therefore, it is not likely that rhotics are simply another laxing context, especially if we conclude that laxing involves both lowering and centralization, as discussed in section 4.1.
5. General Discussion
The goal of this study was to explore Laurentian French vowel laxing to weigh in on two areas of debate in the literature. The first area concerns the phonetic nature of laxing: whether it is comprised of vowel lowering only or whether the laxed vowels are also centralized. Previous work has found evidence for both patterns (e.g., Paradis Reference Paradis1985; Martin Reference Martin2002; Arnaud et al. Reference Arnaud, Sigouin, Roy and Nicolaidis2011; Dalton Reference Dalton2011; Sigouin and Arnaud Reference Sigouin, Arnaud, Estève and Morin2014, Reference Sigouin and Arnaud2015). The second area focuses on the realization of the high vowels when they precede a rhotic coda. While traditional accounts have considered the rhotics to be voiced fricatives and thus not triggers of laxing (e.g., Walker Reference Walker1984), more recent experimental work has suggested that the high vowels might also be realized as lax before rhotics (e.g., Sigouin and Arnaud Reference Sigouin and Arnaud2015, Burness et al. Reference Burness, MacLeod, Tahtadjian and Ahn2022, Lamontagne et al. Reference Lamontagne, Owens, Rosychuk and Villeneuve2023). Whereas virtually all previous work on vowel laxing has included either acoustic or articulatory data, in this study, we provide evidence about the above issues from both perspectives.
Focusing our attention on the first issue, our findings indicated that all participants realized the high vowels as lax in the expected contexts, but that the way they did so was variable. For example, some participants showed large distinctions in F1 between tense and lax variants, while others showed smaller distinctions; some participants showed more extreme centralization of lax vowels while others showed only modest shifts. Overall, this suggests that while LF laxing does involve both lowering and centralization, the exact way that individuals manifest laxing can be different.
In terms of the second issue, as noted above, in past work, rhotics have been treated as just another voiced fricative (e.g., Walker Reference Walker1984) or just another laxing context (e.g., Lamontagne et al. Reference Lamontagne, Owens, Rosychuk and Villeneuve2023). If we consider only the front vowels, our results suggest that the rhotics belong to the laxing contexts, since our participants realized /i/ and /y/ as farther back and lower before rhotics, similar to their realization of these vowels in the laxing contexts. However, when we include the back vowel /u/, the picture is more complex. Here, the vowels were realized not as farther front, but as farther back still, even farther back than in open syllables. This means that all three vowels are produced farther back when they precede a rhotic. In contrast, in laxing contexts, the vowels centralize. As such, our findings suggest that vowels before rhotics do not pattern consistently with the laxing contexts or with the voiced fricatives.Footnote 4
Another possibility is that the more retracted tongue position/lower F2 before rhotics is the result of an anticipatory coarticulation with the following rhotic (e.g., Howson and Kochetov Reference Howson and Kochetov2020 for Upper Sorbian, Lara et al. Reference Lara, Sejin, Hermes, Pillot-Loiseau, Skarnitzl and Volín2023 for French), which in Laurentian French is a voiceless uvular fricative.Footnote 5 Since this consonant is articulated quite far back in the vocal tract, it is perhaps unsurprising that preceding vowels would shift back in anticipation of the consonant. This would indicate that the high vowels are not becoming lax before rhotics, but rather coarticulating. Previous work has shown that vowels can coarticulate to adjacent consonants (C-to-V coarticulation, Recasens Reference Recasens1991). Could coarticulation, then, also explain the finding that all vowels are lower (both F1 and tongue height) before rhotics? One possibility is that we usually raise our tongue body when we move our tongue forward (Trigo Reference Trigo1991, Tiede Reference Tiede1996, Kingston et al. Reference Kingston, Macmillan, Dickey, Thorburn and Bartels1997). Given this, the opposite pattern might be expected, where tongue body lowering occurs as a by-product of tongue backing before rhotic contexts. Generating further evidence on whether the pattern observed here could be an instance of C-to-V coarticulation is left to future research. For example, it can be verified by investigating vowel laxing harmony (Burness et al. Reference Burness, MacLeod, Tahtadjian and Ahn2022). If it is merely C-to-V coarticulation, the vowel in the preceding syllable will not exhibit laxing, but if rhotics trigger laxing, then the vowel in the preceding syllable will show laxing due to the vowel laxing harmony.
Overall, our findings indicate that we can capture the pattern of LF vowel laxing using either acoustic or articulatory data and that the individual manifestations of the pattern were broadly the same when viewed through either lens. While this connection is expected given the widely understood relationship between articulation and acoustics, work exploring the correlation between continuous measures of acoustic and articulation realizations of speech has found that the relationship can be subject to various deviations.Footnote 6 For example, Blackwood Ximenes et al. (Reference Blackwood Ximenes, Shaw and Carignan2017) explored this correlation using acoustic and articulatory data (via electromagnetic articulography – EMA) from vowels in American and Australian varieties of English. They found that, overall, the formant and EMA data were related with relative lingual height and backness correlating with F1 and F2, respectively. However, they point to several areas in which those correlations were weaker. For example, they found that F1 and F2 were correlated in the front of the vowel space, where F2 drops as F1 increases, regardless of tongue backness. They attribute this to a general property of formant spaces. They also found that the vowel space as represented using articulatory data was more compact than that using acoustic data, and suggest that this could be due to other aspects of vowel production (such as jaw height, lip rounding, and tongue shape) also influencing the realization of vowels. In addition, the authors found that there were individual differences among the participants in terms of how strong the correlation was between the acoustic and articulatory data. These findings indicate that while formants and tongue position are certainly correlated, there are various factors that can influence the strength of that correlation. We plan to investigate such factors via our LF laxing data in future work.
Most previous work on vowel laxing has considered the pattern at the group level, collapsing speaker behaviour across the various participants in the study (e.g., Arnaud et al. Reference Arnaud, Sigouin, Roy and Nicolaidis2011, Sigouin and Arnaud Reference Sigouin, Arnaud, Estève and Morin2014). In the current study, we consider our seven participants individually for two main reasons. First, it is not possible to look at ultrasound imaging data collapsed across speakers, since variation in individual speakers’ physiology precludes normalization. Because of this, we needed to consider each speaker’s ultrasound data individually. Second, since we were interested in comparing how the pattern of vowel laxing would be represented using articulatory and acoustic data, we also considered the acoustic data at the individual level to make a more direct comparison with the individual articulatory data. Doing so provides an opportunity to investigate how the realization of phonological patterns might deviate from the overall patterns predicted by traditional accounts or experimental work using group-level data. Significant individual variation in the realization of laxing is possible. For example, Martin (Reference Martin2002) mentions that some speakers in Quebec City, Beauce, and Lac Saint-Jean produce high vowels as lax in all contexts (Martin Reference Martin2002: 82), rather than only in laxing contexts. As noted above, our findings suggest that while, broadly, all the participants participated in vowel laxing, the specifics of how laxing was realized varied among individuals both in terms of the extent of lowering and in terms of centralization.
6. Conclusion and directions for future research
In this study, we used articulatory and acoustic data to demonstrate the phonetic differences between vowels in laxing conditions and vowels in non-laxing conditions in Laurentian French. We had two research questions: (1) whether vowel laxing involves both centralization and lowering and (2) whether rhotics trigger laxing. For the first question, our results suggest that high vowel laxing involves both centralization and lowering, which is especially evident with the front vowels. For the second question, we found that all three high vowels are realized as farther back before rhotics, which is to be expected for the front vowels, but not for the back vowel. As such, our findings suggest that rhotics do not clearly pattern with laxing contexts or non-laxing contexts. Instead, the realization of the vowels as farther back could be the result of coarticulation of the vowel due to the following back rhotic consonant, which is a uvular fricative.
Our study demonstrated the characterization of vowel laxing through the analysis of both acoustic and articulatory data, uncovering complementary information that hints at potential variations in patterns. Notably, when examining /u/’s F1 and vowel height data, F1 data exhibited more consistent patterns, whereas vowel height data displayed greater variability across speakers. Our forthcoming research will delve deeper into exploring the correlation between articulation and acoustics, aiming to elucidate the variability inherent in each component. The methods used and correlation results will be detailed in another paper.
Supplementary material
The supplementary material for this article can be found at https://doi.org/10.1017/cnj.2026.10032.
Acknowledgements
We would like to thank Talia Tahtadjian for her assistance with running the experiment and working with the data; the audiences at Ultrafest X (2022) and the Annual Meeting of the Canadian Linguistic Association/Association canadienne de linguistique (2022) for their engagement with our work; and our anonymous reviewers for their thoughtful feedback on the manuscript. Their contributions greatly improved the quality of this article. This project was supported by seed funding from the Faculty of Arts and the Office of the Vice-President, Research at the University of Ottawa, awarded to Suzy Ahn.





 Open access

