Introduction
The growing availability of large-scale geo-referenced datasets within archaeology is an opportunity that is starting to be exploited enthusiastically. In England and Wales, where metal-detecting is a legal pursuit, the Portable Antiquities Scheme (PAS) is a very important source of such data. It started in 1997 as a pilot project in a small number of areas, and can now be regarded as a mature organisation with good links to the metal-detecting community. It has recorded over a million objects, which are all publicly available via the internet on their database (PAS 2016). These data are naturally attracting scholarly attention, having, for example, the potential to help characterise landscapes (see, for example, Brindle Reference Brindle2014: 11–14). They also add considerably to the range and numbers of objects known, and to patterns of regional use (see, for example, McIntosh Reference McIntosh2014), allowing issues of trade, production and identity to be explored in ways that were not possible before.
The recovery bias in the data that relates to where people are allowed to detect, and where they choose to do so, is naturally an issue. The PAS itself has carried out research on this and has publicised the results (Brindle Reference Brindle2014: 18–21; Robbins Reference Robbins2014: 39–47). Others, such as Bevan (Reference Bevan2012), have developed methodologies to help explore and understand the patterns, and to allow the data to be used more confidently. What has not been considered in any detail is the impact that morphological bias in the types of artefacts recovered may have according to their shape. That a metal-detected and a conventionally excavated assemblage from the same site will normally differ is recognised within the specialist literature, and the implications for dating are sometimes noted in passing (Brickstock et al. Reference Brickstock, Cardwell, Busby, Cool, Huntley, Evans, Makey and Wilson2007: 98–99, tabs 5 & 6; Cool Reference Cool, Booth, Bingham and Lawrence2008: 158–59). More extensive doctoral surveys that have exploited PAS data have sought to explore the phenomenon (e.g. Chester-Kadwell Reference Chester-Kadwell2009: 69–73). What has not been done is to inspect the data rigorously and quantify the impact. This has probably been due to the difficulties of acquiring the large dataset that would be needed. Recent work that we have conducted on modelling brooch use in Roman Britain (Cool & Baxter Reference Cool and Baxter2016) has, however, provided a dataset that can be interrogated to discover the impact of morphological bias. The modelling work reported elsewhere required the data to be inspected for a range of biases. The initial results of the ones connected with metal-detecting were of sufficient interest to warrant further work to see whether similar bias was observable in more recent PAS data, and it is the result of this that is reported here. The implications are important not only for people who seek to use PAS data for the study of Roman Britain, but also for potentially explaining the unusual patterns in material recovered from other periods.
Roman brooches—why are they important?
From the first century BC to the end of the second century AD, brooches were made and used in England and Wales in their tens, if not hundreds, of thousands. Other than coinage, they are the most commonly encountered type of Roman metal small find. Most excavations of early- to mid-Roman sites recover them, and they are regularly found by metal-detecting, with over 18000 recorded by the PAS in the first decade of the scheme's national coverage (Worrell & Pierce Reference Worrell and Pierce2014: 399). The PAS total now (February 2016) stands at just under 23000. Brooches were made in an almost bewildering number of types and sub-types, many of which are very regional. Their changing fashions make them a useful dating tool, with great potential for addressing questions of regionalism and identity.
Possibly because of the sheer volume and variety, nobody, until recently, had ever produced a detailed, dated typological system for these brooches. This position changed when Mackreth's magisterial study was published in 2011. This provided a very detailed typology, using all of the dating evidence then known, and made a corpus of over 15000 brooches available in digital form. As Mackreth had been the main brooch specialist of the last third of the twentieth century, it included a wealth of excavated data alongside the results of a thorough literature review and details of brooches in museum collections. In addition, it also contained a large body of metal-detected data. Prior to the establishment of the PAS, there had been pioneering work in the 1980s and 1990s by Norwich Museum to record the large volume of finds being found by metal-detecting in East Anglia, and Mackreth had helped with this. It contains very little formal PAS information, as he closed the corpus in 2004. It thus provides an unusual opportunity to explore the impact of different recovery methods.
Exploring the Mackreth data
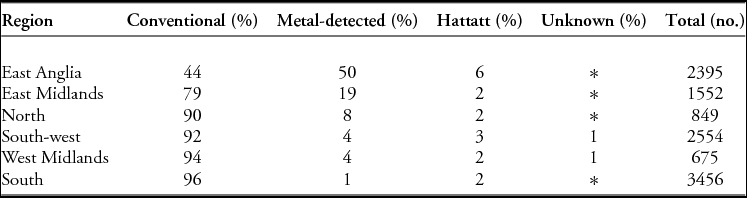
A full discussion of the dataset that this paper uses can be found in Cool and Baxter (Reference Cool and Baxter2016). Here, it is appropriate to consider the sources of the brooches. The metal-detected material could be identified as that coming from private collections. Conventional sources were considered to be those derived from excavation and chance finds in museum collections made prior to metal-detecting. The Mackreth corpus also includes the brooches from Richard Hattatt's collection. Hattatt was a British collector who was active both before and after metal-detecting became a popular hobby. His collection (see, for example, Hattatt Reference Hattatt1989) thus included material that was both conventionally sourced, as defined here, and purchased from detectorists. It has been kept as a separate category and excluded from detailed consideration for this study. Table 1 shows the derivation of all of the provenanced data, with the large quantities of metal-detected items from East Anglia being especially noteworthy. It is an area that continues to provide a considerable amount of the PAS data (e.g. Bevan Reference Bevan2012: fig. 1a; Brindle Reference Brindle2014: fig. 7).
Sources of the brooches by region. Row percentages may not sum to 100% due to rounding; * indicates present but at less than 1%. East Anglia here is defined as Norfolk, Suffolk and Cambridgeshire (references: Mackreth Reference Mackreth2011; Cool & Baxter Reference Cool and Baxter2016).

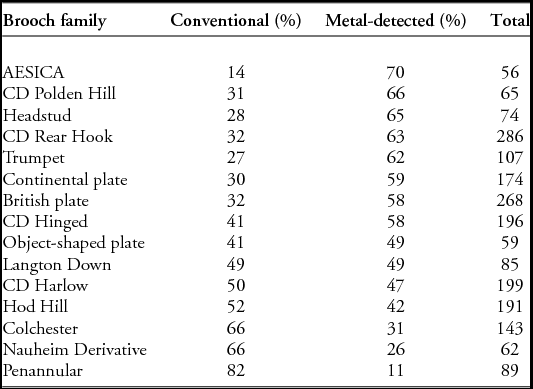
Table 2 shows the breakdown of the East Anglian data according to recovery method and the major brooch families. Only those families with more than 50 examples have been included.
The recovery methods of the largest brooch families found in East Anglia (row percentages with data from Hattatt and unknown categories excluded; CD: Colchester Derivative) (sources: Mackreth Reference Mackreth2011; Cool & Baxter Reference Cool and Baxter2016).

It might have been expected, given the proportions seen in Table 1, that approximately equal numbers within each family would have been found by both metal-detecting and conventional methods, but that is not the case. Some of the bow brooches, such as the Aesica, the Polden Hill and the headstuds, were found at the rate of two metal-detected finds for every example found by conventional means. At the other end of the scale, the figures are reversed for Colchester and Nauheim Derivative brooches. Penannular brooches were found even less often by metal-detecting.
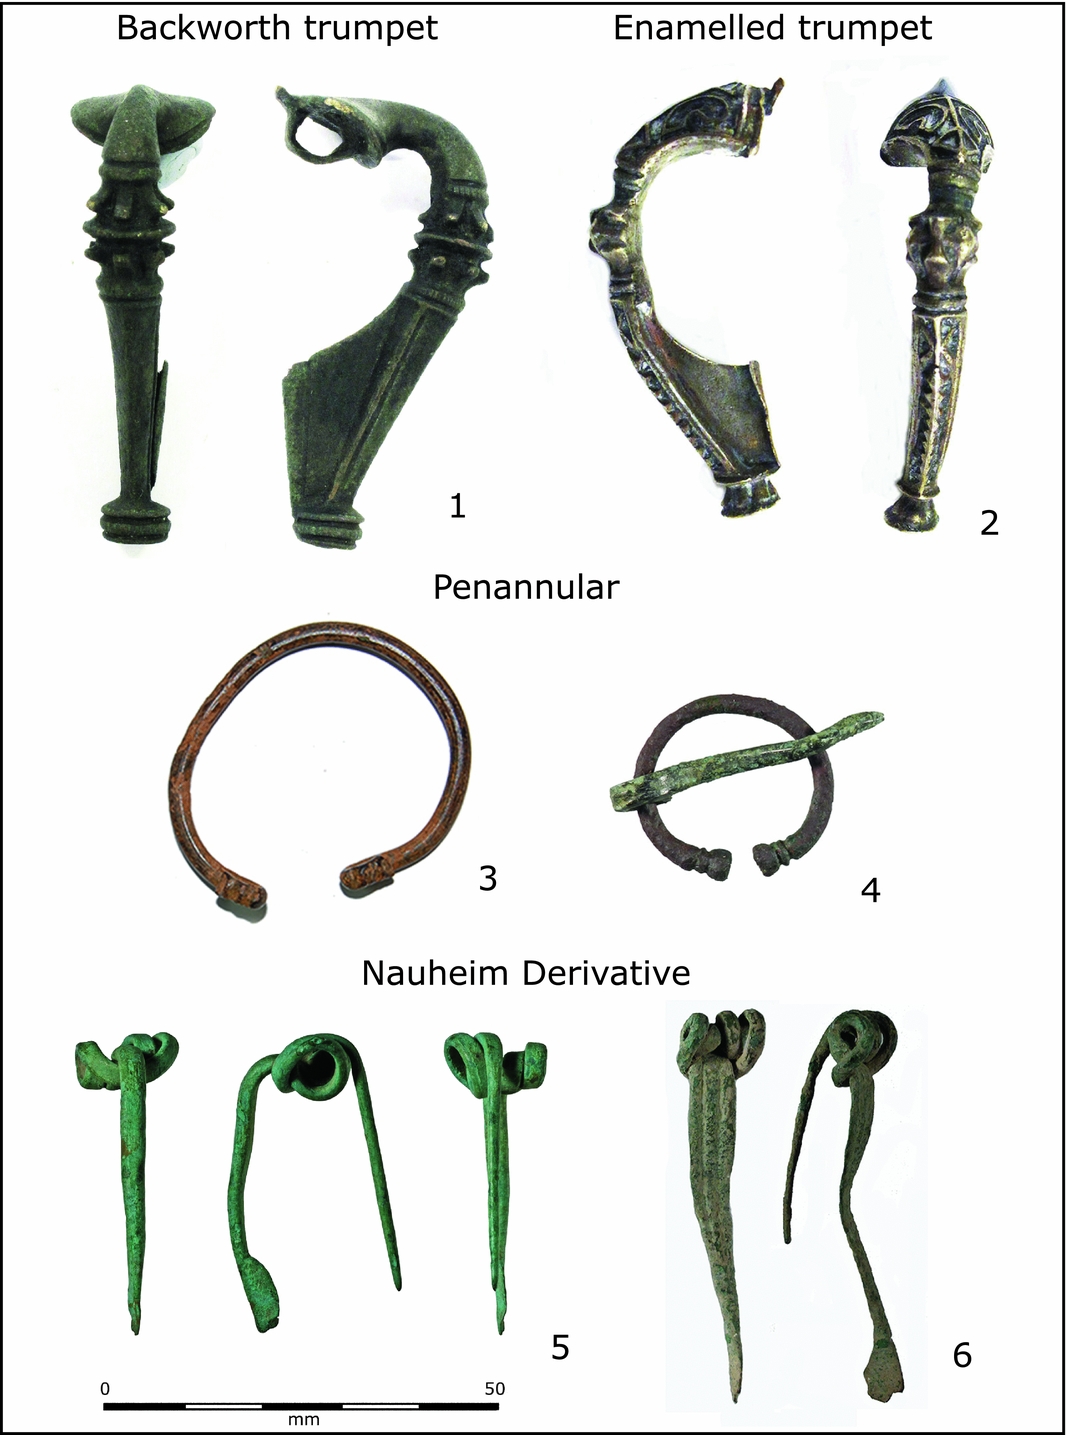
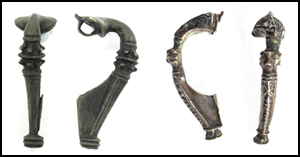
As there is no chronological or geographical reason for this discrepancy, two explanations might be offered. The first relates to morphology (see Figure 1). Aesica, Polden Hill, headstud and trumpet brooches are all relatively substantial two-piece brooches. Even small examples have a solid three-dimensional morphology. Colchester and Nauheim Derivative types, by contrast, are slender, one-piece brooches with a much more two-dimensional appearance. Penannular brooches also frequently appear to be more two-dimensional in profile unless they have substantial terminals. It seems reasonable to suggest that the signals given off by the one-piece and penannular brooches might have been weaker than for the other types, leading to lower recovery rates. Alternatively, it might be that metal-detectorists did not collect such material and/or show it to Norwich Museum in the 1980s and 1990s.
Examples of the brooch types discussed in this article (source: PAS 2016). Reference numbers: 1) NCL-CBAC17; 2) DUR-6167B6; 3) GLO-264C7; 4) YORYM-298357; 5) BHD-A9D45; 6) SUSS-A6BD93.

Exploring the PAS data
The pattern illustrated in the previous section relates to data effectively collected two decades or more ago. The question arises as to whether the picture has changed in the interim now that the recording of metal-detected finds is well established. Inspection of the PAS database shows that it now regularly contains even poorly preserved brooches, and so an experiment was conducted with that data to see if similar patterns were still apparent. The aim was to see whether differential rates of recovery could be detected using the conventionally sourced material documented by Mackreth as a control. Trumpet brooches were selected as the standard against which the recovery rates for penannular and one-piece brooches could be judged. As Table 2 and the numbers recorded on the PAS database now show (well over 2000 examples), there has been no problem with recovering the type.
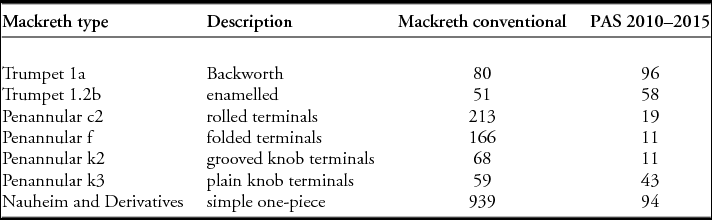
Two types of trumpet brooch were selected: the Backworth form with a central acanthus knob that runs all around the bow of the brooch (Figure 1.1; Mackreth Reference Mackreth2011: 116–17, type TR 11), and the type with enamelled decoration (Figure 1.2; Mackreth Reference Mackreth2011: 119–20, type TR 1.2b). Both have the advantage of being relatively easy to recognise from the descriptions and photographs within the database. The PAS database was searched backward through time until 80 records of Backworth brooches had been identified, thus matching the 80 conventionally sourced examples in the Mackreth corpus. That point was reached by going back as far as 2010, and this set the period of recording used (January 2010–September 2015). The database was then searched for all of the penannular and Nauheim Derivative brooches recorded during that period (Table 3).
Selected brooch groups recovered by conventional means listed in Mackreth (Reference Mackreth2011) compared to those recorded by the PAS between January 2010 and September 2015.

Compared to the figures for the trumpet brooches, virtually all of the penannular groups and the one-piece Nauheim Derivative are seriously under-represented. In nearly six years of data collection, the recorded metal-detected trumpet brooches have surpassed the totals recorded by Mackreth. For two of the penannular groups, the figures do not even reach 10 per cent of the Mackreth corpus; for another group, it reaches 16 per cent. Only the plain knob terminal penannulars were found in quantities closer to those recorded by Mackreth (72 per cent of his total). The reason for this may be that their terminals are frequently more substantial than those of the other groups (see Figure 1.4). The Nauheim Derivative brooches (Figures 1.5 & 1.6) are even less well represented, at just 10 per cent of the quantity recorded in the East Anglian dataset.
There appears to be no archaeological reason why penannular and Nauheim Derivative brooches are being found at a much lower rate than the trumpet brooches used as a control. Nauheim Derivative brooches had gone out of use by the late first century AD, and so cannot be expected to be common in the north, but this can be balanced against the fact that they should be common in East Anglia, a prolific source of recorded metal-detected finds. It is highly unlikely that the rural origin of the PAS material would explain the difference, as rural material is well represented in the Mackreth corpus. Over a third of the conventionally found brooches come from sites also recorded by the Roman Rural Sites project (Allen et al. Reference Allen, Blick, Brindle, Evans, Fulford, Holbrook, Richards and Smith2015). It has to be concluded, therefore, that morphological bias is indeed at work. The data presented by Booth in her survey of penannular brooches certainly supports this view. She found that the knobbed terminal types were the best represented penannular brooches in the PAS data (Booth Reference Booth2014: 73, fig. 3.1). Her records show an even starker contrast, as she recorded fewer than 100 knobbed terminal PAS brooches compared to over 600 conventionally sourced ones.
The impact
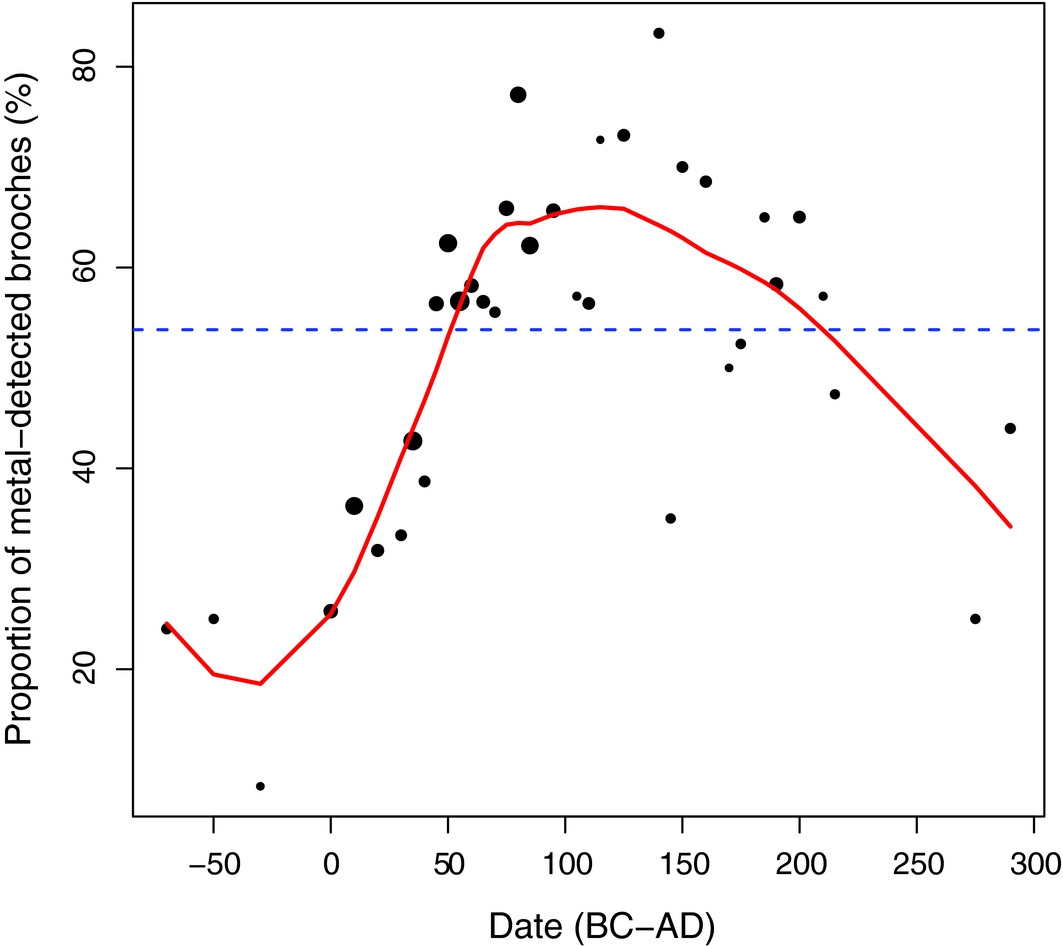
One-piece brooches form the majority of brooch assemblages from the first century BC and the first half of the first century AD. Penannular brooches are often difficult to date closely, but there seems to have been a resurgence of use from the later fourth century onwards (see, for example, Collins Reference Collins, Collins and Allason-Jones2010: 69–73). The systematic under-recording of these classes by metal-detecting will lead to a distortion in the chronological signature of an assemblage if it is overly comprised of finds recovered using this method. This can be seen in Figure 2, where the Mackreth data for East Anglia is plotted, using only the brooches whose recovery method could be clearly identified as conventional or metal-detected. It shows the changing proportions contributed by each method over time. The creation of Figure 2 was made possible by the wealth of recorded context information in the Mackreth corpus, allowing a notional start date of loss to be assigned to each typological group. This notional start date is the point by which it is reasonable to expect individual examples to start entering the archaeological record. The following paragraph explains how the start dates have been calculated and how the data have been modelled.
The proportion of metal-detected brooches (%) in the East Anglian assemblage, plotted against assemblage start date. The dashed line, at 53.8%, represents the total proportion of metal-detected brooches in the sample. Point size, on a logarithmic scale, provides an indication of assemblage size. The solid line is a non-parametric regression fit, and illustrates the general trend. (Note: the fitted line uses the defaults of the loess function in R (R Development Core Team 2008), except that a span of 1/2 has been used.)

Mackreth listed the archaeological dates of the contexts in which the brooches were found in chronological order. The first date could often have a long date range, and so the approach taken has been to inspect the dated contexts of each group and to identify the first relatively narrow one; in other words, if the first date range given was AD 50–150 and the second was AD 60–70, the latter date was used. The mid-point of the range, in that case AD 65, was taken as the notional point when that group started to be lost (full details are available in Cool & Baxter Reference Cool and Baxter2016). The types present can be ordered according to their notional start dates, and date-assemblages of all of the brooch types with the same notional start date extracted. For example, if group A has 15 brooches, Group B has 45 and Group C has 25 brooches, and they all have a notional start date of AD 125, then the total number assigned to AD 125 will be 85. Date-assemblages with 10 or fewer brooches were merged with the temporally closest neighbouring assemblage, or the later of the two where there were two ‘equidistant’ competitors. As an example, take the hypothetical situation in which there were three date-assemblages consisting of one of 25 brooches with a start date of AD 115, the second of 8 brooches with a start date of AD 120 and the third of 85 brooches with a start date of AD 125. The smaller date-assemblage for AD 120 would be merged with that for AD 125, giving a total of 93 for that date-assemblage. Experimentation was undertaken using backwards merging; in other words, in the example, the date-assemblage for AD 115 would become 33 after merging with that of AD 120, and it was found that it made no difference to the overall pattern. The smaller date-assemblages with start dates from AD 290 and later were merged together as a single late group. Most people had stopped wearing brooches by the third century, with the result that brooch use had become increasingly rare. The proportion of metal-detected brooches within each date-assemblage was calculated after merging, and expressed as a percentage, which was then plotted against their respective start dates.
Brooch recovery for types that start before c. AD 50 is clearly biased towards conventional methods. For brooches from the next 100 years or more, there is a bias towards discovery by metal-detection, with the pattern becoming variable after that, although with a bias towards conventional recovery in the latest phases. The later decline in the proportion of metal-detected brooches reflects various factors. One is the increasing rarity of brooches from the late second century onwards; the later forms were also frequently markers of status (Collins Reference Collins, Collins and Allason-Jones2010: 64), and were more likely to be found in areas such as Scheduled Ancient Monuments and towns, where metal-detecting is either less feasible or unpermitted. This clearly contributes to the decline, as does the fact that some of the later brooches are penannular forms.
The impact that morphological bias has on determining the date when late Iron Age and Roman metal-detected assemblages are used in large-scale landscape studies will be obvious. Not all sites up to the early Roman period have coins. If the one-piece brooches from these sites are being recovered in very low quantities as well, occupations from this period may become less visible or indeed invisible. Morphological biases also have the potential to mislead researchers using metal-detected data in the study of other periods. The unusually low rate of recovery of early Anglo-Saxon annular brooches by metal-detecting in southern England has been noted (McLean & Richardson Reference McLean, Richardson, Worrell, Egan, Naylor, Leahy and Lewis2010: 163–67), and the data from Norfolk inhumation cemeteries show a similar pattern (Chester-Kadwell Reference Chester-Kadwell2009: 73, fig. 6.12). McLean and Richardson considered and rejected a bias in recovery, and advanced other explanations, including that annular brooches were possibly being more securely fastened to clothing, and thus less frequently lost (McLean & Richardson Reference McLean, Richardson, Worrell, Egan, Naylor, Leahy and Lewis2010). The problem with biases in penannular brooch recovery, described throughout the above section, suggests that such conclusions should be revisited. Morphologically, annular brooches could be viewed as similar to penannular ones, especially if broken. While this point may be disputed, McLean and Richardson's Reference McLean, Richardson, Worrell, Egan, Naylor, Leahy and Lewis2010 paper notes such a similarity.
Possible causes
Issues over what types of items detectorists recover and offer for recording that can then be identified have been discussed in the literature surrounding the PAS data (e.g. Robbins Reference Robbins2014: 23–24). Problems with fragmentation in the plough soil and subsequent identification, detectorists concentrating on more attractive pieces, and the differing competence of individual detectorists have been usefully explored by Chester-Kadwell (Reference Chester-Kadwell2009: 67, 83–84). In her survey of penannular brooches, Booth (Reference Booth2014: 74) noted the under-representation of penannular brooches in the PAS data, and suggested that this was due to detectorists mistaking them for rings that were generally discarded before recording. All of this may be contributing to the pattern noted in the Mackreth legacy data, the current PAS data and the penannular brooch patterns noted by Booth (Reference Booth2014). There is, however, evidence that metal-detecting may simply not be very good at recovering annular and long, two-dimensional items, no matter how skilled the detectorist is, how careful the recording is or how complete the item may be.
A study that has possibly been overlooked because it took place outside of the PAS structure provides useful data about this: between 1997 and 1999, three seasons of systematic metal-detecting were undertaken by English Heritage at Bainesse Farm, south of Catterick (Brickstock et al. Reference Brickstock, Cardwell, Busby, Cool, Huntley, Evans, Makey and Wilson2007: 99–110, tabs 5 & 6). This was an area of known archaeological importance and was being subjected to illicit metal-detector activity. All of the material from the systematic survey was submitted for expert recording. The objects appeared to have entered the plough soil recently, so there was no bias from fragmentation, differential collection or partial recording. Previous extensive excavation on the site (Wilson Reference Wilson2002a & Reference Wilsonb) allowed a direct comparison of the two sets of data. While the excavated assemblage of 14 brooches had included 6 penannular examples, the metal-detected assemblage of 10 found none. The date of the site made the recovery of one-piece brooches unlikely, but it was also noticeable that the metal-detecting produced no toilet implements, which are also slender, two-dimensional artefacts, and had been common in the excavated assemblage (Wilson Reference Wilson2002b: 31, tab. 93).
Conclusion
The evidence presented here indicates that morphological bias may be a greater problem in metal-detected assemblages than has hitherto been considered. While this has been demonstrated using late Iron Age and Roman artefacts because the quantified data is available to show the impact it can have on recognising occupation from a particular period, it is unlikely to be a period-specific issue. The case of the early Anglo-Saxon annular brooches has already been noted as a potentially analogous example. Many medieval dress fittings, such as brooches and buckles, are annular, so they too may be under-represented in metal-detected assemblages.
The impact of this bias will vary between regions, and may well vary between different periods as well. East Anglia, with its prolific quantities of metal-detected finds, will probably always show unusual patterns. Identifying the effects of morphological bias will require a systematic comparison of metal-detected material against conventionally sourced assemblages. The comparisons will need to take into account the sort of finds assemblages that can be expected on the different types of sites encountered by metal-detectorists. A start has been made in doing this (e.g. Chester-Kadwell Reference Chester-Kadwell2009: 69–78), but more work explicitly considering variation in morphology is needed.
Not all periods have the conventional data that allow such comparisons to be made. In the case of the Anglo-Saxon annular brooches, the authors encountered a lack of excavated settlement data for comparative purposes. The metal small finds of Roman Britain could provide a valuable source of data against which to study morphological bias. They have been the subject of a long tradition of study, with the result that a number of conventionally sourced corpora of objects of different shapes exist. These could be used as a control to conduct experiments with the PAS data, as has been done here. These results could then be considered when working with material in other areas that hitherto have not been so blessed with an abundance of data. That is for the future. For the present, however, morphological bias is yet one more aspect that needs to be considered carefully before metal-detected data is incorporated into wider studies.
Acknowledgements
The two anonymous referees are thanked for their comments.