1 Introduction
What explains foreign direct investment (FDI) flows? Standard economic models attribute cross-border capital movements primarily to relative factor endowments, market size, and transportation and trade cost (Helpman, Reference Helpman1984; Carr et al., Reference Carr, Markusen and Maskus2001). According to the eclectic theory of FDI (Dunning, Reference Dunning1988, Reference Dunning1992), multinational corporations (MNCs) arise from exploiting the advantages of internalizing firm-specific assets such as proprietary technology, marketing and advertising skills, and brand names; MNCs choose an investment location that allows them to best capitalize on their intangible assets. Building on the insight of the “obsolescent bargain” (Vernon, Reference Vernon1971, Reference Vernon and Winchester1980), the political economy literature focuses on the role of domestic and international institutions in constraining host governments’ predatory behavior and therefore in attracting FDI (e.g., Jensen, Reference Jensen2003; Li and Resnick, Reference Li and Resnick2003; Büthe and Milner, Reference Büthe and Milner2008; Kerner, Reference Kerner2009). One common assumption in the extant literature is that FDI flows into one country or between one dyad are independent of other countries or dyads.Footnote 1
Over the past few decades, production processes have been increasingly characterized by fragmentation and dispersion of tasks and activities, which gives rise to global production chains and complex networks. At the center of global production networks are MNCs, who coordinate these networks through foreign affiliates, contractual agreements, and arm's-length transactions (UNCTAD, Reference UNCTAD2013). This is referred to as “globalization's 2nd unbundling” that began in the 1980s (Baldwin, Reference Baldwin2011). For example, Boeing has a relationship with 5,400 supplier factories throughout the world, employing about 500,000 people through its supply chain.Footnote 2 In Thailand's automobile industry, a group of 52 foreign affiliates, part of 35 business groups or MNC networks, produce 56 percent of total output; the network of the 52 foreign affiliates “comprises some 6,000 co-affiliates located in 61 countries around the world” (UNCTAD, Reference UNCTAD2013, 137).
When countries are interconnected by complex production networks, investment flows among states can no longer be understood simply as a result of an individual firm's decision to exploit its firm-specific assets or host countries’ factor endowments. A country's ability to receive FDI hinges also on its connections to global production networks. If global FDI flows can arise endogenously from the network structure, conventional theories of FDI remain incomplete by excluding structural dependencies inherent to complex production networks.
We argue that two network structures—reciprocity and transitivity—are important to account for the pattern of cross-border FDI flows. Reciprocity is the tendency for the investment of country i in country j to be proportional to that of country j in country i, other factors held constant. We posit that reciprocity arises from the fact that existing MNCs help reduce the transaction costs of investing in their home country through diffusing information about their home-country environments, which is facilitated by the existence of global production networks. Therefore, FDI is more likely to flow from country i to country j if there is already a high stock of FDI from country j in country i.
Transitivity is the tendency for two countries that have strong investment ties to the same third country to have strong investment ties with each other (i.e., a friend of a friend is a friend). We argue that the transitivity of FDI arises from the expansion of global production networks and a safety net created by existing FDI linkages. The safety net protects firms from host governments’ opportunistic and predatory behavior and increases the likelihood of FDI flows between two countries that have FDI ties with the same third country, thereby leading to the transitivity of investment activities.
To test our arguments, we use the count exponential random graph model (ERGM) to explicitly model interdependencies among FDI relationships between states (Krivitsky, Reference Krivitsky2012). The count ERGM is suitable for testing our argument for two reasons: (1) ERGM family models allow us to test precise hypotheses regarding dependent network structure, in addition to including conventional covariates (Desmarais and Cranmer, Reference Desmarais, Cranmer, Victor, Montgomery and Lubell2017); (2) the count ERGM is capable of modeling zero inflation in the network, which is the dominant characteristic of bilateral FDI data. Utilizing bilateral FDI data from the United Nations Conference on Trade and Development (UNCTAD) over the 2001–2012 period, we find strong evidence that FDI flows are reciprocal and transitive (i.e., strongly clustered). These results suggest that cross-border FDI flows are interdependent and shaped by their network structure.
Our paper makes several important contributions to the literature. First, we advance the FDI literature by developing and testing a novel network theory. That is, FDI flows are determined by structures of interdependence—a class of generative processes that has been overlooked in the political economy of FDI literature that focuses heavily on domestic and international institutions.
Second, our paper speaks to the “science and the system” debate in the International Political Economy (IPE) field (see, Cohen, Reference Cohen2008; Oatley, Reference Oatley2011; Drezner and McNamara, Reference Drezner and McNamara2013; Chaudoin et al., Reference Chaudoin, Milner and Pang2014; Chaudoin and Milner, Reference Chaudoin and Milner2017). This debate centers on the relative importance of domestic versus systemic factors in accounting for the process of globalization. The dominant “Open Economy Politics” approach (Lake, Reference Lake2009) in IPE has been criticized as the “reductionist gamble” because of its ignorance of system interdependence (Oatley, Reference Oatley2011). In this paper, we consider both domestic and systemic factors simultaneously and show that the pattern of FDI flows is accounted for by both domestic factors and system interdependence. Our paper joins scholars’ recent efforts of bringing in systemic factors to the studies of economic globalization (see, e.g., Hafner-Burton et al., Reference Hafner-Burton, Kahler and Montgomery2009; Ward et al., Reference Ward, Ahlquist and Rozenas2013; Cao and Ward, Reference Cao and Ward2014; Chaudoin et al., Reference Chaudoin, Milner and Pang2014; Chaudoin and Wilf, Reference Chaudoin and Wilf2018).
Finally, to our knowledge, the count ERGM has not been applied previously in political science research. The count ERGM can be applied to any network in which ties are count-weighted, and therefore represents a valuable tool for political scientists, who regularly study networks with count-weighted ties, e.g., shared membership in international governmental organizations (Boehmke et al., Reference Boehmke, Chyzh and Thies2016) and the count of bills co-sponsored between legislators (Kirkland, Reference Kirkland2013).
2 Dependence hypotheses in FDI flows
One common, though not without exception, assumption in existing theoretical and empirical models is that FDI flows into one country or within one dyad are independent of other countries or dyads. The exception to assuming independence is found in the line of monadic studies of FDI that model spatial dependence. These studies include, for example, Coughlin and Segev's (Reference Coughlin and Segev2000) analysis of province-level FDI in China; Blanco's (Reference Blanco2012) analysis of country-level FDI in Latin America; and Baltagi et al.'s (Reference Blanco2007) and Blonigen et al.'s (Reference Blonigen, Davies, Waddell and Naughton2007) analysis of outbound FDI from the USA. The last two examples (i.e., Baltagi et al., Reference Baltagi, Egger and Pfaffermayr2007; Blonigen et al., Reference Blonigen, Davies, Waddell and Naughton2007) are technically dyadic data, but also have a monadic form since there is one observation per country in each year. Though spatial dependence is an important feature of monadic FDI, spatial approaches are limited in that they address one form of interdependence—spatial autocorrelation. As we elaborate below, dependencies in FDI can take on a number of other structural forms. Metulini et al. (Reference Metulini, Patuelli and Griffith2018) develop a spatial model for dyadic data that would be quite appropriate for dyadic FDI, as it adjusts for zero inflation. However, the model they develop does not estimate dependencies directly. Rather, they develop a method to filter out sender, receiver, and network sources of autocorrelation. We seek to build upon the progress made in understanding spatial dependence in FDI by studying forms of dependence that characterize the complete network of FDI connections among countries. Given the intertwined linkages among MNCs and the expansion of global production networks (Baldwin, Reference Baldwin2011; UNCTAD, Reference UNCTAD2013), we expect that high-order network structures should play an important role in shaping the pattern of FDI flows as well.
2.1 Reciprocity of FDI flows
Conventional dyadic models of FDI flows typically imply reciprocity. The institutional and cultural distance literature suggests that FDI is more likely to flow between a pair of countries that are institutionally and culturally similar, share common languages and colonial ties, and are in an alliance relationship or tied by migrant networks (e.g., Eden and Miller, Reference Eden and Miller2004; Leblang, Reference Leblang2010; Li and Vashchilko, Reference Li and Vashchilko2010). Note that this type of reciprocity is based on covariates. Existing literature has not yet studied the reciprocity arising from the interdependence of the outcome variable itself. That is, FDI from country i to country j increases the probability of investment from country j to country i.
We argue that the reciprocity of FDI stems from the fact MNCs act as agents of transmitting information about their home countries, which is facilitated by the existence of global production networks; The information diffusion helps to reduce host-country firms’ transaction costs of investing in MNCs’ home countries, thereby increasing the likelihood of reciprocal flows of investment. Investing in a foreign country incurs a “liability of foreignness.” Foreign firms have disadvantages compared with indigenous firms because the former are unfamiliar with the business practices and institutional environments and face a legitimacy issue due to greater scrutiny from the public in the host country (Hymer, Reference Hymer1976; Zaheer, Reference Zaheer1995; Kostova and Zaheer, Reference Kostova and Zaheer1999). This unfamiliarity and legitimacy issue induces extra business costs that often deter foreign entry. Existing MNCs actually help diffuse information about business practices and institutional environments in their home country (Simmons and Elkins, Reference Simmons and Elkins2004; Kwok and Tadesse, Reference Kwok and Tadesse2006). This kind of information diffusion is particularly strong in the existence of global production networks. For example, it can happen within MNC's global production networks via vertical linkages to their upstream suppliers and downstream customers. More generally, information diffusion can occur through the spillover of knowledge and management know-how from MNCs to local firms. Consequently, local firms in the host country acquire more information about investment opportunities, business practices, government policies, and so on, thereby reducing information asymmetry and the liability of foreignness when investing in MNCs’ home country.Footnote 3 All else being equal, we therefore should expect that firms in country i are more likely to invest in country j if firms from country j hold a high stock of investments in country i.
Hypothesis 1: FDI flows are reciprocal.
An old literature has studied MNCs’ oligopolistic expansion strategy (Kindleberger, Reference Kindleberger1969; Hymer, Reference Hymer1976), which can also result in the reciprocity of FDI. MNCs arise from exploiting their firm-specific assets to overcome imperfections in arm's-length markets (Dunning, Reference Dunning1992; Caves, Reference Caves1996). These proprietary assets include, for example, advanced technology, brand names, product differentiation, and managerial and advertising skills, which possess substantial economies of scale. To make the most use of their firm-specific assets and best exploit economies of scale, MNCs actively seek to expand market shares. Yet, an MNC's successful expansion into a foreign market generates disruptive effects, threatening the market positions of local firms. To secure their competitive positions and obtain advantages stemming from large-scale operations, local firms have incentives to undertake a rivalrous expansion with highly differentiated products into the home market of the MNC (Veugelers, Reference Veugelers1995).Footnote 4 This rivalistic strategy leads to reciprocal flows of FDI (Graham, Reference Graham1978). We expect this kind of reciprocal FDI flows is more prevalent among developed countries because they are primarily market seeking and firms in developed countries have accumulated sufficient intangible assets that enable them to succeed in foreign markets.
Historically, global investment activities have been dominated by MNCs from developed countries and characterized by a pattern of two-way flows (Julius, Reference Julius1990, 22). Although this means reciprocity has been conditional on the level of development of the states in a dyad, the pattern has been changing. On the one hand, developing countries become increasingly popular investment destinations. In 2012, developing countries as a whole received more FDI than developed countries for the first time ever (UNCTAD, Reference UNCTAD2013). On the other hand, we have also witnessed a surge of FDI from, and increasingly between, developing countries since the beginning of the 21st century. The percentage of outward FDI from developing and transition economies has grown from 8.78 percent in 2001 to 29.42 percent in 2017, with a peak in 2013 (approximately 35.54 percent of the world total). Yet, investing abroad incurs large fixed costs and firms need to overcome the disadvantages such as liability of foreignness they face when competing with indigenous firms in the host country. Therefore, only the most productive firms are able to engage in FDI activities (Helpman et al., Reference Helpman, Melitz and Yeaple2004). Given that MNCs from developing countries are still smaller and less competitive than their counterparts from developed countries, we expect that developing countries are less likely to reciprocate FDI. In our empirical analysis, we explicitly model this actor heterogeneity.
2.2 Transitivity/clustering of FDI flows
Transitivity, sometimes referred to as clustering, would manifest as dense triads of FDI emerging in the FDI network. We argue that the transitivity of investment activities arise from the expansion of global production networks and a safety net created by existing FDI linkages. One distinct feature of today's globalization is the increasing fragmentation and dispersion of production processes and the dramatic expansion of global supply chains (Baldwin, Reference Baldwin2011; UNCTAD, Reference UNCTAD2013). At the center of global production networks are MNCs, which coordinate global supply chains through complex networks of their foreign affiliates, subcontractors, or arm's-length suppliers (UNCTAD, Reference UNCTAD2013, xxii). These intertwined production networks give rise to the transitivity of FDI activities.
In a direct way, an MNC's establishment of foreign affiliates will be followed by investment of their upstream suppliers or downstream customers, who have also invested in the MNC's home country. This type of production connection will lead to multiple triadic closures of investment flows. Consider a case of three countries: A, B, and C. Suppose a firm from A invests in B as a supplier to a firm in B. If the firm in B establishes a foreign affiliate in C, the firm from A likely follows and makes an investment in C to serve the foreign affiliate, thereby leading to a triadic closure of investment flows.
Note that suppliers do not necessarily need to undertake an overseas investment to serve a leading firm. Alternatively, suppliers can choose to export intermediate goods to a leading firm. Yet, the aforementioned triadic closures of investment flows are not uncommon because leading firms tend to favor near suppliers due to an industry clustering effect or high transportation and trade costs (Carr et al., Reference Carr, Markusen and Maskus2001). For example, Volkswagen's investment in Skoda Auto in Czech Republic not only attracted other auto makers such as PSA Peugeot and Toyota, but also its international suppliers of parts and components to acquire local firms or build new factories; “As of 2002, there were 270 firms operating in the Czech Republic, representing 45 percent of the top 100 world suppliers of automotive parts and components” (Kaminski and Javorcik, Reference Kaminski, Javorcik and Broadman2005, 352). Similarly, Volkswagen's recent investment in Ningbo-Hangzhou Bay New Zone in China has brought in suppliers from South Korea, France, and the United States.Footnote 5 Airbus's establishment of its A320 assembly line in Tianjin, China has attracted investments from its global suppliers to the Tianjin Airport Economic Zone and contributed to an aviation industry cluster with an output estimated to exceed 100 billion Chinese yuan in 2020.Footnote 6 In India, investments by auto makers such as Toyota, Hyundai, and Ford also brought in their international component suppliers (Moran, Reference Moran2014, 23).
More generally, when two countries are tied to a third country via FDI, these FDI linkages create a safety net that protects MNCs from host governments’ opportunistic and predatory behavior and thus facilitates capital movements between these two countries, thereby resulting in a triadic closure of investment flows (i.e., the transitivity of FDI). Although direct asset expropriation has been rare since the late-1970s, political risk such as subtle policy changes remains a primary concern of investors (Graham et al., Reference Graham, Johnston and Kingsley2018), because footloose capital becomes an “obsolescent bargain” due to its ex post immobility (Vernon, Reference Vernon1971, Reference Vernon and Winchester1980). When two countries are connected to a third country via FDI, which typically involves the expansion of global production networks, it significantly constrains governments’ policy discretion. This is because the proper functioning of global production networks hinges crucially on the cooperation and coordination of the countries involved. For example, Johns and Wellhausen (Reference Johns and Wellhausen2016) show that host governments are less likely to expropriate foreign firms when they are closely connected to firms in host countries through supply chains. Dorussen and Ward (Reference Dorussen and Ward2010) demonstrate that countries are less likely to have conflicts with each other when they are more embedded in the trade networks. Similarly, Kim and Solingen (Reference Kim and Solingen2017) find that East Asian countries that are deeply integrated into global production networks are more likely to promote cooperation and peace between each other.
This risk-mitigating effect of the safety net is magnified when two countries are integrated into the same global production networks coordinated by leading MNCs in a third country. Consider an example that MNCs in country A offshore their production or other operating activities via FDI to countries B and C; local firms in countries B and C may also be integrated into these production networks as either upstream suppliers or downstream customers. In such a case, all three countries have strong incentives to ensure the well functioning of the network for economic benefits and thus are less likely to engage in opportunistic or predatory behavior, thereby providing a safety net for investors. Consequently, firms in countries B and C are also more likely to invest in each other, contributing to the transitiveness of FDI.Footnote 7 In general, when two countries are tightly linked to a third country through investment flows, FDI should be more likely to flow between these two countries due to shared economic interests and reduced political risk. Therefore, we expect that FDI has a high probability to flow among two countries that have strong investment ties to the same third country, resulting in the transitivity/clustering of investment activities.
Hypothesis 2: FDI flows are transitive.
It is important to note that our theory suggests that the reciprocity and transitivity of FDI is not a result of the global bilateral tax treaty (BTT) networks or the existence of tax havens.Footnote 8 Scholars have studied the implications of global BTT networks and tax havens for MNCs to create complex corporate structures for tax avoidance (e.g., Arel-Bundock, Reference Arel-Bundock2017b). For example, Google's “Double Irish Dutch Sandwich” corporate structure helped lower the company's effective tax rate to 2.4 percent on non-US income.Footnote 9 This corporate structure results in complex financial flows between the parent company and its foreign affiliates and among foreign affiliates themselves. Yet, a complex single-firm corporate structure or financial flows within the corporate structure do not lead to the reciprocity and transitivity of FDI. This is because investments from the parent company to its foreign affiliates are one-way flows and profits repatriation and interest, dividends or royalties payments within the corporate structure are not registered as FDI (see, Kerner, Reference Kerner2014).
3 Data and research design
To test our hypotheses, we estimate a gravity model of FDI. The dependent variable is bilateral FDI stock.Footnote 10 The data are from UNCTAD, covering the time-period of 2001 to 2012.Footnote 11 Most existing empirical studies on FDI use monadic data because scholars are primarily interested in how host countries’ economic and political characteristics affect capital inflows.Footnote 12 The advantage of using dyadic data is that it allows us not only to model network relationships, but to measure changes in FDI flows related to covariates that are at the dyad level, such as bilateral investment treaties (BITs), alliances, and bilateral trade. Following common practice (e.g., Hyun, Reference Hyun2006; Bénassy-Quéré et al., Reference Bénassy-Quéré, Coupet and Mayer2007), we take the natural log of the FDI stock variable (adding 1 before logging). After logging, we multiply the logged values by two to reduce variation lost in the values in the final step of rounding to the nearest integer. This transformation is designed to (1) reign in the extreme outliers present in FDI stock data, and (2) construct a variable that can be modeled as a count while preserving variation.Footnote 13
3.1 Covariates
In the gravity model, we include the log product of the dyad's real GDP and logged Euclidean distance. Generally, higher GDP represents a larger market and therefore should be associated with more FDI, while an increase in geographic distance increases investment costs, decreasing investment flows. For the purpose of model convergence, the logged product of dyadic GDP has been estimated as one variable in the model, rather than being estimated separately. In addition, we include both origin and destination countries’ GDP per capita to roughly control for relative factor endowments.Footnote 14
Other economic controls include origin and destination countries’ trade openness (trade as % of GDP) and bilateral trade volumes between the origin and destination countries. Existing research has shown that FDI and trade are compliments (Markusen, Reference Markusen1995; Aizenman and Noy, Reference Aizenman and Noy2006). We expect that higher levels of trade openness and bilateral trade will be associated with higher levels of bilateral FDI. Trade openness data are from the World Bank's World Development Indicators and trade volume is from the OECD (2016).
There is a substantial amount of research that explores the relationship between democratic institutions and FDI inflows; yet empirical results to date remain inconclusive (see, e.g., Jensen, Reference Jensen2003; Jakobsen and De Soysa, Reference Jakobsen and De Soysa2006; Arel-Bundock, Reference Arel-Bundock2017a; Li et al., Reference Li, Owen and Mitchell2018; Wright and Zhu, Reference Wright and Zhu2018). We include standard polity scores as a measure of a country's level of democracy (Marshall and Jaggers, Reference Marshall and Jaggers2010). We also include three international institutions variables: BITs, PTAs, and OECD membership. BITs are included as a binary variable that is one if the pair have a stand-alone BIT or are party to a preferential trade agreement that also covers investment policy. These treaties should be positively associated with FDI levels as they should effectively remove barriers to investment and provide commitment to liberal economic policies (e.g., Büthe and Milner, Reference Büthe and Milner2008; Osnago et al., Reference Osnago, Rocha and Ruta2016). PTAs vary significantly in depth with some requiring nearly full liberalization of trade barriers while others are superficial political signals. Therefore we make use a recent PTA depth variable that uses latent trait analysis with 48 different dichotomous variables regarding topics covered in PTAs.Footnote 15 Signing a PTA represents a commitment to liberal markets that investors would favor and therefore would be associated with increased FDI inflows (Büthe and Milner, Reference Büthe and Milner2008, Reference Büthe and Milner2014). OECD membership is included as a binary node-level homophily variable that is one when both countries are either OECD members or both are not OECD members. This variable adjusts for OECD-based homophily and is expected to be positive.
In addition, we include two sets of international agreement variables. The first is a binary variable for a combination of military alliance treaties that are not defense treaties. The second is a defense treaty. Both are from Gibler (Reference Gibler2009). We expect these variables to be positively associated with FDI inflows, particularly defense treaties since this indicates political cooperation and low political risk (Li and Vashchilko, Reference Li and Vashchilko2010).Footnote 16
3.2 Model and specification: the count ERGM
Like other forms of the ERGM, the count ERGM is a statistical model that operates on a complete network. To specify the count ERGM, the researcher selects two types of network statistics—those that relate tie values to observed covariates (i.e., covariate effects), and those that relate the ties to each other via higher-order network structure (i.e., network effects). The ERGM family of models is innovative in that both of these statistic types—covariate effects and network effects—can be included in the same model. Including the network effects helps to accurately identify the true covariate effects (Metz et al., Reference Metz, Leifeld and Ingold2019). Under Krivitsky's (Reference Krivitsky2012) count ERGM, the probability of the observed n × n network adjacency matrix y is

where g(y) is the vector of network statistics used to specify the model, θ is the vector of parameters that describes how those statistic values relate to the probability of observing the network, h(y) is a reference function defined on the support of y and selected to affect the shape of the baseline distribution of dyadic data (e.g., Poisson reference measure), and κh,g(θ) is the normalizing constant.
3.2.1 Specification
In the models we specify, we use statistics that model the shape of the individual edge distributions (i.e., the shapes of directed dyadic FDI flows), model the dependencies we have described above, and account for the effects of exogenous covariates. Network statistics in an ERGM model local dependencies, just like conventional covariates, but are expressed at the network-level because that is how they are incorporated into the ERGM probability distribution (Desmarais and Cranmer, Reference Desmarais and Cranmer2012). Analogous to selecting covariates to include in a regression model, ERGM software packages present several options for adding network statistics to the model. The statistics we use to account for the individual edge distribution include (1) the sum of edge values, which models the average edge value; (2) the sum of square-root values of edges, which accounts for dispersion; and (3) the number of non-zero edges, which accounts for the prevalence of zeros in the edge values.
We include two statistics to model the dependencies that correspond to our hypotheses. First,

in which we add up the lowest edge value within each dyad. If edges are reciprocated, this statistic will increase due to the co-occurrence of large edge values within the same dyad. To evaluate our hypothesis regarding the higher degree of reciprocity among developing countries, we fit two separate reciprocity terms—one that applies to dyads in which both states are OECD members, and one that applies to every other dyad (i.e., both non-OECD, and mixed dyads that include an OECD and non-OECD state).Footnote 17 Second,

which accounts for the degree to which edge (i, j) co-occurs with pairs of large edge values with which edge (i, j) forms a transitive (i.e., non-cyclical) triad with weighted, directed two-paths going from nodes i to k to j. Exogenous covariates are accounted for with statistics that measure the degree to which large covariate values co-occur with large edge values. First,

measures this co-occurrence at the level of the directed dyad, in which there is a dyadic observation of the covariate corresponding to each potential FDI flow. Second, there are two statistics that account for node (i.e., country) level covariates. Each statistic takes the product of the node's covariate value and a sum of the edge values in which the node is involved. The first, “Sender Covariate,” uses the sum over the edges that the node sends. The second, “Receiver Covariate,” uses the sum over the edges that the node receives.
We use the count ERGM implementation of Krivitsky's (Reference Krivitsky2012) made available in the ergm.count (Krivitsky, Reference Krivitsky2016) package in R statistical software. The normalizing constant in the likelihood function for the count ERGM (i.e., the denominator in Equation 1) is given by

where $\bf {{\cal Y} }$ is the set of all possible count network configurations, and h(y) = ∏i,j(y i,j!)−1 is the Poisson reference measure, which assures that (1) the normalizing constant is a convergent sum, and (2) produces an edge-wise conditional Poisson distribution if there are no dependence terms in the model. As with the binary ERGM, the normalizing constant in the count ERGM is computationally intractable, and must be approximated. Estimates of θ are calculated using Monte Carlo maximum likelihood (MC-MLE).
We estimate a separate model for each year from 2002 to 2012. We have two main reasons for presenting year-by-year estimates as our main results. First, since analyzing dyadic data essentially squares the size of the data when compared to the monadic level, we have enough data to identify a separate set of parameter values in each year. Second, recent international relations applications have called into question the appropriateness of pooling over long time periods since there may be considerable historical heterogeneity in the parameter values, and have estimated separate models for each year or time period (see, e.g., Ward and Hoff, Reference Ward and Hoff2007; Cranmer et al., Reference Cranmer, Heinrich and Desmarais2014). In the results we present below, we see that many of the parameters vary considerably over time. In particular, several parameters exhibit significant shifts in magnitude and statistical significance beginning in 2008—a pattern that is likely attributable to the Great Recession. We present time-pooled results in Supplementary Appendix C, and find that our results are robust.
4 Results
Throughout this section, we compare two specifications of the count ERGM—one that assumes conditional independence among the edge values (i.e., the independence model), and the full specification that includes dependence terms. The only two terms that are excluded from the independence model are the reciprocity and transitivity terms. Before discussing individual effects, we first assess the relative fit of the independence and network models. Figure 1 presents the difference in Bayesian information criterion (BIC) between the independence and network models for each year in our analysis. We see that the BIC in the independence model is higher than that in the network model for each year, which provides robust evidence that the network model is a better fit for the data than the independence model over the time period that we study.Footnote 18
Difference in BIC between independent and network models.

Turning to the findings regarding network effects, which are presented in Figure 2, we see that the transitivity effects are positive and statistically significant in each year. Additionally, reciprocity is significant and positive in every year for OECD pairs and for non-OECD pairs the coefficient is gradually converging to that of OECD pairs. This convergence of coefficients for reciprocity is consistent with our expectation that reciprocity is prevalent among developed countries and developing countries have begun to reciprocate FDI. It illustrates that reciprocity characterizes the entire FDI network, not just highly developed countries. Generally, these results offer robust evidence that FDI flows are interdependent according to these two canonical forms of network structure. Although these forms of network dependence are common in networks, they are not inherent and therefore this finding is significant and as substantively important as findings regarding conventional exogenous covariates.
Estimates of network terms in Poisson ERGMs. Bars span 95 percent confidence intervals. The confidence intervals are not visible due to being small and the large range.

In Figure 3 we present visualizations of the effects of the dependence terms. To measure these effects we begin with a simulation exercise in which we simulate networks using both the full model with dependence terms, and the null model based only on covariates. We then classify each simulated edge value in terms of the value of the local version of the dependence term operating on that edge. For example, when it comes to the reciprocity effect, we classify each simulated edge value (y i,j) in terms of the value of the mutual edge (y j,i). Finally, we estimate the difference in means between the edge values simulated from the full and null models at each dependence term value. This difference in means can be interpreted as the effect on predicted edge values of accounting for the respective dependence term in the model. The dependence effects can result in differences in predicted edge values in the range of 1–5 in log-scale FDI. The standard deviation in log-scale FDI stock (in 2012—the year we use for the interpretation plots) is 2.40. We see that the scale of both the reciprocity and transitivity effects are significant, with a shift from lower values of the relevant dependence edge to higher values resulting in more than a standard deviation increase in the predicted edge value. One other feature of these interpretation plots that is notable is the dip in the difference in means for the transitivity effect at moderate edge values. This happens because, absent the dependence effects, the independence model attributes some of the clustering in the network to exogenous covariates.Footnote 19
Plots depict the difference in predicted value (y-axis) that is attributable to the respective dependence effect, averaged over all dyads in the network. Interpretation plots are based on 1,000 FDI stock networks simulated from the 2012 model. Tie weights are measured on the natural logarithm scale. Predicted value differences are calculated by taking the differences between expected dyad values simulated from the full model with dependence terms and the null model that is based on covariates only. Error bars span 95 percent confidence intervals for the difference in means.

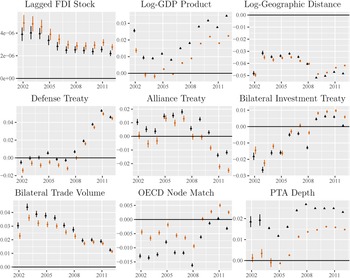
Network control terms, presented in Figure 4, are all significant. A positive sum of edges, the intercept term, is expected since the floor value is zero. The significant values for sum square root of edges indicate the dependent variable is over-dispersed relative to a Poisson distribution and the significant values for non-zero edges show a high level of zero inflation. Regarding edge covariate determinants, presented in Figure 5, that FDI flows between a dyad are most strongly and positively correlated with bilateral trade volume and most strongly and negatively associated with distance. In addition, we see that many coefficient values are not stable over time and nearly every variable changes significantly after 2007 when the Great Recession began. The shift mainly shows an increase in coefficient values for institutional agreements after the recession began. One possible explanation is that concerns about global economic uncertainty might predominate in investment decisions at that time, so bilateral institutional relationships play a more important role.
Estimates of network control terms in Poisson ERGMs. Bars span 95 percent confidence intervals. Black coefficient representations are from models excluding dependence terms (i.e., transitivity and reciprocity). The confidence intervals are not visible due to being small and the large range.

Estimates of exogenous edge terms in Poisson ERGMs. Bars span 95 percent confidence intervals. Black coefficient representations are from models excluding dependence terms (i.e., transitivity and reciprocity). For some models, the confidence intervals are not visible due to being small and the large range of the coefficient estimates.

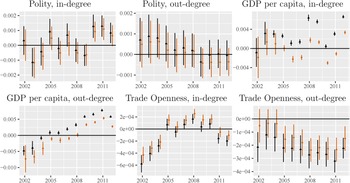
Regarding node covariate determinants, presented in Figure 6, coefficients are often small or insignificant and even flip signs during the time sample.Footnote 20 For example, host countries’ level of democracy is not a significant predictor of inward FDI in most years except for 2010–2012. This finding is not quite consistent with the claim that democratic institutions help states to make credible commitments and thus attract FDI (e.g., Jensen, Reference Jensen2003; Henisz, Reference Henisz2000). We note three points here. First, our dependent variable is different from those in the previous research, which study net FDI inflows. Li et al.'s (Reference Li, Owen and Mitchell2018) recent metaregression analysis shows that the relationship between democracy and FDI inflows is sensitive to the choice of the FDI variable (i.e., the level of net FDI inflows versus the share of net FDI inflows over GDP). Second, we model dyadic FDI while most existing studies focus on aggregate FDI inflows (monadic FDI). Third, more recent studies have shown that political institutions have little explanatory power despite their statistical significance (Arel-Bundock, Reference Arel-Bundock2017a) and that the effect of regime type on FDI is industry specific (Wright and Zhu, Reference Wright and Zhu2018). Further research is needed to adjudicate the advantages and disadvantages of democratic institutions and how they matter to different investors.
Estimates of exogenous node terms in Poisson ERGMs. Bars span 95 percent confidence intervals. Black coefficient representations are from models excluding dependence terms (i.e., transitivity and reciprocity). For some models, the confidence intervals are not visible due to being small and the large range of the coefficient estimates.

We noted above that omitting dependent network structure, a condition that characterizes previous research on FDI, can result in biased estimates and improper standard errors. For several effects, the results are substantively changed by adding the network parameters. In general, the edge terms are more sensitive to the inclusion of network terms, but node terms are still impacted. Notably, the effects of PTA depth, log-GDP product, and the homophily effect of OECD membership are consistently lower in magnitude when estimated with the network effects. The in-degree effect of GDP per capita is even estimated to be statistically significant with different signs in the independence and network models. For each of these effects, omitting the network dependencies leads an overestimate of the effect of the respective variable, a type 2 inferential error in which the null hypothesis of no effect is incorrectly rejected, or a rejection of the null hypothesis in the incorrect direction. This finding shows that, even if a researcher is not theoretically interested in network dependencies, they should still incorporate them in order to avoid misspecification bias.
5 Conclusion
We adopt a novel network approach to understand what accounts for the patterns of cross-border investment flows in the age of complex interdependence. Empirically, we introduce the count ERGM to test our hypotheses. The results of our statistical models confirm that these dependencies exist over the time period we analyze. For example, a country will receive more FDI from the country that its MNCs have already invested in and from another country when both of them have investment ties with the same third-party country. One policy implication for developing countries is that they should actively attract leading MNCs and integrate themselves into global production networks in order to attract more FDI.
We should emphasize that our theory, specification, and finding of network-wide conditional reciprocity and transitivity represent just the start in a broader scholarly dialog on the network science of FDI flows. One limitation of our study is that we do not model any forms of conditional variation in transitivity, though we have accounted for actor heterogeneity in reciprocity. For example, if vertical FDI is the main form in triadic closures of investment flows, we should expect transitivity to be more prevalent among groups with different factor endowments (e.g., groups with both developed and developing countries). It is thus important to explore further how network dependencies vary across different groups of countries.Footnote 21 A second limitation is that we are not able to examine the network dependencies of FDI in earlier time periods because our data covers the time period of 2001–2012 only. A third limitation is that our count ERGM does not sufficiently fit the variation in FDI sender activity—a shortcoming that could be addressed through future development of specifications for count ERGMs. Finally, given the constraint of data availability, we have to rely on aggregate FDI data at the country level, though our theory is built on the logic of firm-level investment decisions.
Supplementary material
The supplementary material for this article can be found at https://doi.org/10.1017/psrm.2020.45.
Acknowledgments
This work was supported by NSF grants SES-1558661, SES-1619644, SES-1637089, CISE-1320219, SMA-1360104, and IGERT Grant DGE-1144860. Any opinions, findings, and conclusions or recommendations are those of the authors and do not necessarily reflect those of the sponsor.