


Why do people vote? The classic paradox of turnout has puzzled theorists for years (Aldrich Reference Aldrich1993; Downs Reference Downs1957; Feddersen and Sandroni 2006; Riker and Ordeshook Reference Riker and Ordeshook1968). When one person votes, everyone with the same preferences benefits from the increased likelihood that their preferred outcome will result. Yet those who do vote must bear the cost of time and effort required to learn about election alternatives and go to the polls. In large populations, the probability that a single vote will change the outcome of an election is miniscule (Gelman, King, and Boscardin 1998), meaning that even very small costs to the individual typically outweigh the expected benefits he or she would receive from voting. As a result, classic game theoretic models that assume individuals are self-interested and fully optimizing in their behavior show that the equilibrium amount of voter turnout approaches zero as the population becomes large (Palfrey and Rosenthal Reference Palfrey and Rosenthal1985). Yet in spite of this theoretical result, millions of people do vote, suggesting that something other than self-interest or optimizing behavior drives their decision (Bendor, Diermeier, and Ting Reference Bendor, Diermeier and Ting2003; Feddersen and Sandroni 2006; Fowler Reference Fowler2006b). In addition, the fact that millions of people abstain suggests that there may be inherent variation in the human tendency to participate in politics.
Empirical models of turnout and political participation have tried to explain this variation using numerous covariates inspired by a vast literature (Plutzer Reference Plutzer2002; Timpone Reference Timpone1998; Verba, Schlozman, and Brady Reference Verba, Schlozman and Brady1995), including demographic factors like age (Strate et al. Reference Strate, Parrish, Elder and Ford1989), gender (Schlozman et al. Reference Schlozman, Burns, Verba and Donahue1995), race (Verba, Schlozman, and Brady Reference Verba, Schlozman and Brady1993), marital status (Stoker and Jennings Reference Stoker and Jennings1995), education (Leighley and Nagler Reference Leighley and Nagler1992a), income (Leighley and Nagler Reference Leighley and Nagler1992b), occupational prestige (Nie, Powell, and Prewitt Reference Nie, Powell and Prewitt1969a; Nie, Powell, and Prewitt Reference Nie, Powell and Prewitt1969b), and home ownership (Highton and Wolfinger Reference Highton and Wolfinger2001); attitudinal and behavioral factors like interest in the campaign (Verba, Schlozman, and Brady Reference Verba, Schlozman and Brady1995), access to political information (DiMaggio, Hargittai, and Neuman Reference DiMaggio, Hargittai and Neuman2001), general political knowledge (Galston Reference Galston2001), strength of partisanship (Huckfeldt and Sprague Reference Huckfeldt and Sprague1992), feelings of civic duty (Blais and Young Reference Blais and Young1999), internal and external efficacy (Finkel Reference Finkel1985), political trust (Hetherington Reference Hetherington1999), church attendance (Cassel Reference Cassel1999), personal skill acquisition (Brady, Verba, and Schlozman Reference Brady, Verba and Schlozman1995), humanitarianism (Jankowski Reference Jankowski2007), altruism (Fowler Reference Fowler2006a), and patience (Fowler and Kam Reference Fowler and Cindy2006); social factors like interpersonal communication (McLeod, Scheufele, and Moy Reference McLeod, Scheufele and Moy1999), social identification (Fowler and Kam Reference Fowler and Cindy2007), group consciousness (Miller, Gurin, and Gurin Reference Miller, Gurin and Gurin1981), socialization (Cho Reference Cho1999), the status of neighbors (Huckfeldt Reference Huckfeldt1979), political disagreement (Mutz Reference Mutz2002), and social capital (Lake and Huckfeldt Reference Lake and Robert1998); and institutional factors (Jackman and Miller Reference Jackman and Miller1995) like closeness of the election (Shachar and Nalebuff Reference Shachar and Nalebuff1999), contact from political organizations (Wielhouwer and Lockerbie Reference Wielhouwer and Lockerbie1994), campaigns (Ansolabehere et al. Reference Ansolabehere, Iyengar, Simon and Valentino1994), civic education (Somit et al. Reference Somit, Tanenhaus, Wilke and Cooley1958), polling locations (Gimpel and Schuknecht Reference Gimpel and Schuknecht2003), and barriers to registration (Rosenstone and Wolfinger Reference Rosenstone and Wolfinger1978).
Yet in spite of this everything-but-the-kitchen-sink approach, these models usually fit poorly to the data (Matsusaka and Palda Reference Matsusaka and Palda1999). For example, one prominent model includes 32 variables but accounts for only 31% of the variance in turnout (Plutzer Reference Plutzer2002). Moreover, the theories underlying these empirical models typically ignore genetic or biological sources of variation. Although political scientists are unlikely to oppose the idea that biology plays a role in political participation, in print we hardly ever include this as a possibility. For example, the large literature on the role of parents in voter turnout nearly always suggests that the link between parent and child is the result of the transmission of norms rather than the transmission of genes (Plutzer Reference Plutzer2002). As a result, our best work on the subject frequently leaves the impression that political participation is determined exclusively by environmental factors.
Recently, social scientists have learned that variation in basic political attitudes like liberalism and conservatism can be attributed to both genes and environment (Martin, et al. Reference Martin, Eaves, Heath, Jardine, Feingold and Eysenck1986; Alford, Funk, and Hibbing Reference Alford, Funk and Hibbing2005; Eaves and Hatemi 2008; Hannagan and Hatemi Reference Hannagan and Hatemi2008), even as early as adolescence (Abrahamson, Baker, & Caspi, Reference Abrahamson, Baker and Caspi2002). While the choice of a particular candidate or party does not appear to be heritable (Alford, Funk, and Hibbing Reference Alford, Funk and Hibbing2005; Hatemi et al. Reference Hatemi, Medland, Morley, Heath and Martin2007), it remains an open question whether or not the act of voting (or, more broadly, any act of political participation) is heritable. Given the difficulty scholars have had in explaining participation solely based on environmental accounts, we hypothesize that a significant portion of the variation in voter turnout behavior can be attributed to genetic factors.
Although we are not the first to suggest a link between genes and political participation, this study is the first attempt to test the idea empirically. Some early work studied the importance of personality in political participation, but this literature focused exclusively on environmental factors, asserting that people who are reared in similar ways will have similar personalities (Lane Reference Lane1959; Levinson Reference Levinson1958) or that the role of personality was to mediate social influences on participation (Krause et al. Reference Krause, Houlihan, Oberlander and Carson1970). Other early work explored the importance of adolescent socialization in the development of political behaviors, but these scholars never considered the genetic link between parent and child. Merelman (Reference Merelman1971) addressed this shortcoming, arguing that both genes and environment are probably important. In fact, he explicitly recommended the use of twin studies to investigate the heritability of political participation. In his view, the main reason heritability had been ignored was due to the difficulty in statistical design and testing:
“[T]his natural tendency to examine one environmental factor after another ad infinitum does a genetic explanation something of an injustice. The problem is that while we can examine environmental variables directly, we can usually only infer genetic effects, and so our natural tendency is to slight the latter perspective. In short, our procedures, following the line of least methodological resistance, impinge heavily upon our theoretical perspectives.” (1044)
In spite of Merelman's exhortation, genetic studies of participation were not forthcoming. Scholars continued to focus on personality factors underlying participation like efficacy (Finkel Reference Finkel1985) and self-esteem (Sears Reference Sears1987) without mentioning the fact that these factors may themselves be heritable. A few scholars have consistently argued on general principle that genes must play a role in political behaviors like participation (Carmen Reference Carmen2004; Masters Reference Masters1990; Somit and Peterson Reference Somit and Peterson1998) but they have not empirically tested their genetic hypotheses. As a result, the current state of scientific knowledge on the heritability of political involvement is limited.
In this article we conduct three tests of the hypothesis that part of the variation in political participation can be attributed to genetic factors. The results of all three of our tests suggest that individual genetic differences make up a large and significant portion of the variation in political participation, even taking socialization and other environmental factors into account. Our results show participation is heritable and suggest that political science as a discipline should be thinking more about biological sources of variation in political behavior. In particular, we argue that these results open the door to an untapped realm of causal theories and empirical tests that will help us to improve our understanding of one of the most basic acts of citizenship and democratic government.
TWIN STUDIES
In order to estimate the heritability of voting behavior, we study the turnout patterns of (identical) monozygotic (MZ) twins who were conceived from a single fertilized egg and (non-identical) dizygotic (DZ) twins who were conceived from two separate eggs. MZ twins share 100% of their genes, while DZ twins share only 50% on average. Thus, if voting behavior is heritable, MZ twins should exhibit more concordance (both twins vote or both twins abstain) than DZ twins. Moreover, if we assume that MZ twins and DZ twins share comparable environments (more on this assumption below), then we can use these concordances to estimate explicitly the proportion of the overall variance attributed to genetic, shared environmental, and unshared environmental factors. Very few differences have been found between twins and non-twins (Kendler et al. Reference Kendler, Martin, Heath and Eaves1995), therefore we expect the results for twins to be generalizable to a non-twin population.
The twin study design has been shown to be an extremely powerful tool for identifying the relative degree to which genetic and environmental factors influence an observed outcome (Evans, Gillespie, and Martin Reference Evans, Gillespie and Martin2002; Neale and Cardon Reference Neale and Cardon1992). The basic twin model assumes that the variance in observed behavior can be partitioned into additive genetic factors (A), and environmental factors which are shared or common to co-twins (C), and unshared environmental (E). This is the so-called ACE model. The role of genotype and environment are not measured directly but their influence is inferred through their effects on the covariances between twin siblings (Neale and Cardon Reference Neale and Cardon1992). No observed covariates are needed in the model because the degree to which they contribute to variance is a part of one of three variance components (A, C, and E). More formally, these components are derived from known relationships between three observed statistics (Evans, Gillespie, and Martin Reference Evans, Gillespie and Martin2002):
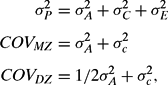
where σP2 is the observed phenotypic variance (the same for MZ and DZ twins), COVMZ and COVDZ are the observed covariances between MZ and DZ co-twins, and σA2, σC2, σE2 are the variance components for genes, common environment, and unshared environment, respectively. These relationships yield three equations and three unknowns, so it is possible to infer the unobserved portions of variance attributable to each factor.
Since the variance components are not directly observable, the ACE model's assumption of additivity cannot be tested and more complicated relationships are possible. For example, it is possible that genes interact with the environment (GxE) or with other genes (GxG) to yield variation in behavior, or at a higher level phenotypes interact with the environment (PxE) (Turkheimer and Waldron Reference Turkheimer and Waldron2000). We limit our analysis to the ACE model but point out that if a strong effect for genes is found in the additive model, then genes are also likely to play a role in more complex specifications.
Finally, it is important to clarify the difference between the common environment (C) and the unshared environment (E) in the twin model. Common environment includes the family environment in which both twins were raised, as well as any other factor to which both twins were equally exposed. In contrast, the unshared environment includes idiosyncratic influences that are experienced individually. It is possible to have unshared environmental exposure as a child (twins may have different friends with different political beliefs) and to have shared environments as an adult (twins may see the same election results). Thus, the distinction between common and unshared environment does not correspond directly to family—nonfamily or adult-child differences in factors that influence a given behavior. Moreover, there may be a similarity in the objective environment but twins may have idiosyncratic experiences that influence their effective environment that create an unshared rather than a common environmental influence on variation in the phenotype (Turkheimer and Waldron Reference Turkheimer and Waldron2000).
THE COMPARABLE ENVIRONMENTS ASSUMPTION
Some scholars have objected to the assumption that MZ and DZ environments are comparable, arguing that the identical nature of MZ twins cause them to be more strongly affiliated and more influenced by one another than their non-identical DZ counterparts. If so, then greater concordance in MZ twins might merely reflect the fact that their shared environments cause them to become more similar than DZ twins. However, studies of twins raised together have been validated by studies of twins reared apart (Bouchard Reference Bouchard1998), suggesting that the shared environment does not exert enhanced influence on MZ twins. Moreover, personality and cognitive differences between MZ and DZ twins persist even among twins whose zygosity has been miscategorized by their parents (Bouchard and McGue Reference Bouchard and McGue2003), indicating that being mistakenly treated as an identical twin by one's parents is not sufficient to generate the difference in concordance. And, although MZ twins are sometimes in more frequent contact with each other than DZ twins, it appears that twin similarity (e.g., in attitudes and personality) may cause greater contact rather than vice versa (Posner, Baker, and Martin Reference Posner, Baker and Martin1996). Finally, contrary to the expectation that the influence of the unshared environment would tend to decrease concordance over time once twins reach adulthood, MZ twins living apart tend to become more similar with age (Bouchard and McGue Reference Bouchard and McGue2003).
TURNOUT IN THE SOUTHERN CALIFORNIA TWIN REGISTRY
To assess the heritability of turnout behavior, we obtained electronic voter registration records for 3.8 million voters from Los Angeles County with complete vote histories for eight elections (three primary, two statewide, and three general) from 2000 to 2005 and matched them to the Southern California Twin Registry (Baker et al. Reference Baker, Barton, Raine and James2006), a list of MZ and DZ twins who live in the Los Angeles area. A principal advantage of this approach is the use of field evidence based on third-party observations of actual voter behavior rather than self-reports. This type of data is rarely used in twin studies and is an especially important source for evaluating political participation since a significant number of individuals who did not vote typically report that they did (Karp and Brockington Reference Karp and Brockington2005).
About 30% of the adult population in Los Angeles County is not registered to vote, so we cannot include them in our sample. We cannot merely assume that all unregistered twins chose not to vote—for example, it is possible that they died or moved out of the county and registered elsewhere. However, focusing on registered individuals allows us to exclude those who might generate false concordance because they are ineligible to vote due to foreign citizenship status—this is a particular concern in Los Angeles County where 22% of the total population are foreign citizens (2000 U.S. Census). It also allows us to avoid false concordance generated by individuals with cognitive or literacy deficits who are not capable of voting since these individuals probably do not register.
Twin registry and voter registration records were matched by surname, first name, birthdate, place of birth, and zip code. Full matches were automatically included in our data. Partial matches on three or more of these attributes were manually checked and included in the data if the failure to match fully was determined to be the result of a typographical error. We restricted our search to same-sex twin pairs because MZ twins are always same sex and DZ twins are not. Including opposite-sex twin pairs would complicate the analysis because we would have to assess whether differences in concordance between MZ and DZ twins are the result of closer social affiliation between same-sex pairs.
Out of 878 same-sex twins (535 MZ, 343 DZ) on the registry who live in Los Angeles County, this procedure yielded vote histories for 396 twins—168 MZ twins and 102 DZ twins in matched pairs, and 79 MZ and 47 DZ “singletons” where we found one twin in the pair but not the other.Footnote 1 A Mann Whitney U test suggests that the difference in the success rate for matching between MZ twins (48.6%) and DZ twins (43.4%) was not significant (p = 0.14).
Although we did not have access to information about the twins' socioeconomic status for the entire sample, we were able to use their addresses to look up estimated home values and square feet on the home appraisal web site zillow.com.Footnote 2 We also examined data from previous studies in which subsets of the matched twins had participated through the Southern California Twin Registry.Footnote 3 Although not available for the entire sample, these prior data are used to evaluate possible differences between MZ and DZ pairs that might explain their voting behavior.
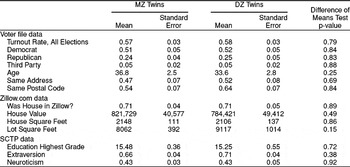
To test the comparable environments assumption for our sample, we performed a series of tests on the mean difference between MZ and DZ twins for a number of variables (see Tables 1 and 2). High p-values in Mann Whitney U tests suggest that differences between types of twins are not significant for rates of turnout (p = 0.79), Democratic Party membership (p = 0.84), Republican Party membership (p = 0.83), third party membership (p = 0.88), age (p = 0.25), house value (p = 0.49), house square footage (p = 0.86), and lot square footage (p = 0.15). Furthermore, t-tests of data obtained from previous studies of subsets of these twins revealed no differences in their education level (p = 0.72) or personality, including extraversion (p = 0.38) and neuroticism (p = 0.92). Thus, the similarity of the MZ and DZ twin samples suggests that differences in concordance cannot be explained by mean differences in political participation, political affiliation, personality, education, or other socioeconomic factors. We also note that in our sample MZ twins are not more likely than DZ twins to live at the same address (p = 0.69) or in the same postal code (p = 0.84). Thus, greater concordance in MZ twins is probably not due to higher frequency of contact.
Summary Statistics, by Zygosity, Los Angeles Sample

Note: These data show that we could find no significant differences in the MZ and DZ twin samples, suggesting that they are drawn from comparable environments. Data are derived from three sources: 1) the Los Angeles County voter registration and vote history files for matched twins, 2) housing characteristics for 71% of the matched twins found on zillow.com on October 25, 2006; and 3) education and personality information for 15% of the matched twins (this subsample is limited to those who participated in previous studies in which education and personality questions were asked). We utilized Mann–Whitney U tests to analyze differences in means in the voter registration and zillow data and t tests for the SCTP data.
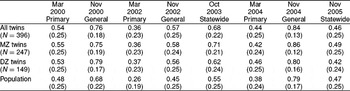
Comparison of Mean Turnout and Variance in Turnout in Twin Sample and General Population in Los Angeles County, by Election

Note: Variances are shown in parentheses.
It is important to note that we do not need to compare similarities between co-twins to test the comparable environments assumption. For example, if we show that MZ twins are more similar than DZ twins for income, then it means income attainment might be heritable but it has no bearing on whether or not MZ and DZ twins come from essentially similar environments. Conversely, we might find that MZ and DZ co-twins are equally similar on income, but this would not imply their environments were the same. The fact that MZ and DZ twins are drawn from households that have similarly distributed income suggests that there is nothing unique about MZ twins that could cause a spurious difference in the similarity of turnout via a difference in income. For example, if MZ twins were much richer than DZ twins, they might be more similar since wealthier households vote more. Since they are not richer, we can reject this possible explanation for why we find a difference in the similarity of turnout between MZ and DZ twins.
One might worry about the house values in Table 1, because they suggest that the subject pool is drawn from the more affluent part of the population (the average single family house at this time in Los Angeles county sold for about $600,000). However, this would only be important if it had a systematic effect on turnout. Table 2 shows that DZ twins and MZ twins do not exhibit systematically different rates of turnout in the different elections. Table 2 also shows that turnout rates for all twins were somewhat higher than those for the population, but this should not bias estimates of the magnitude of the difference in concordance between MZ and DZ twins. This is because the variances are not systematically different from the population (the twin variance is higher than the population variance in two elections and lower in three). If the twin variance were much lower than the population variance, this would compress the difference in the MZ and DZ twin concordances, causing us to underestimate heritability.Footnote 4 Conversely, if the twin sample variance were much higher than the population variance we would overestimate the effect of heritability. The lack of a systematic difference in the sample and population variances suggests that mean differences will not generate bias in the estimates.
INITIAL RESULTS AND THE BAYESIAN ACE MODEL
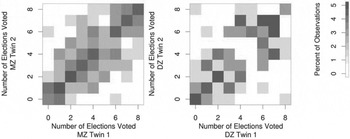
Figure 1 shows two two-dimensional density plots of the number of elections in which each twin chose to vote (MZ twins on the left, DZ twins on the right). The color of each square indicates the number of observations at each point, so for example, there is a strong mode for MZ twins where each twin voted exactly twice (the point 2,2 contains about 7% of the MZ sample). With this representation we lose resolution because it is possible for both twins to vote in the same number of elections without voting at the same time (e.g. twin 1 might vote in two primaries and twin 2 might vote in two general elections). Nonetheless, patterns start to emerge. There appear to be more observations on the main diagonal for MZ twins, and DZ twins appear to be more likely to have large differences in the frequency they vote. We can analyze the pattern of voting statistically by examining the number of times each twin pair differs (one votes and one abstains). A simple t test of the absolute difference in co-twin voting behavior suggests that MZ twins are significantly more similar than DZ twins (p = 0.045, mean number of times co-twins made different decisions for MZ = 1.45, DZ = 2.00).
Comparison of Co-Twin Voting Behavior in Los Angeles by Zygosity

In the behavior genetics literature a simple comparison of polychoric correlations is frequently used as a first test of the rate of twin concordance in behavior (for a detailed explanation of this method, see Alford, Funk, and Hibbing Reference Alford, Funk and Hibbing2005). In our pooled observations, the correlation in turnout was significantly higher (p = 0.006) between the MZ twins (0.71) than the DZ twins (0.50).Footnote 5 Another simple and direct way to see if zygosity influences co-twin similarity is DeFries-Fulker regression (DeFries and Fulker Reference DeFries and Fulker1985). In this method, the dependent variable is each twin's behavior and the independent variables are zygosity, the co-twin's behavior, and an interaction of the two. If the interaction term is significant, it means that MZ twins are statistically more likely to exhibit the same characteristics than DZ twins. We use a general estimating equation (GEE) to correct for multiple observations on the same twin pair and find that the interaction coefficient is indeed significant (Wald statistic = 4.38, p = 0.036).
However, these measures are only a crude guide since they treat every choice as the same and they make no provision for the unique information contained in each election. For example, suppose everyone voted in the first election but only half voted in the second—the first election would not be very informative about the individual tendency to vote since there was no variation, but the second would be very informative. To take advantage of the differing discriminatory power of each election, we employ a generalized latent variable model, otherwise known as a two-parameter item response model (Clinton, Jackman, and Rivers Reference Clinton, Simon and Doug2004). We assume there is a single latent propensity to vote underlying all eight observed turnout decisions.Footnote 6 We also assume that both genetic and environmental effects operate through a common pathway (Eaves et al. Reference Eaves, Erkanli, Silberg, Angold, Maes and Foley2005).
The model can be specified as a generalized linear mixed-effects model where subject j is a member of family i choosing to vote (T ijk = 1) or abstain (T ijk = 0) in election k. We assume the probability that an individual will vote in election k (a binary choice) is

where the Ψ function that links the latent tendency to vote to a probability is a logit:
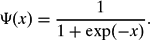
In this model τ is a normally distributed continuous variable that corresponds to the individual's latent propensity to vote, δ is the discriminating power of each election, and α is the threshold identifying the point at which the likelihood of voting is greater than abstaining in each election (also known as the “difficulty parameter” in item-response models). The parameter δ is analogous to loadings in a simple factor model, which allow each election to have a different weight in the underlying tendency to vote (Eaves et al. Reference Eaves, Erkanli, Silberg, Angold, Maes and Foley2005). In order for this model to be identified we fix the total variance of the latent trait (τ) to one.
Next, we assume that the latent tendency to vote is influenced by additive genetic factors, shared environment, and unshared environment. These three factors completely account for the three different kinds of variance that it is possible for us to diagnose in a model of identical twins. We model this assumption using three random effects variables for MZ twins:

where A i is the family genetic factor, C i is the family shared environment factor, and E ij is the individually-experienced unshared environment factor. For DZ twins the tendency to vote is modeled using four random effects variables:

where A 1i is the family genetic factor shared by both twins, A 2ij is the individually-inherited genetic factor that is unique to each twin, and C i and E ij are the same as for MZ twins.
It is important to reiterate that there are no observed covariates in any of the models. In particular, none of the measured environmental variables we examined in Table 1 are included. Everything on the right hand side involves latent variables whose effects are estimated solely from the observed participation decisions. Adding covariates to the right hand side would not affect the variance decomposition because they would merely reduce the magnitude of the most-closely related component. For example, suppose that neighborhood context influences political participation among twins who live apart as adults. If so, we might include a factor in the model like average neighborhood income. If we inserted this variable as an additive factor that directly influences the individual's turnout propensity, it might reduce the magnitude of the unshared environmental variance since it would partially account for some of it. However, we would have to add the variance explained by mean neighborhood income to the unshared environmental variance to estimate its total influence. Thus, in essence, the latent factors indicate the total additive influence of all possible genetic and environmental variables that could be included the model.
Traditionally, the typical approach to estimate the components of variance has been structural equation modeling (SEM), however Bayesian methods are increasingly being viewed as a superior modeling approach (Burton et al. 1999). For our modeling task there are two main advantages to using a Bayesian model. First, discrete phenotypes (like the dichotomous decision to vote or abstain) present computational challenges for SEM software packages because the likelihoods contain high-dimensional integrals that cannot be evaluated in closed form and thus must be evaluated numerically (van den Berg, Beem, and Boomsma Reference van den Berg, Beem and Boomsma2006). As a result, scholars have begun to use Markov Chain Monte Carlo (MCMC) algorithms.Footnote 7 These algorithms evaluate the integrals using random draws rather than evaluating them analytically. In particular, simulation studies suggest that MCMC methods perform better than SEM for models like ours. For example, Kuhnert and Do (Reference Kuhnert and Do2003) show that a Bayesian binary response model identifies the correct model more often than a comparable SEM model in cases where the simulated heritability is low or medium (both performed equally well in cases of high heritability).
Another advantage of the Bayesian approach is that credible intervals for the variance component estimates do not rely on large-sample theory that may not be appropriate for twin studies with small sample sizes (Chen, Manatunga, and Williams Reference Chen, Amita and Christopher1998). In an extensive simulation study, Burton et al. (1999) showed that a Bayesian binary response model based on a relatively small sample of 250 families yielded variance component point estimates and credible intervals that exhibited no significant bias.
Replicating the methods used in this literature, we assume that our unobserved random effects are normally distributedFootnote 8: A ~ N(0,σA2), A 1 ~ N(0,σA2 / 2), A 2 ~ N(0,σA2 / 2), C ~ N(0, σC2), and E ~ N(0,σE2). Notice that the variance of A 1, the family genetic effect for DZ twins, is fixed to be half the variance of A, the family genetic effect for MZ twins, reflecting the fact that DZ twins on average share half as many genes as MZ twins. Moreover, DZ twins are also influenced by individually-specific genes A 2 that are drawn from the same distribution as the shared genes since on average half their genes are shared and half are not. These assumptions about the genetic variance help to distinguish shared genes from the shared environment variable C that is assumed to have the same variance for both MZ and DZ twin families, and the residual unshared environment variable E from which a unique draw is made for each individual.
If we tried to estimate all three components of variance simultaneously the model would not be identified, so we fix the variance of the unshared environment σE2 = 1 and then use the estimates of σA2 and σC2 to derive the proportion of variance generated by each factor. This procedure generates estimates for the influence of heritability h 2 = σA2 / (σA2 + σC2 + σE2), common environment c 2 = σC2 / (σA2 + σC2 + σE2), and the unshared environment e 2 = σE2 / (σA2 + σC2 + σE2). Since the underlying components are not constrained, the estimated proportions can range anywhere between 0 (the component has no effect on variance) and 1 (the component is solely responsible for all observed variance).
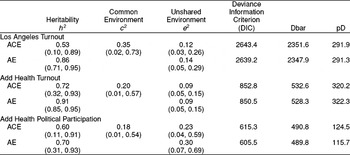
In some cases, the estimate for c 2 will be close to 0, so we can test the hypothesis that the common environment matters by dropping it from the ACE model, creating an AE model (alternatively we could drop A to create a CE model). If the AE model fits better than the ACE model, then it suggests a weak or insignificant role for the common environment. Procedurally, the difference between the ACE and AE model is that the random effect for the common environment is not estimated and σC2 = 0. To compare the fit of ACE and AE models we used the deviance information criterion (DIC), a Bayesian method for model comparison analogous to the Akaike Information Criterion (AIC) in maximum likelihood estimation. Models with smaller DIC are considered to have the best out of sample predictive power (Gelman et al. Reference Gelman, Carlin, Stern and Rubin2004). The DIC penalizes models for deviance (Dbar), which captures model fit, and the effective number of parameters (pD), which captures model complexity.
In our MCMC procedure we use vague prior distributions to ensure they do not drive model results. For μ we use a mean-zero normal distribution with variance 1,000,000 and for the precision parameters associated with σ2A and σ2C we use a pareto distribution with shape parameter equal to 1 and location parameter equal to 0.01.Footnote 9 In addition, we use convergence diagnostics to be sure we have reached the stationary posterior distribution.Footnote 10
How do the assumptions we make in this model compare to assumptions political scientists typically make in their models? Consider a simple logit model of turnout. Like the ACE model presented here, a logit model (1) implicitly assumes that there are independent normal data generating processes that (2) influence a latent variable that is (3) transformed via a logistic function into a probability, which (4) itself is also a latent, unobserved variable. The ACE model is somewhat more complex, but not more so than state-of-the art Bayesian item-response models (Clinton, Jackman, Rivers Reference Clinton, Simon and Doug2004) which also include assumptions about prior distributions and multilevel latent factors.
RESULTS
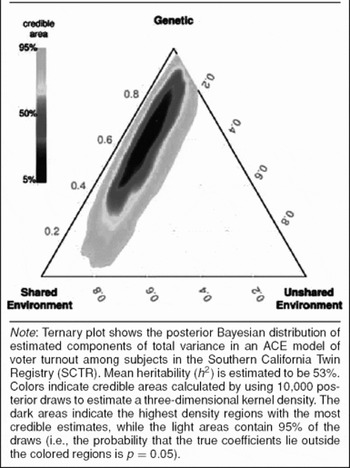
The results of the ACE model suggest that 53% of the variance in turnout behavior can be accounted for by additive genetic effects (h 2). The 95% credible interval (C.I.) for the estimate is (10%, 89%), indicating that we can reject the hypothesis that genes do not contribute to variation in turnout. The ACE model also suggests that the environment is important, with the shared environment (c 2) accounting for about 35% of the variance (C.I. 2%, 73%) and the unshared environment (e 2) accounting for 12% (C.I. 3%, 26%). Figure 2 shows the 95% credible area of the joint estimates. Notice that the contribution of the common environment is close to zero. This suggests that an AE model, where the common environment variable is assumed to be zero, may be more appropriate. Indeed, measures of model fit indicate that an AE model is superior to the ACE model (see Appendix A-1). Although one may be concerned that our analysis lacks power because our sample of 396 subjects is small, multiple observations per individual improve the precision of the estimates, and the credible intervals in the posterior indicate that there is an extremely low probability (p < 0.0001) that voting behavior is not heritable.
Heritability of Voter Turnout in Los Angeles

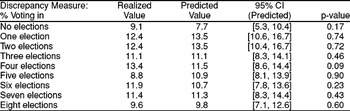
To ensure that our model is consistent with the data, we use it to generate replicated values of the dependent variable from the predictive distribution for each simulated parameter in the model and compare these replicated values with the observed dependent variable (Gelman et al. Reference Gelman, Carlin, Stern and Rubin2004). In order to summarize the discrepancy between the model and data, a relevant measure must first be chosen. Using this measure, a posterior predictive p-value may be calculated to evaluate the fit of the model to the observed data (Gelman et al. Reference Gelman, Carlin, Stern and Rubin2004). Specifically, the predictive p-value is the proportion of the replicated datasets for which the discrepancy measure equals or exceeds its realized value. Large and systematic differences between the replicated and observed data, resulting in p-values close to zero or one, suggest a poor fitting model. In Table A-2 in the Appendix we compare the predicted percentage of individuals voting in zero to eight elections to the actual distribution. None of the discrepancies are statistically significant, indicating reasonable fit for the overall model (Gelman et al. Reference Gelman, Carlin, Stern and Rubin2004).
To test the sensitivity of our method we also employed a traditional structural equation model (SEM) to fit the data, using Mplus to estimate the A, C, and E components of variance in a common factor underlying the individual election turnout variables. The Mplus software provides maximum likelihood estimates in genetic models for observed categorical variables (Prescott Reference Prescott2004). Variance in the common factor was explained primarily by genetic factors (A = 67%; S.E. = 38%), with non-significant effects of shared environment (C = 27%; S.E. = 34%) and non-shared environment (E = 7%; S. E. = 8%). All alternatives (Bayesian and non-Bayesian) suggested that turnout behavior is heritable, with mean h 2 consistently estimated to be greater than 50%. We also explored whether heritability estimates differed by types of elections (primary vs. general, close vs. not close), however the power for our sample was too low to detect any significant difference.Footnote 11
One potential objection to our model is that by including an election-specific fixed effect (the “difficulty” parameter in the model), we automatically remove “institutional variation” from the model (e.g. the procedural differences between primary and general elections which may influence turnout). To determine the extent to which including fixed effects for each election in the model may be artificially deflating the amount of variance to be explained, we also generated results from a model in which the difficulty parameters were removed and turnout was purely a function of the latent propensity to vote and election factor loadings. This robustness check ensures that institutional variation is included in total variance. The results of this model indicate heritability of 51% (C.I. 9%, 89%).
Another potential objection to our model is in fixing the genetic variance in DZ twins to be half the value of MZ twins, which is tantamount to assuming that DZ twins share exactly 50% of their genes—in reality, there is some variance from pair to pair in the amount shared resulting from the small number of recombinations on each chromosome that are possible. The empirical distribution has been estimated to be approximately normal with a mean of 50% and a variance of 0.13% (Visscher et al. Reference Visscher, Medland, Ferreira, Morley, Zhu, Cornes, Montgomery and Martin2006). When we incorporate this distribution in the Bayesian model instead of assuming an exact figure of 50%, the heritability estimate and confidence intervals are nearly identical (53%, C.I. 10%, 89%).
We reiterate that an important assumption of classical twin studies is that MZ and DZ twins share comparable social environments. Therefore, greater similarity of the phenotype in MZ twins compared to DZ twins indicates the degree to which genes influence the phenotype. If this assumption is violated, it is possible that the estimated genetic effect is inflated. In our study, violation of the “equal environments” assumption likely would have produced significant differences between MZ and DZ twins in the distribution of turnout, party affiliation, education, and socioeconomic status. Because the distributions of these variables do not appear to differ for the two types of twins, any possible overestimation of the genetic effect is likely to be small.
Another factor to consider is assortative mating. One assumption of the ACE model is that the distribution of parent genotypes is independent. If political participation is heritable and if people who participate in politics tend to have children with other politically-active individuals, then this will increase the concordance in participatory behavior in their children. However, the effect of this assortment is to increase the degree of concordance in offspring, making it harder to detect differences in MZ and DZ twins. For example, perfect assortment and perfect genetic transmission would yield a concordance of 1.0 for both MZ and DZ twins, and this lack of difference in the concordance would suggest that heritability plays no role. As a result, the more assortative mating there is, the more it biases downward the estimate of heritability. Thus, if the possibility exists that people choose mates based in part on their disposition to participate in politics, then the ACE model estimates will be conservative—heritability will actually be underestimated.
INDEPENDENT REPLICATION IN THE ADD HEALTH STUDY
Given the narrow geographic region of our study, we decided to conduct an independent replication of the results using data from a nationally representative sample.Footnote 12 The National Longitudinal Study of Adolescent Health (Add Health) is a study that, among other topics, explores the causes of health-related behavior of adolescents in grades 7 through 12 and their outcomes in young adulthood.Footnote 13 Three waves of the Add Health study have been completed: Wave I was conducted in 1994-1995, Wave II in 1996, and Wave III in 2001–2002.
In Wave I of the Add Health study, researchers created a genetically informative sample of sibling pairs based on a screening of a sample of 90,118 adolescents. These pairs include all adolescents that were identified as twin pairs, half-siblings, or unrelated siblings raised together. Twins and half biological siblings were sampled with certainty. The Wave I sibling-pairs sample has been found to be similar in demographic composition to the full Add Health sample (Jacobson and Rowe Reference Jacobson and Rowe1998). Nearly 80% of the sibling-pairs sample participants in Wave I also participated in Wave III (Haberstick et al. Reference Haberstick, Lessem, Hopfer, Smolen, Ehringer, Timberlake and Hewitt2005) and the demographic characteristics of the sibling-pairs sample did not change significantly over the course of the three waves (Hopfer et al. Reference Hopfer, Timberlake, Haberstick, Lessem, Ehringer, Smolen and Hewitt2005). The total number of twins who participated in Wave III was 1,082 (442 MZ and 640 DZ), with 806 twins (442 MZ and 364 DZ) in same sex pairs.
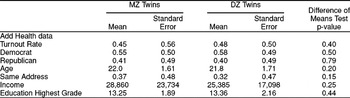
The Add Health data has been used in a wide variety of twin studies (Harris et al. Reference Harris, Halpern, Smolen and Haberstick2006). As a result, there have been several analyses of the comparable environments assumption for MZ and DZ twins. One of these studies claimed to find the environments were not comparable (Horwitz, Videon, and Schmitz Reference Horwitz, Videon and Schmitz2003), but other scholars have pointed to serious deficiencies in this work (Freese and Powell Reference Freese and Brian2003).Footnote 14 In consonance with most studies of the Add Health twin data, we conduct our own assessment of equal environments in Table 3 and find no significant differences in MZ and DZ environments for several socioeconomic and politically relevant variables.
Summary Statistics, by Zygosity, Add Health Sample

Note: These data show that we could find no significant differences in the MZ and DZ twin samples, suggesting that they are drawn from comparable environments.
In Wave III of the Add Health study, respondents provided information about their recent political activity that will permit analysis of both voting and other kinds of participation. This includes one question about voting: “Did you vote in the most recent presidential election?” It also includes five questions about other kinds of political participation: “Which of the following types of organizations have you been involved with in your volunteer or community service work in the last 12 months?” (“political clubs or organizations”) “Which of the following things have you done during the last 12 months?” (“contributed money to a political party or candidate”; “contacted a government official regarding political or community issues”; “run for a public office”; “run for a non-public office”; “attended a political rally or march”). Due to low incidence, we pooled the two “run for office” questions to create a variable indicating whether the subject ran for any office, public or nonpublic. We performed a factor analysis of these five variables that suggested they all relate to an underlying tendency to participate in politics. A Cronbach test of internal consistency (α = 0.61) reveals that it is reasonable to include these variables in a model in which a single scalar latent value for participation is being estimated (see Verba, Schlozman, and Brady Reference Verba, Schlozman and Brady1995, who report a similar α for a scale of participation that includes these items).
It is important to note that there are several differences between the Los Angeles sample and the Add Health sample. First, Add Health is nationally representative, suggesting that the results are more likely to generalize to the population outside Los Angeles. Second, Add Health includes subjects who were eligible but not registered to vote. This is important because the act of registration itself may be an important part of the decision to vote. Third, Add Health relies on self-reported turnout instead of official records meaning it is more susceptible to overreporting than the Los Angeles sample. Fourth, Add Health is restricted to young adults in their late teens and twenties (all eligible to vote)—thus, while it increases generalizability with respect to geography, socioeconomic composition, and local political conditions, it decreases generalizability with respect to age. Finally, Add Health includes data on turnout for just a single election compared to eight in the Los Angeles data. As a result, the greater efficiency of a larger sample may be partially offset by fewer observations per individual.
There are also some small differences in the modeling of the Add Health data. The Add Health voting model is based on a single election, k = {1}, therefore subject j is a member of family i choosing to vote (T ij = 1) or abstain (T ij = 0) in the election. As in the Los Angeles voting model, the observed phenotypes are dichotomous variables and we assume τ is a continuous variable that maps to the individual's latent propensity to vote via a logit function. In fact, the only difference is that we restrict δ1 = 1 to identify the model since there is only a single election for subjects in the Add Health data.
The only difference between the Add Health model of political participation and the Los Angeles voting model is that the dichotomous outcome variables in the former indicate whether subjects participated in various acts of participation rather than whether or not they voted in various elections. The latent tendency to participate in political activities in the Add Health sample is modeled in the same manner as the latent tendency to vote in the Los Angeles sample.
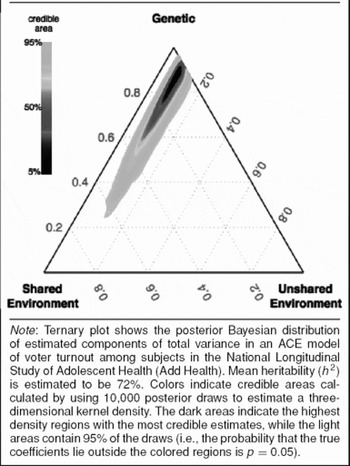
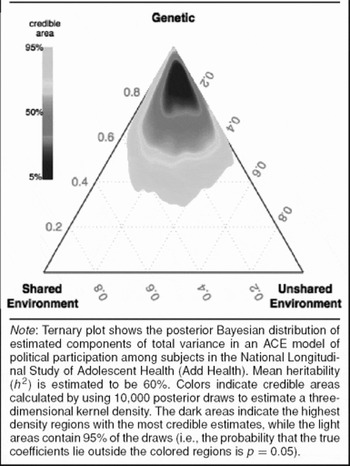
The results of both replications using the Add Health study show that participatory behavior is heritable. Figure 3 shows that about 72% of the variance in turnout behavior can be attributed to genes (95% C.I. 32%, 93%). The shared environment accounts for 20% of the variance (95% C.I. 1%, 57%), but an AE model without common environment actually fits the data better than the ACE model (see Appendix). Figure 4 shows that genetic effects account for 60% (C.I. 11%, 91%) of the variance in political participation with the shared environment having little effect (18%, C.I. 1%, 54%). Once again, an AE model without shared environment fits better, suggesting that most variance can be attributed to genetic and unshared environmental factors. In summary, both Add Health replications yield estimates of heritability that are similar in magnitude to the 53% estimate for heritability in the Los Angeles sample, suggesting the heritability of political participation is robust.Footnote 15
Heritability of Voter Turnout in Add Health

Heritability of Political Participation in Add Health

It is important not to confuse these estimates with those from other models in the turnout literature. They are not comparable. For example, we referred to another study (Plutzer Reference Plutzer2002) earlier in which environmental factors account for only 31% of the variance in turnout, but many of the variables in that model might well include genetic effects (for example, parental turnout might in part be a proxy for genetic association). It is also possible that there are as-yet undiscovered or unmeasured environmental factors that will improve the fit of that model.
Nor can we state with certainty that genetic effects are somehow more important than environmental effects. Although we estimate that genetic variation accounts for more than 50% of the variance in participation in all three tests, these estimates are based on a simple additive genetic model that undoubtedly masks richer and more complex gene-environment interactions. We therefore strongly discourage readers from perceiving these results as a horse race between genes and environment. In fact, our results suggest that both genes and environment matter, and our job now is to look closer at both to understand better how nature and nurture work together to create the political phenomena we observe in the world.
DISCUSSION
The fact that we have found that genetic variation in voting, and political participation in general, should not be surprising given the large number of behaviors that have already been found to be heritable (Bouchard and McGue Reference Bouchard and McGue2003; Turkheimer Reference Turkheimer1998). However, our goal is not simply to show that political behavior can be added to this long list of behaviors. Instead, we suggest that our findings are the first step in a research agenda with the goal of uncovering biological sources of participatory behavior, a finding that would have important implications for political science in general and studies of voting behavior in particular.
Political scientists have typically not focused on the role of genetic and biological factors in political behavior (Alford, Funk, and Hibbing Reference Alford, Funk and Hibbing2005), which has potentially biased our interpretations of several important phenomena. For example, if political participation is heritable, it would help to explain why models based primarily on environmental variables fit poorly to observed behavior (Matsusaka and Palda Reference Matsusaka and Palda1999). It would also conform to two well-known features of voting. First, parental turnout behavior has been shown to be one of the strongest predictors of turnout behavior in young adults (Plutzer Reference Plutzer2002). Although this has previously been interpreted as the result of social influence, the findings here suggest it may be mostly due to heritability since the shared environment appears to play only a small (if any) role. Second, turnout behavior has been shown to be habitual—the majority of people either always vote or always abstain (Fowler Reference Fowler2006b; Gerber, Green, and Shachar Reference Gerber, Green and Shachar2003; Green and Shachar Reference Green and Shachar2000; Miller and Shanks Reference Miller and Shanks1996; Plutzer Reference Plutzer2002; Verba and Nie Reference Verba and Nie1972). Scholars previously interpreted this as the result of reinforcement learning, but given the small effect of environmental variation it might also be largely due to inherent genetic variability.
While the results here suggest a significant role for genes, they are completely silent on the specific mechanism that links genes to participation. Therefore, the next step in this line of research must move beyond estimates of heritability and attempt to identify why genes matter so much. There are many possible mechanisms one could imagine, but here we speculate on a few.
The theoretical literature on voting has centered on rational, self-interested models (Aldrich Reference Aldrich1993; Downs Reference Downs1957; Riker and Ordeshook Reference Riker and Ordeshook1968) that have great difficulty explaining high turnout in large populations. One popular extension to these models is to assume that some individuals experience an extra benefit from voting (the “D” term as Riker and Ordeshook called it) that has nothing to do with the outcome. Instead, this benefit comes from the satisfaction of fulfilling a civic duty or of contributing to the democratic process. In other words, these models posit that there is inherent heterogeneity in the desire to vote. While many scholars believe this argument is plausible (notably Aldrich (Reference Aldrich1993, p. 266) argues “most of the action is probably in the intrinsic values of voting per se”), not a single one has suggested that this heterogeneity may have genetic origins. Thus, our results suggest that a fruitful avenue for future research is to study whether or not variation in feelings of civic duty intermediate the relationship between genes and political participation.
A more recent extension to the rational model posits that voters get utility for behaving “ethically” as a way of coordinating high participation equilibria between competing groups (Sandroni and Feddersen Reference Feddersen and Sandroni2006). This argument is also plausible, but since it is based on equilibrium analysis, it is agnostic about the origin of the preference for ethical behavior. The evidence here suggests that genetics may play a role. The ethical voting model works equally well in small groups and large populations, so it is possible that the ethical mechanisms underlying equilibrium evolved genetically in small-scale settings in early human societies and then continued to have an influence as humans became involved in the larger-scale behavior of recent history.
Another possibility is that variation in voting and participation are related to variation in prosocial behavior. A wide range of studies have already shown a strong genetic basis for prosocial personality and behavior (McGue, Bacon, and Lykken Reference McGue, Bacon and Lykken1993; Rushton et al. Reference Rushton, Fulker, Neale, Nias and Eysenck1986; Scourfield et al. Reference Scourfield, John, Martin and McGuffin2004; Cesarini et al. Reference Cesarini, Christopher, James, Magnus, Paul and Björn2008). This literature suggests that innate dispositions play a significant role in an individual's willingness to participate in social activities or to engage in acts that primarily benefit others. Meanwhile, observational studies (Edlin, Gelman, and Kaplan Reference Edlin, Andrew and Noah2007; Jankowski Reference Jankowski2002; Jankowski Reference Jankowski2007) and laboratory experiments (Fowler Reference Fowler2006a; Fowler and Kam Reference Fowler and Cindy2007) suggest that prosocial attitudes and behavior are important factors for explaining voter turnout and political participation. Thus, genes may influence voting and political participation because they influence a generalized tendency to engage in social behavior.
The frontier before us is vast. Future work should explore the interaction effects of genes and environment on participation. These studies will help us to learn what the causal mechanisms are that link genes which have taken millions of years to evolve to large-scale political behavior which is an extremely recent phenomenon on the scale of human evolution. Evidence of political behavior in chimpanzees (de Waal Reference de Waal1998 [1982]), capuchins (Brosnan, Freeman, and de Waal Reference Brosnan, Cassiopeia and Frans2006), and early human societies (Boehm Reference Boehm1999) suggests that it may have, in part, adapted genetically to small-scale interactions, but it is an open question whether or not these small-scale adaptations influence large-scale political participation. The obvious place to start is with factors for participation that have already been identified like cognition and efficacy, which also have a genetic basis (McGue and Bouchard Reference McGue and Bouchard1998). It is also possible that genes influence political participation via their effect on personality traits that have not yet been linked to it, like their effect on assertiveness or competitiveness. Thus an important area of research will study the extent to which the link between genes and participation can be explained by genetic variation in inherent personality attributes.
Future research should also begin the work of identifying genes that are implicated in political behavior. It is extremely unlikely that such efforts will uncover a “voting gene”, however, the results presented here suggest that there is some (possibly large) set of genes whose expression—in combination with environmental factors—regulates political participation. Finding out which genes they are and what physical function they have will improve our understanding of the biological processes that underlie these complex social behaviors and may also shed light on their evolutionary origin (Fitzpatrick et al. Reference Fitzpatrick, Ben-Shahar, Smid, Vet, Robinson and Sokolowski2005).
Finally, we offer a note of caution. Heritability studies have shown that genes account for some of the variance in a very large set of human behavior, including activities like television watching that are extremely recent in human history and not (yet) relevant to genetic evolution. In particular, Turkheimer (Reference Turkheimer1998) argues that these results have been well known in other disciplines for a very long time, but expectations that they would lead to the discovery of specific “deeper” biological explanations of human behavior have largely been disappointed. There are simply too many genes and too many causal steps between genes and behavior to expect that genetic analysis will ever lead to improved understanding. Moreover, high heritability for a phenotype does not guarantee that it will be possible to identify specific genes that contribute to it. For example, in cancer genetics the least heritable cancers have been the most amenable to molecular genetic analysis, because they are rare and caused by single genes of large effect. Highly heritable cancers are more common and highly polygenic and it is therefore harder to identify genes for them (Risch Reference Risch2001).Footnote 16
However, the recent revolution in genotyping presents possibilities that were not available to behavior geneticists when they first uncovered evidence of the heritability of complex social behaviors. Scholars have already begun discovering specific genes associated with political behavior, which may be the first few pieces in the puzzle to understanding the biology that underlies it. For example, two studies (Fowler and Dawes Reference Fowler and Dawes2008; Dawes and Fowler Reference Dawes and James2008) recently identified variants of three genes that are positively correlated with voter turnout. The genes they studied are known to influence social behavior via the dopaminergic and serotonergic systems, suggesting that voting may, in fact, be a prosocial act. Moreover, the association between one of these genes and turnout appears to be mediated by partisanship (Dawes and Fowler Reference Dawes and James2008). Thus, the realization that participation is heritable has already helped to generate additional evidence that may be applied to existing theories of turnout, partisanship, and prosocial behavior, and it also yielded new theories about the effect of the serotonin and dopamine system on participation. Therefore, although it may not surprise behavior geneticists that participation is heritable, it seems premature to argue that heritability studies will not bear fruit in political science. These studies provide the first step needed to excite the imaginations of a discipline not used to thinking about the role of biology in human behavior.
APPENDIX
Summary of Model Results

Note: These results show that we consistently found that a large proportion of variance in turnout and political participation behavior is due to heritability and that the best fitting models are those that assume a role for heritability and the unshared environment (but not the common environment). The first column describes each model. ACE models estimate a parameter for genetic (A), common environment (C), and unshared environment (E); AE models assume the common environment has no effect. Columns 2, 3, and 4 show the mean estimated proportion of total variance attributable to heritability (h 2), common environment (c 2), and unshared environment (e 2), with 95% credible intervals indicated in parentheses below each estimate. Model fit is assessed using the deviance information criterion (DIC), which penalizes models for deviance (Dbar), capturing model fit, and the effective number of parameters (pD), capturing model complexity. The results show that the AE model generates the best fit for all three samples. The empirical means, 95% credible intervals, and DICs reported for the Los Angeles voting models are based on 10,000 draws from the posterior distribution.
Posterior Predictive Checks




Comments
No Comments have been published for this article.