INTRODUCTION
Soybean–wheat is the predominant crop rotation of vertisols and associated vertisols of the Vindhyan Plateau and Central and Western parts of India. At present, in India the area under soybean (July–October) is around 0.89 million hectares. The experience of the farmers supported by research convinced the farmers that soybean leaves a significant amount of biologically fixed N in soils, which has beneficial effect on the growth of subsequent crop (Singh et al., Reference Singh, Singh and Kumrawat2008). Therefore, it is necessary to quantify N2 fixed by the soybean and the amount of N left over in soil to be utilised by wheat so that appropriate adjustment can be made in recommendation of N to the following wheat crop. The correct estimates of N added to soil by soybean will not only save the N fertiliser applied to wheat but will also help in ensuring food security by diverting the saved N to other crops.
To calculate the N2 fixation by a legume crop, several techniques have been used such as C2H2 reduction, ureide method (Herridge and Holland, Reference Herridge, Holland, Bacon, Evans, Storrier and Taylor1987), 15N dilution (Gao et al., Reference Gao, Wang, Hao, Zhang, Zhao, Zhang, Wang and Xue1987; Guffy et al., Reference Guffy, Heuvel, Vassilas, Neison, Frobish and Hesketh1989; Rennie, Reference Rennie1984) and N balance studies (Bezdicek et al., Reference Bezdicek, Evans, Adebe and Wittern1978; Eaglesham et al., Reference Eaglesham, Ayanaba, Rao and Eskew1982; George et al., Reference George, Singleton and Bohlool1988). The subject has been intensively reviewed by Peoples et al. (Reference Peoples, Faizah, Rerkasem and Herridge1989) and Singh et al. (Reference Singh, Kundu, Biswas, Saha, Tripathi and Acharya2004). The nitrogen balance is defined as the difference between measurable outputs of N (N in the exported parts of the plant, the residual N in the soil and losses of N), whereas input of N includes N applied through fertiliser, manure, rainwater and derived from soil at the end of the experiment. Precise gain and loss of N in soil at the end of the experiment are the components for accuracy of N2 fixation (Roger and Ladha, Reference Roger and Ladha1992). The amount of N2 fixed by a soybean crop is influenced by a number of factors, including varieties, soil type, climatic condition and management practices (Hardarson et al., Reference Hardarson, Golbs and Danso1989). Our earlier study based on 15N dilution as well as N balance technique (Kundu et al., Reference Kundu, Singh, Tripathi, Manna and Takkar1996, Reference Kundu, Barman, Singh, Manna and Takkar1998; Singh et al., Reference Singh, Kundu, Biswas, Saha, Tripathi and Acharya2004, Reference Singh, Singh and Kumrawat2008) proved that N2 fixation is influenced by dung manure and other nutrients such as P and S. Therefore, to correct N recommendation for subsequent crop, there is a need for realistic estimates of N2 fixation under different management conditions.
Long-term experiments are conducted with the aim of monitoring the impact of different nutrient management practices on soil fertility status and sustainability. Nitrogen status is one of the key parameters to assess the fertility status of soil. Correct estimates of N2 fixation by soybean will not only help in assessing the amount of N added to soil but will also help in assessing the fertility status of soil in developing the strategies for sustainable production. Therefore, the objectives of this study were to assess the yield response to applied N, P, K, S and Zn, to estimate N2 fixation by soybean and biologically fixed N added to soil under different nutrient management options in a 33-year-old soybean–wheat–maize (fodder) rotation on a vertisol.
MATERIALS AND METHODS
Soils and soil characteristics
A long-term fertiliser experiment with soybean–wheat–maize (fodder) rotation was initiated in June 1972 on a deep Typic Haplustert (clay 55%; silt 18% and sand 27%) of Madhya Pradesh, India.
The initial soil properties were as follows: pH, 7.8; EC (dS m−1), 0.8; CaCO3 (%), 2.6; organic carbon (g kg−1), 5.7; total N (0–15-cm depth; in mg kg−1), 845; Olsen P (mg kg−1), 7.6; ammonium acetate extractable K (mg kg−1), 370; CaCl2 extractable S (mg kg−1), 16 and DTPA extractable Zn (mg kg−1), 1.33. The experimental site (22°49′ & 24°8′ N and 78°21′ & 80°58′ E at 415 m above sea level) is located at the research farm of Jawaharlal Nehru Krishi Vishwa Vidyalaya (JNKVV), Jabalpur with hot sub-humid monsoon-type climate. Average rainfall is 1200 mm, of which 70–75% occurs during June to October with southwest monsoon and the remaining occurs during the winter season. Maximum mean temperature at the site is 31 °C, while minimum mean temperature is 18 °C. During winter, minimum temperature falls to as low as 5 °C (December to January), while during summer the temperature rises to 40–45 °C (mid-June). Soybean was grown as a rain-fed crop (late June to early October), wheat was grown from November to mid-April and maize (fodder) was grown during April to June under irrigated conditions.
Statistical analysis
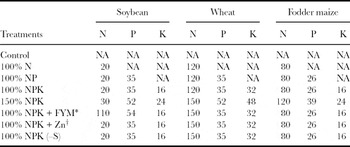
The experiment was designed and conducted with eight treatments with four replications arranged in randomised block design. Two blocks were separated with a gap of 2 m, whereas individual plots (18 m × 11.8 m) were separated with a permanent bund. The treatment details and quantity of nutrients added are given in Table 1.
Details of treatment and nutrient rates (kg ha−1) in soybean, wheat and fodder maize.

*FYM was applied 15 t ha−1 to soybean every year 15–20 days before sowing; † Zn was applied @ 5 kg Zn ha−1 in alternate years and stopped whenever concentration exceeded 2 ppm DTPA extractable Zn; NA: not applied.
Experimental details
In treatment NPK (–S), phosphorus was applied through dia-ammonium phosphate (DAP) instead of single super phosphate (SSP). Fodder crop maize was grown in the crop rotation for 23 years continuously and discontinued during 1996. Therefore, annual average N input was 195 kg ha−1 (total N applied 6460/33 = 195 kg ha−1). During rainy season, all the nutrients, viz. N, P and K were applied as basal before last harrowing, whereas in wheat and maize, half of the nitrogen was applied at the time of sowing and the remaining half was applied 21–25 days after sowing (after the first irrigation).
After each crop cycle, soil samples were collected (0.0–0.15-m depth) and analysed for nutrient status, pH, EC and soil organic carbon (Walkley and Black, Reference Walkley and Black1934). Each year, plant biomass and grain yields were determined for each plot. Grain and straw samples of soybean, wheat and fodder of maize were analysed for nitrogen uptake by exported biomass in each crop by the Kjeldhal method after pre-digestion with H2O2 followed by sulphuric acid (Piper, Reference Piper1966)
After the completion of 33 crop cycles, profile soil samples (0–15 and 15–40 cm) were collected from each plot and analysed for total soil N (Bremner and Mulvaney, Reference Bremner and Mulvaney1982). To separate the component of fixed N2 annually left in soil, treatment-wise % Ndfa value was worked out. To quantify % Ndfa in soybean, we used the following equation based on N input–output balance, including the change in total soil N (▲ TSN) in the 0–40-cm soil depth (Singh et al., Reference Singh, Kundu, Biswas, Saha, Tripathi and Acharya2004) since the initiation of the experiment:

where (in kg N ha−1 yr−1)
HBNs = harvestable biomass N (grain + straw) of soybean,
HBNw = harvestable biomass N of wheat,
RBNs = residual biomass N of soybean,
HBNm= residual biomass N of maize (fodder),
EN = external N applied through fertiliser and farmyard manure (FYM), and precipitation,
NSN = contribution of non-symbiotic N,
GLn = gaseous loss of N (as NH3, NOx3 and N2O) from applied fertiliser and FYM,
LLn = leaching loss of N,
▲TSN (kg N ha−1) = Change in total soil N.
When the difference in total soil N between the final sampling and the initial sampling is negative, it is depletion, and when the difference is positive, it indicates increase in total soil N, i.e. N added to the soil.
For estimating residual biomass N, we used average harvestable biomass/leaf fall ratio of 5.3:1, harvestable biomass/root biomass ratio of 3.2:1 and root biomass/nodule biomass ratio of 7.6:1 as observed in our earlier study, which was conducted for seven years under similar climatic conditions (Kundu et al., Reference Kundu, Singh, Tripathi, Manna and Takkar1997). Rhizodeposition of N from root exudates was calculated using the values from literature (Shamoot, Reference Shamoot, McDonald and Bartholomew1968). Shamoot (Reference Shamoot, McDonald and Bartholomew1968) observed that rhizodeposition of C from root turnover and exudates represented 5–20% of the aboveground biomass in 11 plant species. We considered the middle value (12.5%) of this range as the contribution of C from soybean through rhizodeposition with C/N ratio of 12. The N content in rainwater in this region was quite variable (0.515 ± 0.175 mg L−1). Based on average rainfall during the 33-year period, 7.5 kg ha−1 yr−1 was estimated to be the N input through annual precipitation.
We assumed zero value for the contribution of N input (NSn) from diazotrophic bacteria in this experiment, as the role of native diazotrophs in soil as a source of N has remained a controversial issue (Michiels et al., Reference Michiels, Vanderleyden and Gool1989) due to limitations in its measurement. To account for the gaseous loss (GLn) of N from fertiliser and FYM, default emission factor of 0.1 kg (NOx)–N emitted per kg of fertiliser N and 0.2 kg (NH3 + NOx)–N emitted per kg of FYM–N, as recommended by Intergovernmental Panel on Climate Change (IPCC, 1997), were used. To account for the denitrification loss of N as N2 and N2O emission, we used the following Bouwman's equation (Equation 2; Bouwman, Reference Bouwman1996):

where Nem is the N2O emission and Na is the total amount of N added annually to soil through fertiliser. The value of Nem was multiplied by 0.636 to get the value of N2O–N loss from each treatment. The probability of leaching loss of NH4+–N and NO3–N is expected to be very low, as conductivity of soil is very poor (0.006 m day−1). If any amount of NH4+–N and NO3–N is moved down in the profile, it would be trapped by the subsequent wheat crop having root up to 2.5 m. To account for volatilisation losses of N, we used 15% of total N applied from our study (Singh et. al., Reference Singh, Kundu, Tripathi and Takkar1996), which was estimated from the laboratory and field through the dynamic air circulation method.
In spite of bunded plots, two–three showers of high intensity were experienced every year and outflow of water was inevitable. To measure the loss of N in runoff (SRL), a plastic pipe of 100-mm diameter channeled water to big plastic container embedded in soil at one corner of the plot. After each heavy rainfall, total volume of water was measured and a sample of water was drawn for the estimation of N.
RESULTS AND DISCUSSION
Productivity and response of nutrients
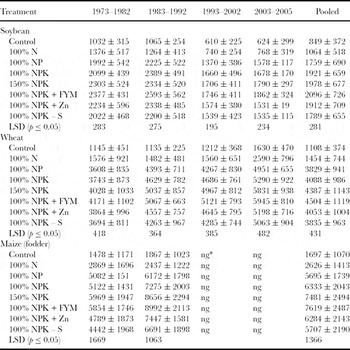
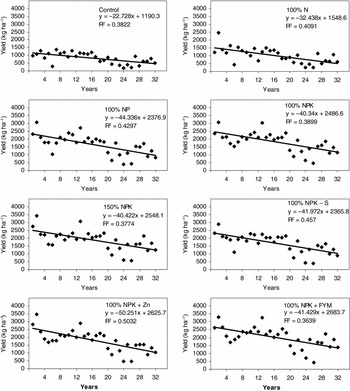
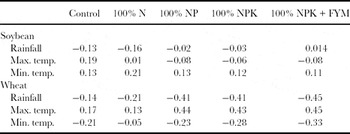
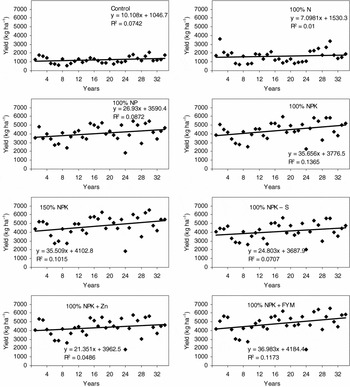
Soybean: The average annual yield of soybean seed varied from 849 to 2096 kg ha−1, wheat from 1108 to 4504 kg ha−1 and fodder maize from 1697 to 7619 kg ha−1 (Table 2). The coefficient of variation considering all the years together for seed yield of soybean ranged from 34 to 49%, wheat from 16 to 33% and fodder maize from 33 to 59%. The large yield variation in soybean is due to the amount and distribution pattern of rainfall and that of maize is due to variation in availability of water and high temperature during May–June, since the temperature rises to as high as 45 °C and water become an essential input for the growth of crop. The lower variability in wheat yield than other crops over the years is due to uniform availability of water, as wheat is grown under irrigated conditions. We observed significant response to applied N (Table 2) only during first few years (1973–1982) and later on soybean did not response to applied N. Response of soybean during first few year is probably due to less number of cells of N-fixing rhizobia and N requirement in the initial stages of growth before nodule formation. Continuous growing of soybean might have resulted in rhizobia population built up, and N added by soybean fulfills the initial N requirement of soybean. Contrary to N, soybean also responded to applied P during the whole experimental period, but response to K, noted after the 20th year, which was also not statistically significant, might be due to less demand of K because of decline in productivity of soybean and high status of soil K. On the other hand, soybean did not show any response to applied Zn because of high concentration of soil-available Zn (1.3 mg kg−1). Similar to N, soybean responded to applied FYM in the first decade and thereafter subsided because of organic carbon built up in soil. Soybean–wheat is a carbon sequestering system and application of FYM further enhances carbon sequestration (Kundu et al., Reference Kundu, Prakash, Ghosh, Singh and Srivastava2002). Under all the nutrient management options a decline in soybean productivity was observed (Figure 1). Analysis of rainfall data over the years indicates frequent delays in the onset of monsoons, which delayed sowing the crop, and in many years long dry spells during critical growth stages are responsible for decline in soybean yield. The relationship (Table 3) of average monthly weather parameters (rainfall, and minimum and maximum temperature) of 33 years with yields of soybean showed negative relationship with rainfall and maximum temperature, which indicates that rainfall is also responsible for decline in yields of soybean, though the relationship is not statistically significant. Insect attack in later years is another cause of reduction in yields. Critical analysis of the yield data indicates that in spite of the absence of S in fertiliser schedule, soybean till date did not show any significant reduction in seed yield of soybean in 100% NPK – S (DAP used to supply P) treatment compared with 100% NPK.
Long-term effect of fertiliser and manure application on mean grain yield (10 years average) of soybean (kg ha−1), wheat (kg ha−1) and fodder maize (kg ha−1) grown on a vertisol.

*ng: not grown.
Yield trends of soybean over a period of 33 years in LTF, Jabalpur, Madhya Pradesh, India.

Relationship of yield of soybean and wheat with weather parameter (rainfall, and minimum and maximum temperature).

Wheat: Average annual wheat grain yield ranged from 1108 kg ha−1 in control to 4504 kg ha−1 in NPK + FYM treatment (Table 2). Like soybean, wheat also responded to applied N in the beginning years and response of wheat to applied N declined to a nonsignificant level. Decline in response of wheat during later years seems to be due to reduction in availability of soil P because of continuous absence of P in fertiliser schedule. Continuous increase in response of wheat to applied P in other treatments supports the hypothesis. Unlike N and P, wheat did not respond to applied K during the first period of 10 years. However, after 10 years wheat started responding to applied K but it was statistically nonsignificant. Thus, yield data indicate that in near future K will be the limiting nutrient. These soils are very high in K status, so did not respond to applied K during initial years. Response of wheat to K during later years is due to decline in the availability of K from 370 to 266 mg kg−1. The magnitude of response of wheat was the highest to P followed by N and K as individual elements. The larger response of wheat to applied P is obviously due to low soil-available P. Unlike soybean, improvement in productivity of wheat was recorded with time in all the treatments (Figure 2). Increase in the yield of wheat with time under all the nutrient management options, including control (no fertiliser and no manure), seems to be due to long-term benefit from the soybean crop to wheat and other related factor like increase in organic carbon in soil with time. In addition to this, negative correlation with minimum temperature and positive correlation with maximum temperature are contributing to wheat yields in all treatments. Reduction in minimum and maximum temperatures with time probably increases growth period, which resulted in increase in yields. Increase in wheat yield on application of 150% NPK and 100% NPK + FYM compared with 100% NPK suggests that to harness the potential yield of wheat nutrients are needed in larger quantity than applied as 100% NPK. In situations where sub-optimal amounts of nutrient are used, the yield of wheat can be improved by the inclusion of any remaining fixed N in the residues of a preceding soybean crop. The increase in wheat yield grown after soybean with time has been reported by Kundu et al. (Reference Kundu, Ranjan, Prakash, Gupta, Pathak and Ladha2007).
Yield trends of wheat over a period of 33 years in LTF, Jabalpur, Madhya Pradesh, India.

Maize: Fodder maize was grown as a third crop in the cropping sequence for the first 23 years of the experiment. The fodder yield indicated response of maize to applied N, P and K. Among the three nutrients, N, P and K, maize responded the highest to applied P. Application of P resulted increase in fodder yield from 2626 to 5695 kg ha−1 (216.9%), N from 1697 to 2626 kg ha−1 (154.6%) and K from 5995 to 6333 kg ha−1 (105%)(Table 2). From the beginning of the experiment the three crops responded significantly to applied P. Therefore, P is the key nutrient governing the productivity of these soils. The larger response to applied P is obviously due to low initial status of P in soil. Till discontinuation, maize did not show response to applied Zn. Thus, regular application of N, P and K is required along with FYM to sustain maize productivity over the years.
Change in total soil N content (▲TSN)
Cumulative gain or loss after 33 years in total soil N content (▲TSN) at 0–40-cm depth (0–15 and 15–40 cm) ranged from 5.3 to 95.1 kg ha−1 (Table 4). The largest increase in ▲TSN was recorded in the 150% NPK treatment and the minimum increase in ▲TSN was noted in the control. Less increase in ▲TSN compared with annual addition of biologically fixed N by soybean is due to regular utilisation of biologically fixed N added to soil by subsequent wheat/maize crops. Increase in wheat yield with time in all treatments, including control plot, seems to be due to increase in ▲TSN, which enhanced response of P.
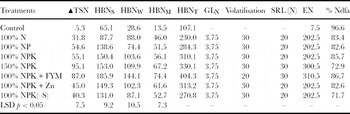
Parameter values to estimate percentage N derived from atmosphere (% Ndfa) as influenced by different nutrient management practices in soybean–wheat system on a vertisol.

FYM: farmyard manure, SRL: surface runoff loss nitrogen.
Residual biomass N of soybean (RBNS)
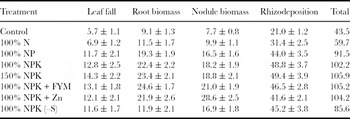
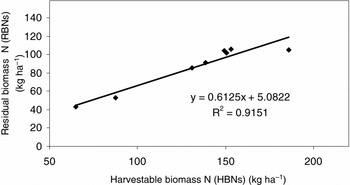
Soybean, being a leguminous crop, invariably adds considerable amount of N to soil through residual biomass comprising leaf fall, root, nodule and rhizodeposition. A major portion of N added through RBNS is derived from atmosphere, which contributes N to soil. The addition of nitrogen to soil through different components of soybean, i.e. leaf fall, root biomass, nodule biomass and rhizodeposition ranged from 5.7 to 14.2 kg ha−1, 9.1 to 24. 6 kg ha−1, 7.7 to 21.0 kg ha−1 and 21.0 to 49.4 kg ha−1, respectively (Table 5). Amount of N added through RBNs in our study is little less than the estimate of N addition through leaf fall and root biomass made by Bergersen et al. (Reference Bergersen, Brockwell, Gault, Morthrope, Peoples and Turner1989), Buresh and De Datta (Reference Buresh and De Datta1991) and Chapman and Myers (Reference Chapman and Myers1987). They reported that leaf fall and root biomass together add up to 40 kg N. In our previous study we quantified the amount of N added through leaf fall and root biomass; the values were in the range of 7 to 16.9 kg ha−1and 11.7 to 20.9 kg ha−1, respectively. The amount of N added through leaf fall and root biomass seemed to be lower than their estimates, possibly because of the lower yield potential (2.0 to 2.5 t ha−1) of our cultivars compared with the yield potential (4.0 t ha −1) of their cultivars. The linear relationship between RBNs and HBNs supports the findings shown in Figure 3.
Average N content (kg ha−1 yr−1) added to soil through residual biomass of soybean crop (mean ± SD, n = 4) under different fertiliser nutrient treatments.

Relationship between harvestable biomass N (HBNs) and residual biomass N (RBNs) in soybean.

Total RBNS added through all the biomass components of soybean that remained in soil ranged from 43. 5 (control) to 105.8 kg ha−1 in NPK + FYM treatment and has a direct relationship with yield. A simple linear relationship (Y = 0.612x + 5.088, R2 = 0.915, n = 8) between RBNS and harvestable biomass nitrogen of soybean was observed. The relationship indicates that for each 100-kg assimilated N by harvestable biomass, soybean adds nearly 60-kg N through residual biomass of soybean, which means that little more than the equivalent of the half of harvestable biomass N is returned to the soil. Of course, this N also consists of the N derived by soybean from the soil.
Biological N2 fixation by soybean and N addition to soil
In our study, N fixed in harvestable biomass of soybean ranged from 62.8 to 161.1 kg ha−1 annually (Table 6). The application of N, NP and NPK increased harvestable biomass-fixed N. The highest increase in fixed N was on application of P. However, increase in the amount of NPK from 100 to 150% resulted in decline in harvestable biomass N, although incorporation of FYM along with NPK increased the harvestable biomass. Absence of S in fertiliser schedule also had a negative impact on harvestable biomass N of the soybean. The lower contribution of fixed N to soil through RBNS in the absence of P (100% N) was due to poor growth of soybean, which is due to poor development of roots and root nodules, compared with 100% NPK. However, less contribution of N to soil in absence of S (100% NPK – S) seems to be due to larger removal of soil N as a result of poor root development (Table 5).
Mean annual input–output of N (kg ha−1) in soil due to soybean and fixed N accredited to soil by soybean under different nutrient management.

A: difference between total soil N at the initial and at the harvest of 33rd crop of soybean; B: % Ndfa (Table 4); D: % Ndfa of each treatment and total N added to soil through residue of soybean (e.g. in control total N added through residual biomass is 43.48 × 0.966 % Ndfa = 42.0).
The literature reviewed by Salvagiotti et al. (Reference Salvagiotti, Cassman, Specht, Walters, Weiss and Dobermann2008) clearly indicated that application of N decreased the N2 fixation by soybean and concluded that application of N at the beginning as a starter dose increased N2 fixation. On the basis of data of more than 500 studies, they observed that N2 fixation ranged from 337 to 0 kg ha−1 with a mean value of 111 kg ha−1. Our result also falls within the N2 fixation range observed by them. Increase in N2 fixation on application of FYM may be due to improvement in soil condition conducive to root growth and nodule formation.
Annual N removal by harvested biomass of crop
The average N removed by soybean, wheat and maize (Table 6) showed variable amount of N depending upon productivity in a particular treatment. The annual harvested biomass nitrogen of soybean (HBNs), wheat (HBNw) and maize (HBNM) ranged from 65.1 to 185.9 kg ha−1, 28.6 to 144 kg ha−1 and 13.5 to 94.4 kg ha−1, respectively. For each 100-kg seed + harvested straw of soybean was found to assimilate 8.2 to 9.0 kg N, and that of wheat (seed + straw), 2.3 to 2.9 kg N. On the other hand, each 100-kg fodder maize crop assimilated 0.79 to 1.23 kg N. The N assimilation rate was dependent on the productivity level of the crop. The balanced application of nutrient resulted in higher assimilation rate of N. The assimilation rates observed in our study are in similar range as reported in Indian context (Singh et al., Reference Singh, Kundu, Biswas, Saha, Tripathi and Acharya2004) but little less has been reported elsewhere (Sinclair and de Wit, Reference Sinclair and de Wit1975).
Effect of fertiliser and manure on % Ndfa
The results (Table 4) showed that % Ndfa is influenced by nutrient management and ranged from 71.7 to 96.6%. The highest % Ndfa value was observed in the control treatment, and nutrient applications resulted in decline in % Ndfa compared with the control because of the applied N. However, incorporation of FYM resulted in higher % Ndfa than 100% N, 100% NP or 100% NPK. Application of nutrient in larger quantity and absence of S continuously for 33 years also resulted in decline in % Ndfa. The lower % Ndfa in the absence of S is probably due to reduction in crop productivity, whereas reduction in % Ndfa in 150% NPK treatment than the control is due to the application of large amount of N, which reduces the activity of N2 fixers. The % Ndfa values observed in the present study are within the range reported in the literature, from 0 to 98% in the recent review by Salvagiotti et al. (Reference Salvagiotti, Cassman, Specht, Walters, Weiss and Dobermann2008). Though application of P did not increase % Ndfa, more fixation of N took place due to response by soybean to added P and N, which resulted in an increase in root biomass and provided more surface for nodules. Over the years this has improved soil carbon. Application of FYM produces favorable condition (Broadbent et al., Reference Broadbent, Nakashima and Change1982), which increases N2 fixation by soybean (Kundu et al., Reference Kundu, Singh, Tripathi, Manna and Takkar1996; Patterson and Rue, Reference Patterson and Rue1983; Singh et al., Reference Singh, Kundu, Biswas, Saha, Tripathi and Acharya2004).
Biological N2 fixation accredited in soil
Biomass N2 fixation in soybean was estimated by using % Ndfa, taking into account inputs and outputs of N (Table 6). The annual average N fixed by soybean was significantly influenced by the nutrient combination applied in a particular treatment. The lowest amount of biologically fixed N was recorded in control (62.8 kg ha−1 yr−1) and the highest was in NPK + FYM (161.1 kg N ha−1) by harvestable biomass of soybean. Though application of N, P and K has resulted in an increase in the quantity of N2 fixation by soybean compared with the control treatment, the maximum benefit was due to P application. There was further small increase in N2 fixation in soybean where FYM was applied. Data reported here also indicate that continuous absence of S from treatment also decreased N2 fixation by soybean. The decline in N2 fixation in absence of P is due to reduction in biomass of soybean, which ultimately had an adverse effect on the assimilation of N by the crop. Increase in N2 fixation on application of N suggests that soybean needs a small quantity of N as a starter dose in this environment. The N2 fixation reported in the literature varied from 0 to 333 kg ha−1 (Salvagiotti et al., Reference Salvagiotti, Cassman, Specht, Walters, Weiss and Dobermann2008). The values observed by us in the present study are near the mean value (125 kg ha−1) and more or less in similar range observed by us in our earlier study (Singh et al., Reference Singh, Kundu, Biswas, Saha, Tripathi and Acharya2004, Reference Singh, Singh and Kumrawat2008).
N accredited to soil
Computation of net N gain/loss was calculated by subtracting the N derived from soil by soybean from total amount of N added through RBNS considering % Ndfa in each case. The data observed in all treatment indicate net nitrogen gain in soil and ranged from 24.2 to 66.5 kg ha−1 (Table 6). Nitrogen fixation and gain of biologically fixed N2 in soil recorded in 100% NPK + FYM and 100% NPK were almost equal and were relatively larger compared to other treatments but less than 150% NPK. This suggests that in a cropping system, which includes a legume, the application of increasing amounts of N fertiliser may lead to lower fixation and less gain of N in the soil. The results reviewed indicate that under very high-yield condition, negative N balance is expected (Salvagiotti et al., Reference Salvagiotti, Cassman, Specht, Walters, Weiss and Dobermann2008).
CONCLUSIONS
We found that all the three crops responded to applied N, P and K but differ in time scale for showing yield response. The response to N and P was apparent from the beginning; the response to P was the highest. Responses of wheat to applied K were observed after 20 years. The decline in soybean yields over the years is due to changes in rainfall and its distribution with time and increase in maximum temperature. On an average, soybean adds 24.2 to 66.5 kg ha−1 of biologically fixed N annually, which had a beneficial effect on productivity of the following wheat crop. The absolute gain in soil N was found under all nutrient management options but quantity depended on the level of soybean productivity. Response of all the three crops to applied P since beginning in large quantity and maximum benefit in biologically fixed N suggest that external supply of P is essential. The amount of fixed N accredited to soil by soybean can be thus used to enhance and sustain productivity of subsequent crop and cropping system.