The historical evolution of human capital has eluded quantification. The concept is broad, comprising health, cognitive abilities, knowledge, physical skills, and even behavioral traits. But data limitations have forced historical researchers to rely on narrow, partial indicators such as school enrollments and self-reported literacy rates. And even these cannot be pushed back much before the mid-nineteenth century. In earlier periods, literacy must be inferred from signature rates in marriage registers or legal documents. Jaime Reis reports such estimates for the years around 1800 from some 15 European regions.Footnote 1 They range widely for males, from over 60 percent in northwestern Europe to below 20 percent in parts of Italy and under 10 percent in Eastern Europe. Pushing back still further, into the early modern era, reliable and comparable data become increasingly scarce. Harvey Graff is able to show improvements in signature rates in the seventeenth and eighteenth centuries, but for only a handful of countries: Britain, France, Spain, Sweden, and the Netherlands.Footnote 2 For the rest of Europe and for earlier periods, data are almost entirely lacking. Robert Allen's conclusion that human capital has no ability to explain progress and poverty in Europe between 1300 and 1800 may result more from his use of urbanization as a proxy than from its actual irrelevance.Footnote 3
And what of other cognitive abilities? In modern data, ability measures such as standardized test scores have a substantial impact on individual labor market outcomes. Richard Murnane, John Willett, and Frank Levy find that cognitive abilities have greater predictive power than educational attainment in the United States, and that mathematics skills in particular are those most highly correlated with wages.Footnote 4 Similarly, Francisco Rivera-Batiz reports that “quantitative literacy” significantly (in both senses) raises the probability of full-time employment among U.S. workers. Outside the United States, recent studies have found numeracy to be positively associated with labor force participation, full–time employment, annual weeks worked, and income in Britain, Canada, and Australia.Footnote 5 Often numeracy dominates literacy as an explanatory factor, particularly for women and among the less educated. Such differentiated analyses are uncommon at the aggregate level, however; the oft-cited finding that engineering students raise growth while law students lower it is the exception rather than the rule.Footnote 6
Historically, quantitative calculation was at the very heart of modern, rational capitalism according to Max Weber, Werner Sombart, and Joseph Schumpeter. They traced the roots of both to the invention of double-entry bookkeeping in late medieval Italy. Bruce Carruthers and Wendy Espeland describe in some detail the process of abstraction and organization inherent in compiling a ledger, which made possible the development of concepts like capital, depreciation, and rate of profit.Footnote 7 It is no accident that the introduction of Arabic numerals into Europe (by the merchant Leonardo of Pisa, aka Fibonacci) and the earliest accounts of mathematics education date from this same time and place. Numerous scuole d'abbaco thrived in Renaissance Florence according to Richard Goldthwaite, where the young sons of the commercial classes studied a mathematics curriculum that would change little before the nineteenth century.Footnote 8 Italy remained the European center of publication and instruction in mathematics and accounting until at least 1500, according to Frank Swetz.Footnote 9 Rebecca Emigh has studied the quantitative sophistication, or “numeracy,” of Tuscans in this period by analyzing their tax declarations for the famous Florentine catasto of 1427.Footnote 10 Ordinary citizens and peasants more often provided too much quantitative information (rents, size of plots, yields, debts, salaries) than too little, relative to the requirements of the tax officials. Causation, she argues, ran from market activity to numeracy to tax design, rather than in reverse. Patricia Cohen studies this link between market activity and numeracy for the early-nineteenth-century United States.Footnote 11 A sophisticated literature on the history of numeracy certainly exists, but it does not yield statistical measures. Can we quantify quantitative reasoning?
AGE HEAPING
It turns out that we can. As signature ability can proxy for literacy, so accuracy of age reporting can proxy for numeracy, and for human capital more generally. A society in which individuals know their age only approximately is a society in which life is not governed by the calendar and the clock but by the seasonal cycle; in which birth dates are not recorded by families or authorities; in which few individuals must document their age in connection with privileges (voting, office-holding, marriage, holy orders) or obligations (military service, taxation); in which individuals who do know their birth year struggle to accurately calculate their age from the current year. Approximation in age awareness manifests itself in the phenomenon of “heaping” in self-reported age data. Individuals lacking certain knowledge of their age rarely state this openly, but choose instead a figure they deem plausible. They do not choose randomly, but have a systematic tendency to prefer “attractive” numbers, such as those ending in 5 or 0, even numbers, or—in some societies—numbers with other specific terminal digits. Such “age heaping” can be assessed in a wide range of sources: census returns, tombstones, necrologies, muster lists, legal records, or tax data, for example. While care must be exercised in ascertaining possible biases, such data are much more widely available than signature rates and other proxies for human capital.
Age heaping is a well-known phenomenon among demographers, development economists, and anthropologists. Already a half-century ago, influential studies by Roberto Bachi and Robert Myers investigated age heaping and its inverse correlation with education levels within and across countries. Myers later demonstrated a similar inverse correlation between age awareness and income at the individual level as well.Footnote 12 For others, including epidemiologists, age heaping is a problem to be solved, a source of distortion in age-specific vital rates. Melvin Zelnik, for example, assessed age misreporting in the United States between the 1880 and 1950 censuses.Footnote 13
Meanwhile, historians have studied age heaping as a topic of interest in its own right. In their landmark study of Florentine tax records from the fourteenth and fifteenth centuries, David Herlihy and Christiane Klapisch-Zuber document marked heaping on even numbers for children and on multiples of five for adults, to a degree similar to that reported for Egyptian census data in 1947.Footnote 14 Age heaping diminished substantially over successive tax enumerations from 1371 to 1470, and was more prevalent among women, in rural areas and small towns, and among the poor. Daniel Kaiser and Peyton Engel report similar age heaping levels for early modern Russia.Footnote 15 A well-known study is Richard Duncan-Jones' analysis of grave monument inscriptions in twelve provinces of the Roman Empire. He finds age heaping on multiples of five at rates not dissimilar to those for medieval Tuscany or developing countries of the 1950s and 1960s, and higher for women than men.Footnote 16
There has been little use of age heaping as an indicator of human capital in the economic history literature. Joel Mokyr tests for positive selection or “brain drain” in pre-famine Irish emigration by comparing age heaping among migrants to the population at large.Footnote 17 Developing original measures of age heaping along the way, he finds no support for the conventional wisdom that the best and brightest emigrated. In other studies of Ireland, John Budd and Timothy Guinnane report considerable heaping on multiples of five in the 1901 and 1911 censuses among the illiterate, the poor, and the aged; Cormac O'Grada, among Dublin's immigrant Jewish population.Footnote 18 O'Grada interprets age heaping as confirming that low Jewish literacy rates did not refer only to the English language and, consequently, that their lower mortality rate was the result of religious practices rather than education. For Britain, Jason Long has assessed age heaping in linked samples from the censuses of 1851 and 1881. A quarter of his 1851 school-aged children reported ages in 1881 that were from two to five years different from the expected 30-year increment. Countywide age heaping had a limited impact on individual labor market outcomes, once other county characteristics were controlled for, but individual age discrepancies had a significant impact on socioeconomic status, wages (10 percent higher for zero-discrepancy individuals), and the probability of rural-urban migration.
To deploy age heaping as a useful indicator of human capital, we require a measure that allows us to track its variation over time and across groups. We propose a variant of the well-known Whipple Index, which is simple, robust, and easy to interpret. The Whipple Index is the ratio of the observed frequency of ages ending in 0 or 5 to the frequency predicted by assuming a uniform distribution of terminal digits (in other words, one-fifth).

An index value of 500 would indicate perfect heaping on multiples of five; a value of 100 no heaping at all; and a value of 0 perfect “anti-heaping.” The notation in equation 1 is meant to emphasize that W must be defined over an interval in which each terminal digit occurs an equal number of times, for example 30–39 or 23–72. The prediction of equal terminal digit frequencies is what makes the Whipple Index easy to calculate, but is also a source of inaccuracy. In a typical population, frequencies decrease with age; in the interval 50–54 one would expect fewer 54 year olds than 50 year olds, even in the absence of heaping. Restricting attention to intervals of (multiples of) ten years helps mitigate this problem. A more obvious limitation of the Whipple Index is that it can capture only heaping on multiples of five. In practice, this is the overwhelmingly dominant form of heaping observed for adults across a wide range of times and places in our data. (Among children and adolescents even heaping is common.)
In a separate study, we compare the statistical properties of the Whipple Index with alternatives including measures proposed by Bachi, Myers, and Mokyr.Footnote 19 In simulation studies, the Whipple Index demonstrates several advantages. First its mean is not scale dependent, meaning that W can be compared across samples of widely varying size. Second, E(W) increases linearly with heaping, again facilitating comparisons. Finally, the coefficient of variation of W across random samples is systematically lower than for the alternatives, at all sample sizes and for all degrees of heaping. This leads to greater reliability in correctly ranking samples according to the true extent of heaping in the underlying populations. In this article, we employ a simple transformation of the Whipple Index that can be interpreted as the share of individuals that correctly report their age

NUMERACY AND LITERACY IN THE U.S. CENSUS
Our claims are that first, age heaping is a useful indicator of basic numeracy; and second, numeracy is an important component of human capital more broadly. An absence of historical data on individual cognitive abilities makes it difficult to test either proposition directly. We propose to evaluate the second assertion by investigating age heaping's correlation with the more familiar measure literacy in the Integrated Public Use Micro Samples (IPUMS) of nineteenth-century U.S. censuses. We extracted records for nearly 650,000 men and women aged 20–69 from the IPUMS samples for 1850, 1870, and 1900.Footnote 20 The earliest available IPUMS sample is 1850, while 1900 is important because census enumerators inquired about both age and birth-year, possibly eliciting more considered responses that better reflect age awareness. The data used for this study include age, race, literacy (the ability to read and write, in any language, with no reference to proficiency), and birthplace.
We first consider the numeracy-literacy relationship at an aggregate level. For each combination of census, birthplace, and ethnic group with at least 100 observations, we calculate  and the literacy rate. Literacy rates vary widely, from under 25 percent among the former slaves of the American South in 1870, to over 99 percent among the white populations of several northeastern states. Numeracy measured by displays somewhat less variation, ranging from under 65 percent, for 1850 free and 1870 emancipated black populations, to over 98 percent for whites in several U.S. states and foreign birthplaces in 1900. The higher minima for suggest that age heaping captures a very basic level of numeracy.
Table 1 and Figure 1 illustrate the regional numeracy-literacy relationship in the IPUMS data.Footnote 21 Overall and in every subsample, there is a positive, statistically significant correlation. OLS regressions of literacy on numeracy yield slope estimates mostly in the range 1.5 and 3.0, so that small changes in numeracy are associated with larger changes in literacy. This reflects the wider range of variation in literacy. There is considerable noise in the relationship in some samples, as indicated by low R 2 values. In particular, the correlation weakens considerably when only high-literacy, high-numeracy regions are considered. It is worth noting that the correlation of literacy and numeracy is quite robust, emerging also in pooled and region fixed-effects models and with controls for gender balance (relevant for some immigrant samples). Nor does it vanish in the census of 1900, when more accurate age reporting may have been induced by separate questions about age and birth year. All in all, these results suggest that is reliably correlated with human capital as proxied by literacy in contexts where both are low, as in the southwest quadrant of Figure 1. This, as we shall see, is the range typical of preindustrial Europe.
The individual level IPUMS data allow us to address the question of whether age heaping reflects more the characteristics of individuals or of the society they inhabit. We can also study the effects of variables we will be able to observe in our early-modern age-heaping data set, in particular gender and age group. We model the probability of reporting a multiple-of-five age as a logistic function of the birth-region literacy rate, which captures aspects of the social environment,
REGIONAL LITERACY AND NUMERACY IN NINETEENTH-CENTURY U.S. CENSUSES

Notes:
Estimated slope coefficients from OLS regressions; data points are aggregate literacy and numeracy rates for a particular birth region, ethnic group, and census; birth regions with samples of at least 100; robust standard errors in parentheses; high/low literacy and numeracy are above/below the sample means of 80.1 and 87.3, respectively; IPUMS data, ages 20–69. Sources: See the text.
Sources:
See the text.
and of individual characteristics: personal literacy, and dummies for sex, age group, and Irish ethnicity. Personal literacy is intended as a measure of human capital. A female dummy is included because basic numeracy skills could be acquired and maintained independently of formal education and literacy, for example through frequent market transactions. It is at least possible that such opportunities differed by gender. Age group controls are included because the tendency to heap can vary with age itself. Younger individuals are more likely to have recently passed landmarks at which their age was ascertained, such as marriage, military service, or immigration. Older individuals may be more likely to forget their ages.Footnote 22 (The extremely old, who sometimes deliberately exaggerate their age, have been excluded from the sample.) And society may provide incentives to deliberately distort true age. There is some evidence that young women tended to round their ages down, for example––possibly in response to marriage market pressures.Footnote 23
LITERACY AND NUMERACY IN THREE U.S. CENSUSES

The estimates in Table 2 indicate that the probability of reporting a heaped age depends negatively on both personal and birth region literacy. This is true of the sample as a whole and every subsample. In the full sample, the marginal effect of personal literacy is to reduce the probability of reporting a heaped age by about 4 percentage points.Footnote 24 This magnitude is fairly large compared to the 9.2 percentage point excess frequency (0.292–0.200) of multiple-of-five ages. Estimates for various subsamples vary from –1 to –6 percentage points, and are statistically significant at the 1 percent level in all but two cases. At the individual as well as the aggregate level, then, accurate age reporting is correlated with a familiar measure of human capital.
An individual's probability of reporting a heaped age also depends on the society in which she is brought up. Birth region literacy has a statistically significant (at the 1 percent level) negative marginal effect on age heaping in the sample as a whole and every subsample. The full-sample estimated effect of a 10 percentage point rise in regional literacy is to lower the probability that an individual reports a multiple-of-five age by about 2 percentage points. The range in various subsamples is from –1.5 to –3.1 points. Because the regressions control for personal literacy, these estimates mean that an illiterate individual is less likely to report a heaped age in a highly literate society. This interpretation is borne out by the smaller estimated effect of personal literacy in the subsample of individuals from highly literate birth regions only. A range of factors could underlie this result, from greater reliance on written records and greater spread of markets in highly literate societies, to more precise knowledge on the part of the person interviewed by the census enumerator regarding the ages of other household members.
That reflects not only individual, but also social characteristics is evident in the large positive effects of Irish ethnicity in the foreign-born subsamples. The Irish, who comprise the largest share of the foreign-born, have low levels of literacy but extremely low levels of age numeracy, relative to other groups. Turning to gender, women are estimated to have a higher probability of reporting a heaped age in all samples. The effect is small on average, +1.1 percentage points in the full sample, and not always statistically significant in subgroups, but is consistently positive.
MARGINAL EFFECTS ON THE PROBABILITY OF REPORTING A HEAPED AGE, IPUMS DATA

Notes:
Marginal effects of estimated coefficients of logistic regression, evaluated at means of all variables; IPUMS data on adults aged 20–69 from birthplaces with at least 100 observations; marginal effects in italics are not statistically significant at the 3 percent or better level; degrees of freedom for the chi-squared likelihood ratio test are 5 or 6 depending on the model, but in all cases the p-value is zero to three decimal places.
Sources:
See the text.
Finally, age group effects are large, statistically significant, and consistent across all subsamples; the probability of reporting a heaped age rises with age itself. In the full-sample estimates, individuals in their 20s were almost 8 percentage points less likely to report a heaped age than those in their 30s (the reference group), while those aged 40 and above were 3 points more likely to do so. Across subsamples, the magnitude of the aging effect varies with the degree of heaping. Among native blacks in the 1870 census, a high heaping sample, the age group effects are –21 percentage points and +10 points for those under 30 and over 40, respectively. Among low heaping native whites in 1900, by contrast, the estimated age group effects are only –1.7 and +1.7 points. Comparison of the same cohorts across successive censuses revealed that these effects can indeed be attributed to aging, rather than a time trend. Experimentation with alternative specifications indicated that in the IPUMS data, there were no discernable differences by age within the over-40 group.
A EUROPEAN AGE-HEAPING DATA SET, 1300–1800
To explore the potential of age heaping as a long-run indicator of human capital, we have assembled a data set that maximizes breadth of coverage over time, place, and source type. The numeracy database covers over 130 locations in 16 European countries over birth decades in the half-millennium from 1350 to 1840. It consists of over 300 samples, which we define as data from a particular source type, from a specific decade, in a specific location, for one gender. The median sample size is just over 900 individuals, while at the extremes we have a handful of samples with less than 100 observations and a few with several million (from mid-nineteenth-century censuses).
Age distributions can be recovered from a wide range of sources in early modern Europe. The most comprehensive are of course censuses of population, which aimed at complete coverage across genders, ages, social classes, and locations. Though censuses date as far back as ancient times, early examples often did not inquire about exact age, or reported the data in aggregated form only, for example by five-year age groups. Only from the late eighteenth century do surviving census records commonly provide single year age frequencies. The accuracy of census data—even in modern times—depends on the efforts of enumerators and the details of interview procedures and questionnaire design. These varied over time and across countries, potentially creating spurious variation in numeracy estimates. But this criticism applies with equal force to other indicators of human capital, in particular literacy estimates based on signature rates. Some clergy, in some times and places, insisted on signatures in the marriage registry, while others did not, and the choice itself was probably not random. Our data set includes 130 samples drawn from census data, covering 15 countries, and birth decades from 1390 to 1840.Footnote 25 It includes two precocious censuses from Pozzuoli and Sorrento in southern Italy, dating from 1489 and 1561, respectively. Our census data was assembled from previously compiled age distributions in digital or paper format, as detailed in an appendix available online.Footnote 26
Dating from as early as the sixteenth century, “soul registers” (libri status animarum) are another rich source of historical age data, mainly for central Europe. Soul registers were compiled by local clergy to gauge the needs and revenue-generating potential of their parishes. (And the spiritual welfare of their flocks; enumeration revealed such phenomena as cohabitation of unmarried couples and the presence of individuals of different faiths.) They aimed at census-like coverage of the relevant ecclesiastical unit. While soul registers were common across a wide range of time and space in both Catholic and Protestant areas, surviving records are available only sporadically and therefore yield less systematic evidence than censuses. Having access to birth and baptism registers, clerics sometimes counterchecked and corrected age statements in the soul registers. As a consequence, some soul registers exhibit essentially no age heaping (W < 105) even in largely illiterate, rural communities. When soul registers indicate extremely low age heaping, comparison with alternative sources from similar regions is prudent as a check. Our database includes approximately 70 samples drawn from soul registers, covering six central European countries and the United Kingdom, over birth decades from 1580 to 1830.Footnote 27 Our data, in the main, were originally transcribed or digitized by local historians and genealogical researchers, as detailed in the online appendix.
The earliest efforts by temporal authorities to collect systematic data on their domains are, unsurprisingly, fiscal in nature. Tax rolls listing the number of hearths (households) were common in medieval times. In some cases, detailed information including the self-reported age of household heads was collected. Our data set includes nearly 40 samples from fifteenth-century Italy drawn from tax registers, principally the famous 1427 catasto of Florence and its possessions. The data, comprising over 50,000 individual observations, are taken from the work of Herlihy and Klapisch-Zuber.Footnote 28 Tax registers ordinarily provide information on heads of household only. Even within this group, there may be selection by social group if only property owners are included. For both reasons, the concern is that fiscal data may suffer positive selection by social class or wealth. The same is true of civil legal documents that report the ages of litigants, witnesses, transactors, or beneficiaries. Our database includes one such sample, Dutch testaments of the 1510s. Negative selection may instead characterize sources deriving from the criminal justice system, such as the eight samples drawn from Deborah Oxley's nineteenth-century British prison data.Footnote 29
Military records offer copious quantities of data in the form of conscription and muster lists. Conscription lists offer nearly complete data on young men eligible for military service. The database includes two such samples, one from southern Germany in the 1520s, the other from Hungary in the 1710s. More common are muster lists, which enumerate the personnel actually serving in military units. The database includes 30 samples from the French army, covering birth decades from 1650 to 1750. These data were drawn from John Komlos' height data set for early modern France.Footnote 30 The French army in this period was a volunteer force, in which the lower classes were overrepresented (since non-inheriting sons and others with relatively low opportunity costs had greater incentives to enlist). On the other hand, the social selection of older soldiers, who tended to be either officers or skilled specialists such as physicians, is less clear. And minimum height requirements and other recruiting biases favoring tall (better nourished and healthy) individuals further offset negative social selection. In both types of source, numeracy cannot be assessed for the younger ages due to the distortion typically induced by a uniform age of conscription or minimum enlistment age.Footnote 31
The movement of people also occasioned the recording of personal data including age. By the nineteenth century, passports, ship manifests, and the records of immigration authorities are useful sources. Passenger lists from oceanic voyages survive from even earlier periods, as do indenture contracts. Our data set includes two samples from passenger lists, covering several hundred emigrants who departed Britain in the 1630s and 1640s. Though there is something of a presumption in the literature that emigrants are positively selected, it is difficult to document this because early ship manifests typically did not record occupations or wealth. Our passenger lists were taken from internet-based genealogical sources.
Death and marriage registers are a further source of age data for the early modern period. In many marriage registers, ages were self-reported and not cross-checked against birth registers. As with military records, accurate assessment of age heaping in marriage records can be impeded by the concentration of betrothed partners in a narrow range of ages. As for Duncan-Jones' tombstone inscriptions, death registers reflect household members' knowledge of the deceased's age, and could thus lead to upwardly biased estimates of heaping levels. Unlike grave monuments, it is not likely that death registers suffer from positive social selection. Our database includes approximately 20 samples drawn from death registers in Geneva, Berlin, Paris, Milan, and the Polish town of Radzionkow, over birth decades from 1650 to 1820. Sources are given in the online appendix.
The exceptional breadth of our database (eight source types, 49 birth decades, and 130 locations in 16 countries) inevitably implies that coverage is also thin, and that the data are heterogeneous. A continuous run of samples over many decades, from a representative set of locations in a particular country, drawn from the same source type, is very much the exception in the numeracy database. Our samples cover men and women, urban and rural places, various age ranges, and source types with diverse potential biases. In this exploratory study, we have opted for simplicity in procedures for generating age-heaping estimates from the data.
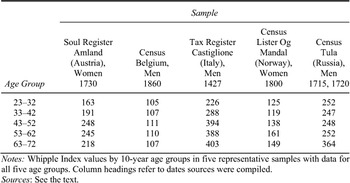
Age itself proved the thorniest issue. A fairly straightforward decision was to restrict the analysis to ages 23 to 72. The young were dropped because several of our sources, in particular the military data, have such a concentration in a narrow range of ages around 20 that age-heaping measures are distorted. The old were dropped because of the tendency to deliberately exaggerate age, along with small sample sizes. More problematic was the aging effect identified in the IPUMS sample, which is also evident in our early modern data. Table 3 presents Whipple indices (W) calculated separately for 10-year age groups from 23–32 to 63–72, for five typical samples with complete information, representing various countries and source types, and both
AGE GROUP AND AGE HEAPING IN FIVE COMPLETE SAMPLES

Notes:
Whipple Index values by 10-year age groups in five representative samples with data for all five age groups. Column headings refer to dates sources were compiled.
Sources:
See the text.
genders. The general tendency of age heaping to increase with age is apparent. Because mean age varies considerably across samples, and because in some cases just one sample represents a particular country in a particular period, some type of age-standardization is necessary if age-heaping comparisons are not to mislead.Footnote 32
A natural solution is to regress W on age-group dummies, with controls for time, gender, location, country, and source type. Estimated coefficients could then be used to standardize each sample to a common basis, for example males aged 33–42 from census data sources. But the aging effect is far from uniform, as the figures in Table 3 suggest. The only consistent pattern that can be discerned in the database as a whole is that the aging effect is weaker, in both absolute and proportional terms, the lower is the baseline level of heaping in the 23–32 group. Meanwhile, gender gaps vary across countries in magnitude, trend, and even sign. Source type correlates with time and place: census data come mostly from the end of the sample; military records are mostly French; and tax register data are early and Italian. And of course the hypothesis that time trends vary across countries is the very motivation for the study. This heterogeneity undermines efforts to identify a parsimonious regression model capable of fitting the data well.
We opt instead for an approach that is simple and respects patterns specific to time and place. We begin by completing all samples with missing age groups—roughly half the total.Footnote 33 When at least two age groups are observed, missing values are filled in by linear interpolation or extrapolation, subject to the constraints that W be nondecreasing in age and be bounded by 100 and 500. For the handful of samples with only a single age group, we impute the missing data on the basis of a regression of W on age-group dummies, a gender dummy, and a time trend, using data from a neighborhood around the sample, defined as same country within plus or minus 150 years.Footnote 34 Examples of these procedures are illustrated in Figure 2. An overall sample value for W is then calculated as a simple average of the age-group specific figures.
In aggregating samples, we take simple averages across all locations and genders, by country and half-century of birth.Footnote 35 We lack data on within-country variation in urbanization, economic structure, or income that might permit the identification of geographic patterns such as urban-rural disparities. Gender differences can be identified, but are too varied to permit any uniform treatment or standardization. Though a promising topic for further research, in this article gender gaps disappear into a single aggregate.Footnote 36 All numeracy figures () discussed in the remainder of the article are based on such 50-year, countrywide averages. Table 4 presents the database in summary form.
AGE HEAPING AND LITERACY IN PREINDUSTRIAL EUROPE
To repeat the correlation analysis of literacy and numeracy for an earlier period, we cull pre-1850 literacy estimates from a wide range of secondary sources (detailed in the online appendix). The original sources are predominantly signature rates—mostly of spouses and witnesses in parish marriage registers, but in some cases deriving from court proceedings or other legal documents. The limitations of signature ability as a measure of functional literacy are obvious, but the same can be said of self-reported “ability to read” in census data. In practice, signature and reading ability are well correlated where both can be observed. In historical curricula, reading instruction was largely completed before writing was started. Perhaps even more than the age heaping based numeracy figures, the literacy estimates tend to be based on small samples, the representative nature of which is difficult to judge. And when the secondary sources consulted omitted data on age or birth year, it was necessary to assume an average age based on the source type (e.g., mid-twenties for spouses) in order to assign the literacy estimate to the relevant birth half-century. For 28 country-birth half-century pairs, we observe both literacy and numeracy (Figure 3).
ESTIMATION OF MISSING AGE-HEAPING DATA IN THREE INCOMPLETE SAMPLES
The expected positive correlation between age heaping-based numeracy and signature-based literacy is evident. The data points would not look out of place in Figure 1, though lower literacy levels would situate them in the lower portion of the graph. At 0.86, the slope of the fitted regression line is considerably less than in the nineteenth-century
AGE HEAPING BASED ESTIMATES OF NUMERACY ()

Notes:
Average values of the alternative Whipple Index () described in text, for all locations and both genders, by country and half-century of average birth year (for example. “1600” = 1575–1624); estimates in italics are based on samples of less than 500.
Sources:
See the text.
data, as is the R 2 of 0.40 (compare Table 1). These differences are consistent with greater measurement error in the early modern data. Protestant Germany and Ireland lie well to the northwest of the OLS line, indicating a lower level of numeracy than we would have predicted from their literacy levels. Norway illustrates the mirror-image case of high numeracy and low literacy.
As indicated by the dashed lines connecting successive observations and the arrows showing the direction of time, numeracy and literacy also moved together within countries over time. In general, countries move in a northeasterly direction, indicating simultaneous improvement on both measures of human capital. Protestant Germany, France, Denmark, and the United Kingdom show this pattern. The only clear exception, Protestant Germany between 1750 and 1800, can be attributed to a change in the underlying sources.Footnote 37 Three countries start from unusually low levels of numeracy ( < 60): northern Italy in 1450, Hungary and Russia in 1650. All three show dramatic improvements in estimated numeracy, with little or no improvement in literacy.Footnote 38 Such development is consistent with the ideas that age awareness measures a very basic level of numeracy, and that numeracy can be acquired without formal schooling. Countries that depart from higher levels of numeracy, by contrast, improve literacy dramatically, without being able to generate similar improvements in numeracy. This is consistent with age-heaping innumeracy having been reduced to a “hard core” of relatively inaccessible regions or social groups.
LITERACY AND NUMERACY IN EARLY MODERN EUROPE
NEW ESTIMATES OF HUMAN CAPITAL IN THE VERY LONG RUN
Our age heaping based numeracy estimates are plotted against time in Figure 4. It is apparent that Western Europe already enjoyed high rates of numeracy in the early modern era. By the period around 1600, the Netherlands, Britain, northern Italy, and probably France boasted figures of 70 percent or more. By 1700 numeracy rates are in the vicinity of 90 percent for these countries, as well as for Scandinavia. The individual human capital, collective number discipline, and administrative capacity that low age heaping reflects were evidently well-developed long before the spread of schooling, the rise of literacy, or the Industrial Revolution. In northern Italy, we observe improvements in numeracy as far back as the Middle Ages, starting from levels in the fourteenth century that are not far removed from (and probably lower than) those that had prevailed a millennium earlier in Roman times.Footnote 39 It is natural to speculate that Italy experienced a long stagnation or decline following the collapse of the Empire, followed by a turnaround associated with medieval state-building or commercial expansion, and slow but steady progress into the early modern period. The cases of southern Italy and Ireland (within the United Kingdom) suggest the possibility of substantial and persistent regional disparities, that of Belgium a capability for rapid catch-up.
The German-speaking lands of Central Europe present a varied picture (Panel B). Both Catholic Austria and the Protestant areas of what would later become Germany have impressive numeracy rates circa 1600, on a par with those of Western European countries at the same time. In Germany as in Italy, this seems to have resulted from a long period of improvement beginning in the Middle Ages. The Catholic areas of Germany, along with Switzerland, have lower numeracy rates when we first observe them around 1700, but display strong convergence thereafter.Footnote 40 The ethnic Germans of Prussian Silesia (in modern Poland) fit the overall pattern with high levels of numeracy in the eighteenth century.
NUMERACY IN THE LONG RUN
The development of basic numeracy in Eastern Europe contrasts sharply with that in the West. In the mid-1600s, Bohemia, Hungary, and Russia have numeracy rates in the range from 30 to 45 percent. These are some of the lowest figures observed in the data set, similar to levels observed in the eastern provinces of the Roman Empire circa 200 C.E., or to those of medieval northern Italy.Footnote 41 It is interesting to note that East-West disparities are greatest when we first observe them, in the early seventeenth century. Any divergence between the two would appear to have taken place already in the Middle Ages and Renaissance, rather than during the later era of “second serfdom” in the East. That period instead saw some convergence in numeracy rates, at least from 1650 and in the Habsburg dominions Bohemia and Hungary.Footnote 42 In Russia too, basic numeracy appears to have increased. Though the 89 percent figure in Table 4, based on a miniscule sample, exaggerates this improvement, there can be little doubt of the change. Plausible is a figure closer to Dorothee Crayen and Jörg Baten's census-based estimate of 77 percent for the decades around 1850, which would put Russia close to Irish numeracy levels circa 1800. In Serbia, still a province of the Ottoman Empire in the eighteenth century, numeracy remained as low as 55 percent even in the decades around 1800, lagging Western Europe by more than two centuries.
CONCLUSION
It is difficult to imagine capitalism without calculation. Rates of interest, profit, and exchange were at the heart of things even before engineering or science became important in generating technical change. Measurement of numerical cognitive abilities is thus a natural complement to measuring literacy in the history of human capital. As signature rates, despite their limitations, can proxy for basic literacy, so age heaping can index basic numeracy. Both measures offer a partial view of human capital, and both reflect not only individual but also broader social capabilities—a sort of administrative capital. The two measures are well correlated where both can be observed. But the wider range of primary sources from which age heaping can be calculated allows us to extend knowledge of human capital to times and places where signature rates are unavailable: back into the Middle Ages and east into Central Europe and beyond.
Our new estimates of numeracy suggest that the most basic mathematical skills diffused earlier than literacy. In the early Middle Ages, numeracy may have remained at or below levels observed in antiquity, a thousand years earlier. In Western Europe and in the German-speaking lands of Central Europe, a slow but steady improvement appears to have set in by late medieval times, bringing several countries to numeracy rates on the order of 70 percent by the decades around 1600. This period appears to have been the point of maximum divergence from Eastern Europe, where numeracy rates were only beginning to rise from very low levels. This progress before the era of formal schooling, together with the apparent divergence of Eastern and Western Europe, prompts the conjecture that the spread of market activity fostered the development of quantitative reasoning among ordinary citizens.Footnote 43 Engendering the early, widespread diffusion of numeracy in the West, commercial evolution can thus be seen as laying the foundations for the subsequent industrial revolution.