I. INTRODUCTION
Tantalum carbide (TaC), similar to Hafnium carbide, has a melting point above 4000 °C and is among the most refractory binary compound known to date. Reference Hong and Wall1 TaC also has other impressive materials properties such as high hardness (19 GPa), high elastic modulus (537 GPa), and high electrical conductivity (>5 × 10⁶ Ω−1 m−1 at 300 K). Reference Toth2,Reference Storms3 Such impressive properties enable this high-performance refractory material to play an important role in applications involving aggressive environments ranging from gas turbines to heat shields for hypersonic vehicles. Reference Padture, Gell and Jordan4,Reference Perepezko5,Reference Lu6,Reference Liu, Zhang, Jiang, Ding, Sun, Sun and Ma7 Tantalum carbide is also used in refractory ceramic alloy materials, especially as components of tungsten carbide alloys. Reference Toth2 Furthermore, TaC is also known to be a superconductor with a T c of 10.35 K. Reference Meissner and Franz8
Transition-metal carbides are typically produced at extreme temperatures (above 2300 °C) and pressures (200–400 MPa) from component elements Reference Alexandre, Desmaison, Valin and Boncoeur9–Reference Kim, Shon, Garay and Munir11 ; for example, the typical precursor materials for producing TaC are Ta powder and graphite. Reference Alexandre, Desmaison, Valin and Boncoeur9 However, compaction under high temperature and pressure such as in the hot isostatic pressing (HIP) process promotes grain growth of the particles to micron sizes. Reference Alexandre, Desmaison, Valin and Boncoeur9–Reference Kim, Shon, Garay and Munir11 With the assistance of a sintering aid such as MoSi2, pressureless sintering of TaC has been performed at a relatively lower temperature (i.e., at 2000 °C). However, this approach also yields micron-sized particles. Reference Ghaffari, Faghihi-Sani, Golestani-Fard and Ebrahimi12 Recently, there has been considerable interest in producing nanoparticles of TaC (<100 nm) to exploit the empirical Hall–Petch relationship, the phenomenon whereby a material’s strength and hardness are increased by decreasing the average crystallite grain size. Reference Pande and Cooper13 Nanoparticulate forms of materials can also reduce the compaction temperature and shorten the sintering time during conversion to ceramics. We recently demonstrated a novel method of producing nanoparticles of both TiC Reference Keller, Laskoski, Saab, Qadri and Kolel-Veetil14 and WC Reference Kolel-Veetil, Goswami, Fears, Qadri, Lambrakos, Laskoski, Keller and Saab15,Reference Kolel-Veetil, Goswami, Fears, Qadri, Lambrakos, Laskoski, Keller and Saab16 refractory carbides using the organic aromatic precursor 1,2,4,5-tetra(phenylethynyl)benzene (TPEB) with respective transition metal powders under ambient pressure and much lower temperatures (i.e., below 1500 °C).
Recently, there have been a few reports of the production of tantalum carbide utilizing small molecule organometallic precursors Reference Girolami, Jensen, Gozum and Pollina17–Reference Chang, Wu, Chang and Chiu19 and polymeric precursors Reference Lu, Ye, Han, Sun, Qiu and Zhao20–Reference Stanley, Birchall, Hyland, Thomas and Hodgetts23 wherein the reactions involve Ta mainly in its oxide form, Ta2O5, leading to the expulsion of gaseous by-products such as CO, CO2, and NH3 during the synthesis. In general, with regard to the synthesis of nanoscaled transition metal carbides, substantial work has originated from the groups of Riedel, Reference Wu, Yu, Xu, Fasel, Guillon, Buntkowsky, Yu, Riedel and Ionescu24,Reference Yuan, Hapis, Breitzke, Xu, Fasel, Kleebe, Burtkowski, Riedel and Ionescu25 Ionescu, and others which was captured in a focus issue Reference Balazsi, Dusza, Lojkowski, Reece and Riedel26 of the Journal of the European Ceramic Society. While the single source precursors in these studies have molecular level bonding between the transition metal and carbon, the chemistry to produce such precursors is complicated and the obtained ceramic nanocomposites are contaminated with other by-products such as nitrides and silicides of transition metals, SiC, etc. Beneficially, such procedures provide the ability to control the phase compositions and microstructures in the final ceramic composite. Over a decade ago, we had demonstrated such phase- and size-controlled formation of molybdenum carbide from a molybdenum-derived poly(carboranylene-siloxane-diacetylene) single-source precursor with molecular level bonding between molybdenum and carbon. This single source precursor when pyrolyzed to below 900 °C produced α-Mo2C nanoparticles of <5 nm dimension and upon pyrolysis to temperatures between 900 and 1000 °C produced β-Mo2C nanoparticles that were ∼25 nm in size. Reference Kolel-Veetil, Qadri, Osofsky, Keller, Goswami and Wolf27 We were able to show that in the α-Mo2C nanoparticles, since the smaller size of the particles placed them below the Anderson criterion limit, i.e., the minimum particle size that is necessary for a conventional BCS superconductor particle to sustain Cooper pairs, they were rendered nonsuperconducting or insulating. As with the alluded recent studies using single-source precursors, our Mo2C-containing ceramic nanocomposite product also contained amorphous boron and silicon compounds of molybdenum and carbon nanotubes. Reference Kolel-Veetil, Qadri, Osofsky and Keller28 In the present work, we explored the reaction of TPEB with Ta powder at temperatures below 1500 °C and at ambient pressures to produce monolithic composites that contain uniformly structured nanoscale TaC crystallites. Although there is no molecular level bonding between tantalum and carbon in the starting mixture, the present method utilizes crosslinking reactions among the TPEB’s acetylene groups to form shaped monoliths and to further facilitate reactions between such crosslinked entities and the proximal transition metal nanoparticles. Such crosslinking facility yields the opportunity to produce composites of any desired shape during the production of the transition metal carbide nanomaterial. Since the evolved gaseous by-products are only hydrogen molecules, the resulting composites exhibit minimal porosities.
II. EXPERIMENTAL
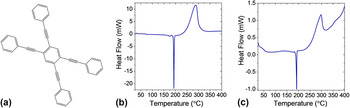
A monolithic pellet was initially formed by mixing 12 g of Ta powder (66.4 mmol) with 0.942 g of TPEB (74.9 mmol) [Fig. 1(a)] (i.e., a 1:1 atom equivalent of Ta and C, with 5% excess carbon to offset char yield losses) in batches using a mortar and pestle. The entire mixture was then placed in a pellet presser under an applied vacuum and pressed at 131 MPa (19,108 PSI). The pellet was thermally treated in a thermal oven under an atmosphere of flowing argon (100 mL/min) to 1400 °C at a rate of 2 °C/min, held isothermally at 1400 °C for 4 h and then cooled to ambient conditions at 2 °C/min. The produced pellet is 1″ in diameter and has a thickness of 0.1″.
(a) Structure of TPEB and DSC thermograms of (b) TPEB and (c) a blend of TPEB:Ta at the same ratio as used in forming the pellet used in this study.

The differential scanning calorimetry (DSC) studies of TPEB and a mixture of TPEB and Ta powder were conducted in argon at temperatures up to 400 °C with a ramping rate of 10 °C/min using TA Instruments' SDT Q600 Instrument (TA Instruments, New Castle, Delaware). To study the transformations of a pellet of TPEB and Ta in argon, a small pellet (i.e., ∼50 mg in weight) was formed as above and thermally treated to 1500 °C at 10 °C/min in a Netzsch STA 449 F3 Jupiter instrument (NETZSCH Instruments North America, LLC, Burlington, Massachusetts) under 100 mL/min flow of argon. The oxidative stability study was performed on the above sample in a TA Instruments SDT Q600 Instrument (TA Instruments, New Castle, Delaware) under 100 mL/min flow of air by heating to 1400 °C at 10 °C/min, subsequently cooling to ambient, and, finally, reheating to 1400 °C at 10 °C/min.
X-ray diffraction (XRD) analyses were performed using a Rigaku 18 kW X-ray generator and a high-resolution powder diffractometer (Rigaku Corp., Tokyo, Japan). XRD scans of the TaC-containing pellet and the oxidized Ta2O5-containing sample were obtained using Cu Kα-radiations from a rotating anode X-ray source. The crystallite size was determined using an external standard of Si for instrumental broadening and using Halder–Wagner method and analysis of the observed peaks after correcting for instrumental broadening at their full width at half maximums (FWHMs). Reference Halder and Wagner29 A Sartorius YDK 01 Density Determination Balance (Sartorius AG, Goettingern, Germany) was used to determine the density of TaC pellets. The surface morphology of the pellets was characterized by scanning electron microscopy (SEM) using a Supra 55 field emitting microscope (Carl Zeiss Microscopy, Oberkochen, Germany) operating at a beam voltage of 3.0 kV and at a working distance of approximately 5 mm.
X-ray photoelectron spectroscopy (XPS) data were collected at room temperature in an ultra high vacuum (UHV) analysis chamber with the base pressure at <5 × 10⁻⁹ mbar. The spectrometer was equipped with a monochromated Al Kα X-ray source, the energy of which was calibrated and maintained at 1486.6 ± 0.2 eV. The micro-focused X-ray source illuminated a spot of approximately 400 × 600 μm2 on the substrate with spatially uniform charge neutralization provided by beams of low-energy (≤10 eV) electrons and Ar+ ions. High-resolution spectra were acquired in the Ta 4f, C 1s, and O 1s regions at a pass energy of 20 eV with 0.05 eV step size at three separate spots on each pellet face. XPS spectra were fitted with UNIFIT (ver. 2011; Universität Leipzig, Leipzig, Germany), using a combination of Lorentzian and Gaussian line shapes to fit the individual components. Backgrounds were modeled as part of the iterative fitting process using a linear combination of Shirley and linear functions. Elemental compositions were quantified using calibrated analyzer transmission functions, Scofield sensitivity factors, Reference Scofield30 and effective attenuation lengths (EALs) Reference Jablonski and Powell31,Reference Tanuma, Powell and Penn32 for photoelectrons; EALs were calculated using the standard TPP-2M formalism.
Temperature-dependent resistance measurements were performed using a Quantum Design Physical Property Measurement System (Quantum Design, Inc., San Diego, California) equipped with the AC transport option. The resistance data were collected from T = 300 to 5 K in an H = 0 Oe magnetic field using a standard four-wire technique with an excitation current of 1 mA and frequency of 17 Hz. The resistivity value was estimated assuming that the sample was homogeneous and dense. Field-cooled and zero field–cooled magnetization data were obtained in a 10 Oe field using a Quantum Design Magnetic Property Measurement System SQUID magnetometer (Quantum Design, Inc., San Diego, California) for temperatures down to 1.75 K. The sheet resistance measurement of the TaC-containing pellet was performed using a Signatone Pro4 four-point probe instrument (Signatone Corporation, Gilroy, California) that uses the Dual configuration method of ASTM Standard F84-99.
The Vickers hardness test was performed by indenting the TaC composite with a diamond indenter. A Vickers tip at 500 gm of load, and a dwell time of 15 s was used. 10 indents were obtained for the tested sample. Vickers hardness was the quotient which was obtained by dividing the kgf load by the square mm area of indentation. Nanoindentation measurements were obtained using an Anton Paar nanoindentation tester (NHT2; Anton Paar, Ashton, Virginia) with a Berkovich indenter.
III. RESULTS AND DISCUSSION
A. Thermal reaction evaluations
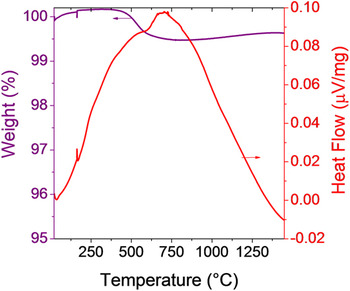
The organometallic interactions up to 400 °C between TPEB and Ta powder were analyzed by a DSC study [Figs. 1(b) and 1(c)]. The DSC thermograms of the pellets containing only TPEB or a physical blend of TPEB and Ta, at the same ratio as in the pellet, were compared for temperature cycling up to 400 °C. In the DSC thermogram of TPEB, the transitions corresponding to the melting of the material and the polymerization of the acetylenic groups were observed at 195 °C and 290 °C, respectively, as previously reported. Reference Jones and Keller33 In the case of the TPEB:Ta blend, though reasonably similar transitions were observed, the appearance of new exothermic transitions above 350 °C indicated the interaction of the Ta atoms with acetylenic groups in the polymerized TPEB, further facilitating the completion of polymerization. Accordingly, though the TGA-DTA thermogram of the thermal treatment of the pellet up to 1500 °C in argon (Fig. 2) showed a weight loss of ∼0.8%, between 475 and 675 °C, no weight loss was observed in the temperature region where the polymerization of the TPEB is known to occur, i.e., between 275 and 475 °C. The loss of hydrogen (∼0.3 wt% of the total weight) and some carbon atoms (constituting the remaining ∼0.5 wt% weight loss) from TPEB likely account for the weight loss, which overlaps with the initial temperature range where the breakdown of the cross-linked carbon network to elemental carbon is known to occur (between 480 and 620 °C). Reference Jones and Keller33 Furthermore, the lack of labile alkyl groups in both TPEB and Ta powder obviates the production of methane or larger hydrocarbon by-products during the thermal transformation. The reaction between Ta and the evolving carbon condensate, which is initiated by the diffusion of carbon atoms into the lattice of Ta nanoparticles, commences subsequently in this temperature range.
TGA-DTA thermograms during the thermal treatment of the Ta and TPEB-containing pellet.

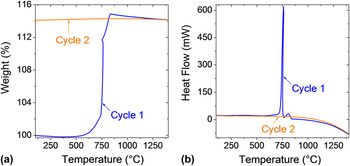
The oxidative stability of the pellet was determined by thermally treating it in air to 1400 °C and measuring its mass changes (Fig. 3). During the initial run, the sample started gaining mass at 550 °C and gained up to 15 wt% mass by 830 °C. The pellet did not exhibit any mass uptake at higher temperatures. In fact, there was about 1 wt% loss from this temperature up to 1400 °C, assumed to be of residual carbon being freed on formation of a voluminous Ta2O5 product, thereby resulting in a final weight that was 14% greater than the initial weight [Fig. 3(a)]. The DTA analysis of the initial oxidative run showed that there was an intense exotherm at 760 °C with an associated heat flow of 25.88 W/g [Fig. 3(b)]. This exotherm is attributed to the oxidation of TaC to Ta2O5, as previous studies have reported that the complete oxidation of TaC to Ta2O5 occurs between 750 and 850 °C. Reference Desmaison-Brut, Alexandre and Desmaison34,Reference Lashtabeg, Smart, Riley, Gillen and Drennan35 During this step, the initial gray-black colored solid pellet is converted to a voluminous white powder, the XRD spectrum of which was verified to be that of Ta2O5 (vide infra). A smaller exotherm observed at 807 °C, with an associated heat flow of 1.303 W/g, is attributed to the oxidation of a small percentage of the tantalum hemicarbide, Ta2C, phase. Although Ta2C was likely to have formed during the initial synthesis step, its minor phase prevalence, fine dispersion in the pellet, and long-range ordering likely precluded it from producing strong X-ray scattering during material analysis. It is well known that Ta2C has greater oxidative resistance Reference Desmaison-Brut, Alexandre and Desmaison34 than that of TaC and, hence, it is reasonable to have oxidized at 807 °C versus the lower oxidation temperature of TaC, i.e., 760 °C. The relative intensities of the two exotherms also suggested that the observed Ta2C component constituted approximately 5 wt% of the pellet. Furthermore, once the pellet is oxidized to Ta2O5, an oxidative rerun to 1400 °C does not alter the nature of the final product [orange curves in Figs. 3(a) and 3(b)].
TGA-DTA thermograms during thermo-oxidative treatment of the Ta and TPEB-containing pellet displaying weight changes in (a) first run (blue) and second run (orange) and heat flow in (b) first run (orange) and second run (blue).

B. Structure and phase analysis
The XRD analysis of the tantalum carbide-containing pellet was performed to determine the specific phase makeup of the refractory carbide. Tantalum carbide has two well-known phases: cubic
 $\left( {Fm\bar 3m} \right)$
and hexagonal
 $\left( {P\bar 3m1} \right)$
.
Reference Rudy, Benesovsky and Toth36,Reference Lomberg37
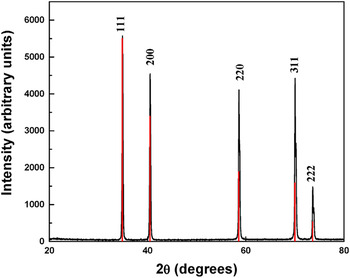
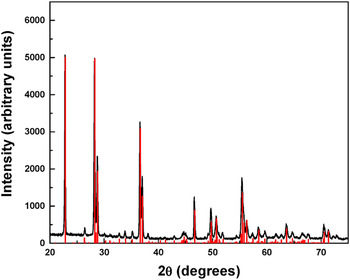
Fig. 4 shows the diffractions of the tantalum carbide-containing pellet sample. All the peaks have been identified as those coming from cubic TaC. The diffraction pattern was analyzed using whole profile Rietveld analysis. The reliability R factor was about 27%, a slightly large value that is attributed to some degree of preferred orientation. The crystallite size for the TaC phase was determined to be 55.2 ± 12.6 nm based on the Halder–Wagner analysis of the observed peaks after correcting for instrumental broadening in their FWHMs. The lattice parameters are a = b = c = 4.45385 Å and Alpha = Beta = Gamma = 90.000°. There was no indication of any significant presence of Ta2O5 in the pellet. The ∼25 nm range in the size of TaC crystallites indicated a broad distribution in TaC crystallites’ sizes within the TaC grains. In turn, the TaC grains had a size range of 0.1–5 μm as evident from their SEM images (vide infra).
XRD spectrum of the tantalum carbide-containing pellet analyzed for the tantalum carbide phases.

The XRD spectrum of the oxidized sample was also obtained and the diffraction pattern, as with TaC, was analyzed using whole-profile Rietveld analysis (Fig. 5). The phase of the tantalum oxide product was observed to be that of the Pmm2 phase of Ta2O5. The reliability R factor is 18.02%. The lattice parameters are a = 43.95872 Å; b = 3.88919 Å; c = 6.19450 Å, and Alpha = Beta = Gamma = 90.000°. The crystallite size for the Ta2O5 phase was determined to be 52 ± 0.42 nm based on the Halder–Wagner analysis of the observed peaks after correcting for instrumental broadening in their FWHMs.
XRD spectrum of the oxide product obtained by thermo-oxidative treatment of the pellet in air to 1400 °C.

C. Microstructure and morphology characterization
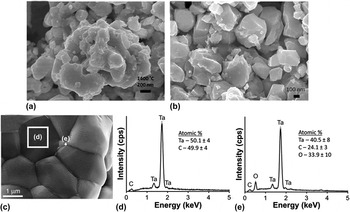
SEM images of the outer surface of the sample are shown in Fig. 6. The sample shows irregularly shaped particles, some of which have rough edges [Fig. 6(a)] with the aggregation of grains as large as several hundred nanometers in size. Figure 6(b) shows another area of the 1400 °C sample that exhibits much smoother edges. Figure 6(c) focusses on a single grain and its associated grain boundaries. Representative energy dispersive spectroscopy (EDS) spectra are shown of the grain, Fig. 6(d), and grain-boundary regions, Fig. 6(e). Reported atomic percentages (mean ±95% C.I.) are the average of three separate EDS spectra for a given region of interest. The Ta:C at.% ratio of the grain clearly suggested that it contained the TaC phase. Oxygen was detected at the grain boundary, suggesting the presence of Ta2O5. However, we note the at.% of oxygen in a large-area scan of the pellet cross-section was <1% (see Supplementary Material Fig. S1). Furthermore, Ta2O5 was not evident in the XRD spectrum of the pellet (vide supra), indicating there was only a minor presence of this phase which likely originates from oxidation post processing.
(a) The SEM micrographs of the surface structure of the TaC-containing pellet. (b) Enlarged image of the pellet showing smoother edges. (c) SEM image showing a (d) grain, and (e) grain boundary and their representative EDS spectra.

D. Density
The density (ρ) analysis of the TaC-containing pellet relied on the Archimedean principle and compared the weight of the dry pellet (M d) against its apparent weight (M s), once it was fully submerged in water (deionized H2O, 22.0 °C temperature of water and surrounding air). The specific gravity derivation, which relied on the Archimedean principle, used the following equation Reference Khonakdar, Morshedian, Wagenknecht and Jafari38,Reference Munro39 :
 $$\rho = {{{M_{\rm{d}}} \cdot 0.9968\;{{\rm{g}} \mathord{\left/ {\vphantom {{\rm{g}} {{\rm{c}}{{\rm{m}}^{\rm{3}}}}}} \right. \kern-\nulldelimiterspace} {{\rm{c}}{{\rm{m}}^{\rm{3}}}}}} \over {\left[ {{M_{\rm{d}}} - {M_{\rm{s}}}} \right]}} + 0.0012\;{{\rm{g}} \mathord{\left/ {\vphantom {{\rm{g}} {{\rm{c}}{{\rm{m}}^{\rm{3}}}}}} \right. \kern-\nulldelimiterspace} {{\rm{c}}{{\rm{m}}^{\rm{3}}}}}\quad .$$
The calculated result assumed a theoretical maximum density (TMD), 14.6 g/cm3, for TaC that was derived from the literature and also assumed a nonporous, monocrystalline NaCl structure. Reference Hagihara, Fushiki and Nakano40 The porosity of the sample (φ) was derived using the following equation:
 $$\varphi = 1 - {{{p_{{\rm{sample}}}}} \over {{p_{{\rm{TMD}}}}}}\quad .$$
Thus, the composite was found to have a density of 74.49%. The estimated porosity was determined to be about 34.25%. This is not surprising considering the fact that the shaped-TaC composites were formed at atmospheric pressure and under no applied mechanical load. In comparison, typical industrial cold pressing Reference Toth2 of ceramic components yield densities of ∼60% and further densification with alternative means such as pressureless sintering and cold isostatic pressing, other than HIP, typically yield densities of ∼85+%. Reference Toth2
E. Vickers hardness and nanoindentation measurements
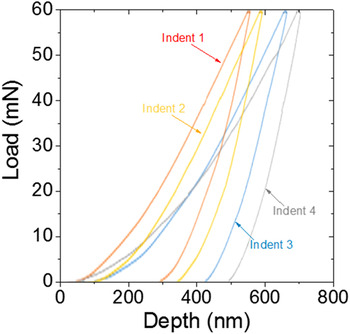
The Vickers hardness measurement of the TaC composite was performed at five different sites on the pellet, with 500 g load being applied for 15 s at each of the spots, and provided values between 125 and 160 Vickers units (i.e., between 1.23 and 1.57 GPa) for an average of ∼143 Vickers units (i.e., 1.40 GPa). This contrasts with the reported Vickers hardness of 1600 Vickers units (i.e., 15.7 GPa) for fully densified TaC ceramics. Reference Toth2 The obtained low value of Vickers hardness is not surprising, considering the 33.45% porosity of the material. The material should, therefore, be considered as a particle-based composite rather than as a quasi-densified ceramic. In contrast, nanoindentation studies revealed that the TaC nanoparticles exhibited local hardness nearly equal to that of the densified TaC ceramic with values ranging between 7 and 15 GPa (Fig. 7). Reference Toth2 Thus, the ∼55.2 (±12.6) nm sized TaC nanoparticles, by themselves, are nearly as densified as the TMD product. However, upon assembly of these rigid particles, to form the ceramic composite, the hardness value of the composite reduces to almost one 10th of the hardness value of the individual particles.
Nanoindentation curves of the TaC-containing pellet as a function of the depth of indentation.

F. Superconducting properties
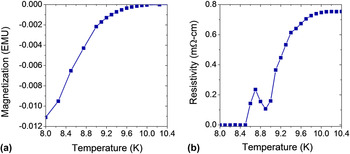
The transition of the TaC pellet into the superconducting state was revealed via temperature-dependent magnetization measurements and was found to occur at temperature of T c ∼ 10 K, as determined from the onset of diamagnetism [Fig. 8(a)]. This value is near the T c for bulk TaC (T c = 10.35 K) Reference Meissner and Franz8 ; however, determining T c from magnetization data alone can be unreliable because sample-shape dependent flux pinning may affect the temperature dependence of the superconducting transition. Therefore, electrical transport measurements were performed to verify the value of T c. The resistivity versus temperature data shown in Fig. 8(b) reveal an onset of superconductivity T c ∼ 10.1 K, quite similar to that obtained from the magnetization experiment. However, a second peak of unknown origin is also observed at T c ∼ 8.7 K that cannot be attributed to the ∼5 wt% fraction of Ta2C nanoparticles since previous studies have established Ta2C to be nonsuperconducting. Reference Giorgi, Szklarz, Storms, Bowman and Matthias41–Reference Giorgi, Szklarz, Storms and Bowman43
(a) Zero field-cooled magnetization versus temperature and (b) resistivity versus temperature of the TaC-nanoparticle comprising pellet.

The sheet resistance of the sample was also measured by a four-point probe instrument following the Dual configuration method of the ASTM standard F84-99. This method compensates for errors in probe spacing and other errors caused by proximity to the edge of the conducting layer. The sheet resistance of the sample was found to be between 0.03 and 0.05 ohm per square, suggesting that the sample was extremely conducting. Therefore, the TaC nanoparticles possessed sufficient interparticle contacts to exceed the percolation threshold, which should also have benefited the above discussed superconducting behavior of the sample.
IV. CONCLUSIONS
The ambient pressure and low temperature production of the nanoparticles of TaC from the organometallic transformations of TPEB and Ta metal is a convenient route to produce such nanoparticle-containing shaped ceramic nanocomposite samples. While its hardness is lower than that of the fully densified TaC ceramic, this shaped composite can be used as a precursor material to form the densified ceramic upon further treatment. Importantly, this provides an opportunity to study the relationship between the initial TaC nanoparticle size and the final product density as a function of the processing parameters such as pressure and temperature. Future research efforts, which would significantly enhance the ceramic science area, should devise methods based on this material to produce densified products without further grain growth.
Along such lines, preliminary results in our lab have demonstrated that the particle size of the produced TaC nanoparticles can be controlled by manipulation of the final temperature of thermal treatment. For example, we are able to obtain four sets of TaC nanoparticles in the size range of 25–50 nm by varying the final thermal treatment temperature from 1200 to 1500 °C in increments of 100 °C, with the smallest sized TaC nanoparticles being formed at the lowest temperature, i.e., 1200 °C. Interestingly, Vickers hardness measurements of these ceramic nanocomposites demonstrated the Hall–Petch effect (i.e., the hardness varied from 2.51 to 1.23 GPa within the size range 25–50 nm), which is quite unusual as Hall–Petch effect is observed, and is typically known to be in operation, generally in completely densified ceramic samples. These TaC nanoparticle-containing composites also demonstrated a reduction in the superconducting-transition temperature as a function of the particle size, i.e., the T c reduced from 10.5 to 9.5 K as the TaC particle size reduced from 50 to 25 nm.
Finally, we would like to suggest that the produced material could also be used as is in composite applications Reference Nieto, Kumar, Lahiri, Zhang, Seal and Agarwal44–Reference Vilcalova, Saha, Hausnerova and Quadrat46 that require such architectures and also in catalytic applications. Reference Zhu, Sakaushi, Clavel, Shalom, Antonietti and Fellinger47–Reference Ishihara, Tamura, Ohgi, Matsumoto, Matsuzawa, Mitsushima, Imai and Ota49 One could also envision converting this material into nanostructured porous solids via selective chemical etching Reference Presser, Heon and Gogotsi50 to produce materials for catalytic supports, Reference Zhu, Sakaushi, Clavel, Shalom, Antonietti and Fellinger47–Reference Ishihara, Tamura, Ohgi, Matsumoto, Matsuzawa, Mitsushima, Imai and Ota49 gas separation, Reference Amanipour, Babkhani, Towfighi and Zamaniyan51–Reference Meng, Zou, Guo, Ma, Zhao and Zhu53 and energy storage Reference He and Tao54–Reference Rees, Essaki, Brady and Burstein56 applications, wherein periodic porosity is a requirement.
Supplementary Material
To view supplementary material for this article, please visit https://doi.org/10.1557/jmr.2017.257.
ACKNOWLEDGMENTS
The authors wish to acknowledge the financial support of the Office of Naval Research through the Naval Research Laboratory’s basic research program. The authors also thank Dr. Andrew Purdy of Chemistry Division, Naval Research Laboratory, DC, for assistance with the sheet resistance measurements.