Introduction
Soil erosion and other forms of soil degradation are major problems facing agriculture today. Soils are not renewable over a human timescale. Most arable soils are prone to degradation, mainly caused by soil mismanagement. The degradation processes are more dependent on ‘how’ rather than on ‘what’ crops are grownReference Lal1, highlighting the importance of sustainable soil and crop management.
No-tillage (NT) and reduced tillage (RT) systems are well-known management tools for preventing soil erosion and conserving soil fertilityReference Pekrun and Claupein2. A positive effect on soil organic carbon (Corg) contents in the superficial soil layer has frequently been reportedReference Pekrun and Claupein2–Reference Koch and Stockfisch7, whereas the effects on Corg in the whole profile are still a matter of controversyReference Baker, Ochsner, Venterea and Griffis8. NT and RT cause a stratification of Corg and microbial properties in the soil profileReference Kay and VandenBygaart3, Reference Kladivko6, Reference Kandeler, Tscherko and Spiegel9, Reference Peigné, Ball, Roger-Estrade and David10. The intensity of tillage operations in RT and the amount and management of above-ground crop residues affect the degree of stratification. Total N, organic N, mineralizable N, P and K usually follow the same pattern with a concentration in the surface layer and no change or decrease belowReference Peigné, Ball, Roger-Estrade and David10.
Organic farming practices are reported to have a positive impact on air, soil, ground and surface water and biodiversity11. Multiple cropping systems, crop rotation, cover crops, organic fertilizers and minimum tillage can add organic matter to the soil and increase its capacity to circulate nutrients, air and water11. Crop production in organic farming relies and depends on nutrient transformation processes in the soilReference Fließbach, Oberholzer, Gunst and Mäder12. Soil quality is thus an important factor in organic farming and Corg is a lynchpin in this system. Corg in the topsoil is driven by interacting influences of climate, topography, soil type and aspects of crop management such as fertilization, tillage and crop rotationReference Peigné, Ball, Roger-Estrade and David10. Conversion of natural land to crop production and tillage generally leads to a loss of CorgReference Scheffer and Schachtschabel13.
Corg was reported to remain constant in an organic farming system including ley-based crop rotations and application of organic fertilizers, while it decreased under conventional farming with mineral fertilizationReference Fließbach, Oberholzer, Gunst and Mäder12. Munro et al.Reference Munro, Cook and Lee14 found organically managed topsoils to contain a higher percentage of organic matter, total N and available P when compared with their conventionally managed counterparts at 14 paired sites in England. Drinkwater et al.Reference Drinkwater, Wagoner and Sarrantonio15 argue that the higher quality of added organic matter in organic farming leads to an accumulation of Corg. Microbial communities are key regulators of soil organic matter dynamics and nutrient availabilityReference Six, Frey, Thiet and Batten16. Soil microbial biomass and activity, both indicators of biological soil fertility, are enhanced by organic farmingReference Fließbach, Oberholzer, Gunst and Mäder12, Reference Six, Frey, Thiet and Batten16. To ensure both short-term productivity and long-term sustainability, achieving a balance between inputs and outputs of nutrients is critical, especially as the use of imported materials to build soil fertility is restricted under organic farmingReference Watson, Bengtsson, Ebbesvik, Løes, Myrbeck, Salomon, Schroder and Stockdale17. Suitable crop rotations containing legumes produce surpluses in the N budgets of organic farms. P and K budgets show both surpluses and deficits, depending on the farm type and the import of nutrientsReference Watson, Bengtsson, Ebbesvik, Løes, Myrbeck, Salomon, Schroder and Stockdale17, Reference Berry, Stockdale, Sylvester-Bradley, Philipps, Smith, Lord, Watson and Fortune18.
The International Federation of Organic Agriculture Movements19 recommends that organic farmers ‘take measures to prevent erosion, compaction, salinisation and other forms of soil degradation’. Loss of topsoil should be minimized ‘through minimal tillage, contour ploughing, crop selection, maintenance of soil plant cover and other management practices that conserve soil’.
Although conservation tillage (NT and RT) may improve the environmental and economic performance of organic farming, it is still not very common among organic farmersReference Peigné, Ball, Roger-Estrade and David10. There are major concerns about the adoption of conservation tillage. Increased weed pressure under conservation tillage as a result of mechanical weed control techniques not adapted to high levels of crop residues on the surface would appear to be the main problem. Topsoil compaction, especially during the first years of transition and with limited availability of N mainly at the beginning of the growing season, also impedes conversion to conservation tillage. Well-drained clays, stable loams and calcareous soils combined with moderate precipitation are favorable conditions for conservation tillage under organic farming conditions. Suitable crop rotations with a high weed-suppressing capacity include a ley phase, cover crops and intercroppingReference Peigné, Ball, Roger-Estrade and David10.
The incorporation of the ley is a critical point under RTReference Peigné, Ball, Roger-Estrade and David10, Reference Kainz, Gerl, Lemnitzer, Bauchenss, Hülsbergen, Hess and Rahmann20. Only a few experiments have investigated RT under organic farming conditions. Severe weed competitionReference Kainz, Gerl, Lemnitzer, Bauchenss, Hülsbergen, Hess and Rahmann20–Reference Pekrun, Schneider, Wüst, Jauss, Claupein and Freyer22 and technical difficulties while incorporating grass–clover sodsReference Kainz, Gerl, Lemnitzer, Bauchenss, Hülsbergen, Hess and Rahmann20 led to the conclusion that an occasional use of the moldboard plough is inevitable to overcome weed pressure under RT in organic farmingReference Hampl23. Schulz et al.Reference Schulz, Brock and Leithold24 consistently found similar yields in CT and RT, when at least shallow turning of the soil was carried out. The stratification of Corg, soil nutrients and microbial properties with RT in organic or conventional farming systems all developed in a similar way. Under organic farming, RT changed the allocation of Corg within the topsoil but did not enhance Corg over the whole investigated soil profileReference Schulz, Brock and Leithold24. EmmerlingReference Emmerling25 reported an increase in Corg in the 0–25 cm soil depth where Corg was enhanced in the upper layer (0–15 cm) and decreased in the layer below (15–25 cm). Microbial biomass and microbial activity in these soils were stratified under RT; there was an overall increase in microbial properties but the content of plant-available P in the investigated soil layer did not changeReference Emmerling25.
Conservation tillage (NT and RT) in organic farming has not yet been successfully adapted and further research into the adaptation of conservation tillage to different soils and climatic conditions, the development of suitable crop rotations and management practices to promote weed control and new strategies to remove and incorporate leys in a conservation tillage system are requiredReference Peigné, Ball, Roger-Estrade and David10. The influence of different fertilization strategies in organic farming systems with and without livestock on N-mineralization and thus on reduced N supply under conservation tillage is not yet clearly understood.
In the present experiment the implementation of RT in an organic farming system with livestock was studied. Two fertilization strategies, the effects of biodynamic preparations and their interactions with soil tillage were investigated. Results of the conversion period from CT to RT showed an increase in Corg, microbial biomass and microbial activity in the superficial soil layer over the first 3 years. In the first experimental period, average yields of cereals and sunflowers under RT were 93% of those obtained under CTReference Berner, Hildermann, Fliessbach, Pfiffner, Niggli and Mäder26. After conversion, yields of fodder crops such as grass–clover and silage maize were 29% higher under RT, despite a considerably higher weed infestation of silage maize under RTReference Krauss, Berner, Burger, Wiemken, Niggli and Mäder27, directing the focus on soil fertility. This paper presents the effects of tillage, organic fertilization strategies and biodynamic preparations on soil fertility indicators such as Corg, microbial biomass, microbial activity, soil nutrients and nutrient budgets after the first 6-year crop rotation period of a long-term experiment on a clayey soil in a temperate climate.
Material and Methods
Field experiment
In autumn 2002, a field experiment was conducted at Frick, Switzerland (47°30′N, 8°01′E) involving factors such as tillage, fertilization and biodynamic preparations. A detailed description of the experiment is given by Berner et al.Reference Berner, Hildermann, Fliessbach, Pfiffner, Niggli and Mäder26.
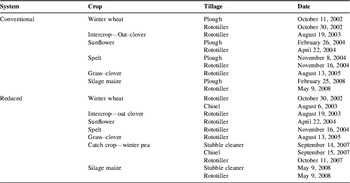
CT uses a moldboard plough operating at 15 cm depth. A chisel plough (15 cm) was used in the RT system and grass–clover in the RT system was superficially incorporated with a stubble cleaner running at 5 cm depth. Seedbed preparation was performed by a rotary harrow in both tillage systems (Table 1).
Dates of soil tillage in the different tillage systems.

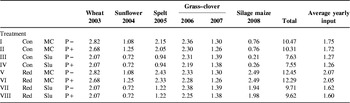
Inputs of organic matter (Table 2) were higher in the manure compost than in the slurry system due to the use of straw for animal bedding. The experimental farm where the experiment is performed operates at a stocking density of 1.8 livestock units (LU) ha−1 consisting mainly of cattle. The farm has 19 ha of grassland and pastures and 13 ha of arable land. Mainly fodder crops are grown and additional fodder for swine breeding is purchased. Fertilization was planned at a stocking density of 1.4 LU ha−1. Differences in fertilization levels of N, P and K were due to different proportions of excreted elements in solid and liquid organic manure types in the stable system and to N losses during manure storage. We aimed at achieving identical fertilization levels for P and thus accepted differences for N and K. Consequently, plots with slurry fertilization received N, P and K at levels of 1.13, 1.41 and 1.17 LU ha−1, respectively. Fertilization with the manure compost treatment was carried out at levels corresponding to 1.18, 1.53 and 1.09 LU ha−1 for N, P and K, respectively (see Table 7 for average yearly inputs).
Organic matter (OM) input (manure, slurry and green manure) in the first crop rotation period (2003–2008) (t OM ha−1).

Silage maize 2008, RT including pea green manure; OM, organic matter.
Con, CT; Red, RT; MC, manure compost; Slu, slurry; P−, without preparations; P+, with preparations.
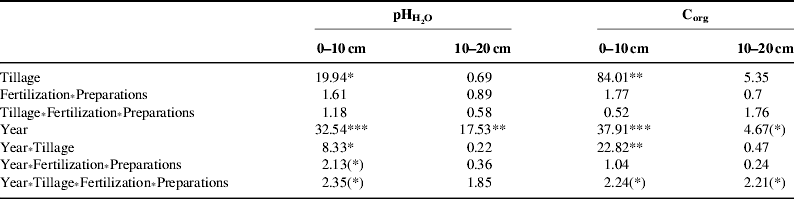
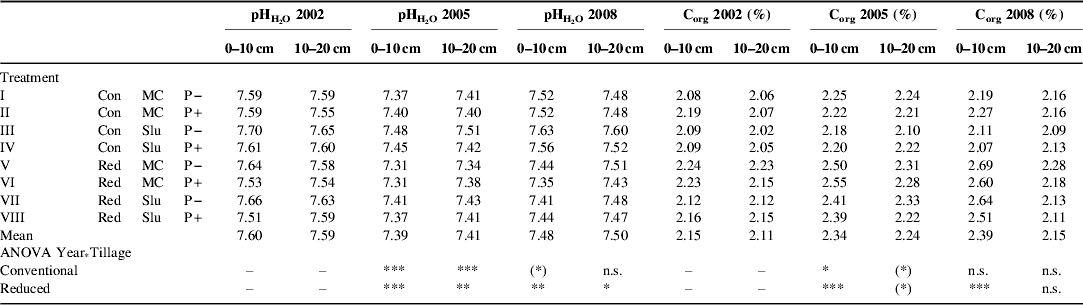
F-values and significance levels of the mixed-model with repeated measures in 2002, 2005 and 2008 for pHH2O and soil organic carbon (Corg).
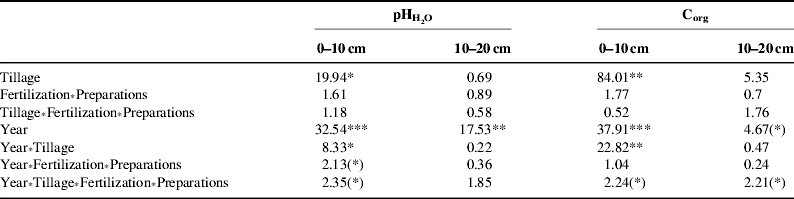
(*) P<0.1; *P<0.05; **P<0.01; ***P<0.001.
The biodynamic preparations (P) consisted of the following: P 500, cow-manure fermented in a cow horn; P 501, silica stored in a cow horn. These were applied at rates of 250 and 4 g ha−1, respectively and sprayed three times per season on the relevant plots. Composting additives in the biodynamic treatment were yarrow flowers (P 502, Achillea millefolium L.), camomile flowers (P 503, Matricaria recutita, L.), stinging nettle (P 504, Urtica dioica, L.), oak bark (P 505, Quercus robur, L.), dandelion flowers (P 506, Taraxacum officinale, Wiggers) and valerian flowers (P 507, Valeriana officinalis, L.); these were added at the start of manure composting or slurry storageReference Zaller and Köpke28, Reference Carpenter-Boggs, Kennedy and Reganold29. In total, 10 g preparations were added to about 2 t of composted raw material and 10 g preparations were also added to the slurry volume of 20 m3 with the biodynamic preparations.
The three factors—tillage, fertilization and preparations—were fully factorized. This resulted in eight treatments, each replicated four times. The 32 plots were arranged in a strip-plot design. The plot size was 12 m×12 m, allowing the use of regular-sized farming equipment. Soil samples were taken and yields were measured in an inner 8 m×8 m parcel.
Site conditions
The soil type at the experimental site was a Stagnic Eutric Cambisol with 45% clay content [coefficient of variance (cv) 15%] and a pHH2O of 7.1 (cv 4%). It was enriched in ammonia acetate-EDTA extractable P and K due to extensive application of manure from livestock (swine) in pre-study conventional management.
Before the experiment started, the field was under conventional management and had been managed organically for 7 years in accordance with the European Union Regulation (EEC) No. 834/2007. The ploughing depth was 22 cm under conventional farming and 15 cm under organic farming prior to the start of the experiment. Corg in the ploughed soil depth was therefore distributed relatively homogeneously.
The mean annual precipitation at the site was 1000 mm. In rainy periods the soil can be waterlogged for some days. The mean annual temperature was 8.9°C.
Crops
A ley-based rotation was established from 2003 to 2008 (Table 1). Cereal and sunflower grains, cereal straw, the oat–clover intercrop, grass–clover and silage maize were removed from the field. In the RT system only a winter pea catch crop was established before silage maize and incorporated in spring.
Cereal yields were 11% lower under RT compared to CT, whereas sunflower yields were increased by 5% under RTReference Berner, Hildermann, Fliessbach, Pfiffner, Niggli and Mäder26. Yields of grass–clover and silage maize were enhanced by 26 and 34%, respectively in RT plotsReference Krauss, Berner, Burger, Wiemken, Niggli and Mäder27.
Soil sampling
Soil samples were taken at the beginning of the experiment on October 1, 2002 (after harvest of silage maize), on March 15, 2005 (standing crop: spelt) and on September 25, 2008 (after harvest of silage maize) in all 32 experimental plots. Twelve individual cores (diameter 3 cm) per field plot were separated into 0–10 cm and 10–20 cm soil depth layers and thereafter bulked to one composite sample per plot and layer. Soils were then sieved through a 5-mm mesh and kept at 3°C until they were analyzed.
Chemical soil analysis
Measurement of pH and Corg
The pH of dried samples (60°C, 24 h) was measured in a soil suspension with deionized water (1:10, w/v). Corg was measured after wet oxidation of 1 g of dry soil in 20 ml concentrated H2SO4 and 25 ml 2 M K2Cr2O7 in accordance with Swiss standard protocols30.
Measurement of soil nutrient contents
Soluble nutrients P and K were extracted with CO2-saturated water (PCO2, KCO2) according to Swiss standard protocols30. The plant-available exchangeable fraction of P (PAac−EDTA) was extracted with ammonium acetate-EDTA. Phosphate in the extract was measured after complex formation with added ammonium molybdate in a spectrophotometer at 750 nm. Available K in the ammonium acetate-EDTA extract (KAac−EDTA) was measured by atom absorption spectrometry at 766.5 nm30.
Soil microbial analyses
All soil microbial analyses were carried out on moist soil samples adjusted to a water content corresponding to 40–50% of maximum water retention capacity.
Chloroform fumigation extraction (CFE)
Soil microbial biomass C (Cmic) and N (Nmic) were estimated by CFE in accordance with Vance et al.Reference Vance, Brookes and Jenkinson31. CFE was done in triplicate on 20 g (dry matter) subsamples that were extracted with 80 ml of a 0.5 M K2SO4 solution. Total organic C (TOC) in soil extracts was determined by infrared spectrometry after combustion at 850°C (DIMA-TOC 100, Dimatec, 45276 Essen, Germany). Total N was subsequently measured in the same sample by chemoluminescence (TNb, Dimatec, 45276 Essen, Germany). Soil microbial biomass was then calculated according to the formula: Cmic=EC/k EC, where EC=(TOC in fumigated samples−TOC in control samples) and k EC=0.45Reference Joergensen and Mueller32. Nmic=EN/k EN, where EN=(total N extracted from fumigated samples−total N extracted from control samples) and k EN=0.54Reference Joergensen and Mueller33.
Soil DHA
DHA was measured according to TabatabaiReference Tabatabai, Page, Miller and Keeney34 in 5 g of soil samples incubated at 30°C for 24 h in the presence of an alternative electron acceptor [triphenyltetrazolium chloride (TTC)]. The red-colored product [triphenylformazan (TPF)] was extracted with acetone and measured in a spectrophotometer at 546 nm.
Nutrient balances
Nutrient balances for N, P and K were calculated on a field basis. Wheat grains and straw, oat–clover intercrop, sunflower seeds, spelt grains and straw, grass–clover, winter pea and silage maize samples were analyzed for nutrient concentrations. Nitrogen was determined after Kjeldahl digestion. For measuring P and K, samples were incinerated at 600°C and the ash extracted with concentrated hydrochloric acid. N and P concentrations were determined photometrically and K via atom absorption spectrometry. Nutrients (N, P and K) in slurry and manure compost were extracted with hydrochloric acid after the samples had been incinerated at 600°C and were analyzed as specified above. Biological N-fixation by legumes, atmospheric deposition, leaching and gaseous emissions of nutrients were not considered in the balances. The winter pea catch crop contained 62 kg N ha−1 and was exclusively incorporated into the soil of the RT system. Although it was assumed that the whole quantity of catch crop N was not fixed biologically, it was included in the nitrogen budget.
Statistics
The statistical model used involved tillage as the main factor in the strip-plot design and Fertilization∗Preparations as a combined factor. Soil microbial properties and nutrient contents were calculated with a general linear model to test for significance using SPSS 15.0 software (SPSS Inc., Chicago, Illinois, USA, 2006). Linear contrasts were then calculated for fertilization and preparations using SAS 9.1 software (SAS Institute Inc., Cary, North Carolina, USA, 2002–2003). A mixed model in SAS was used to perform a time line analysis for pH and Corg with the fixed factors Tillage, Fertilization∗Preparations and Year (Year as a repeated measure). The Block was used as a random factor. In the result tables, first the means of the eight basic treatments were presented. Second the relative differences between the factors tillage, fertilization and preparation were shown. Third, the significant differences between the three factors and respective interactions were depicted. The levels of probability P<0.05, P<0.01 and P<0.001 were declared significantly different.
Results and Discussion
After the first 6-year crop rotation period of the present experiment, statistical analysis revealed no effects of fertilization and only slight effects of preparations on the investigated properties while the response to tillage was strong, especially in the 0–10 cm soil depth layer. A distinct stratification of Corg, microbial biomass C and N, microbial activity, plant-available P and K was found under RT, while they were distributed relatively homogeneously throughout 0–20 cm under CT.
pH and Corg
A mixed model analysis of variance (ANOVA) with repeated measures in 2002, 2005 and 2008 was used to identify significant changes of pH and Corg over the first crop rotation period. The factors Year in both soil layers and Tillage in the 0–10 cm soil layer showed significant effects. There was no effect of the combined factor Fertilizer∗Preparations. The interaction Year∗Tillage significantly affected pH and Corg in the 0–10 cm soil layer (Table 3).
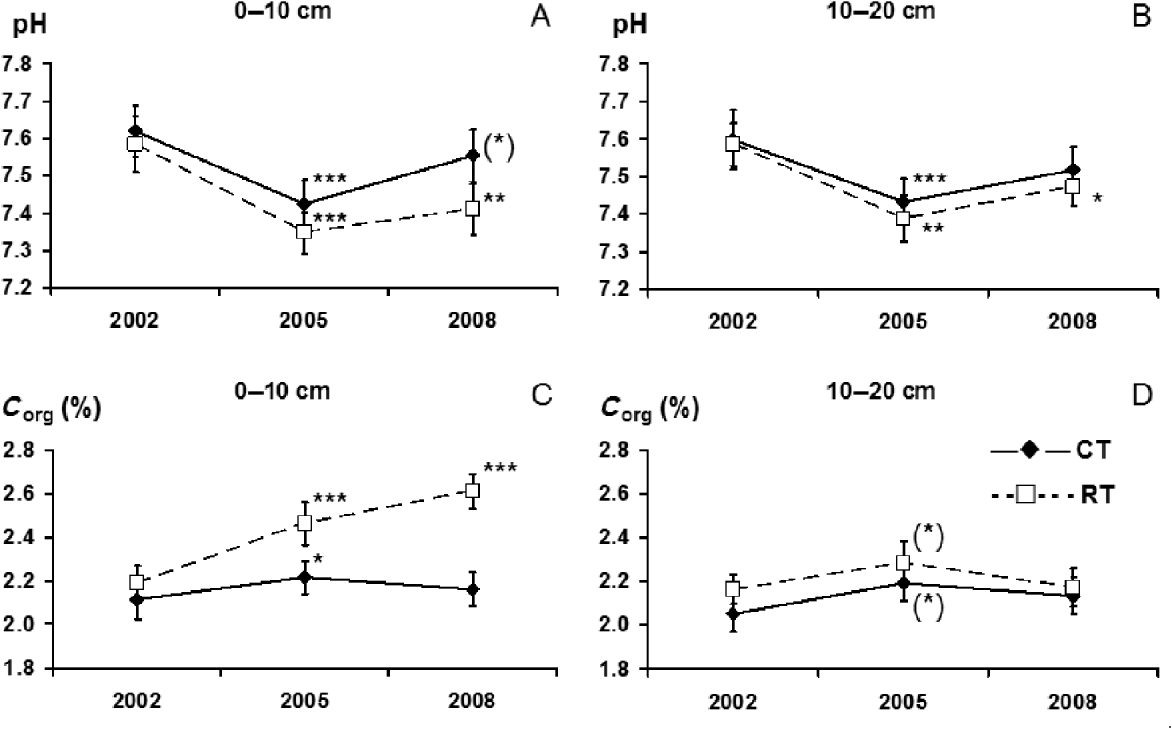
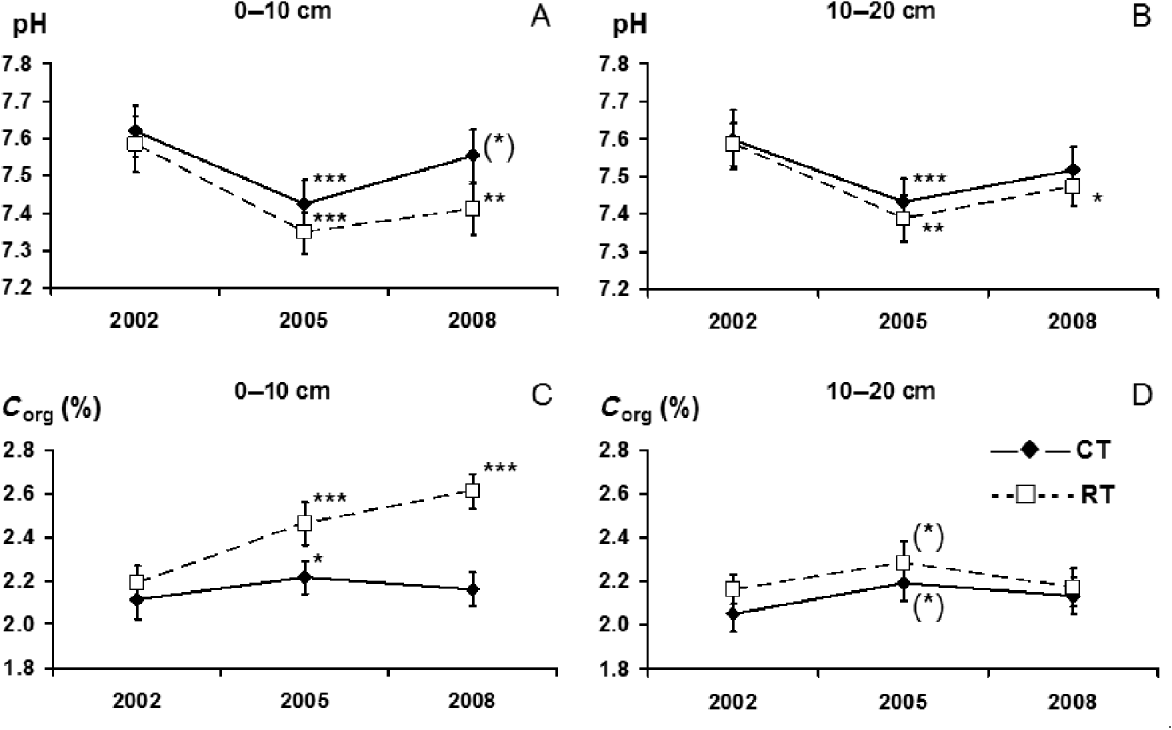
Soil pH deceased significantly from 2002 to 2005 under both tillage treatments and in both soil depths. When compared with the initial values of 2002, pH values in 2008 were significantly lower only under RT (Table 4, Fig. 1). The decrease of pH was highest under RT in 0–10 cm (−0.17, P<0.01).
Means and standard error of the mean of pHH2O and soil organic carbon (Corg) in 0–10 cm and 10–20 cm soil depth for RT and CT in the years 2002, 2005 and 2008. A, B: pH. C, D: soil organic carbon [Corg (%)]. Results of the mixed model t-test for the factor Year∗Tillage, stars indicate significant differences of the means of each treatment in 2005 and 2008 compared with the corresponding mean in 2002. (*) P<0.1, *P<0.05, **P<0.01, ***P<0.001.
Means for pH and soil organic carbon (Corg) in 2002, 2005 and 2008 in soil depth layers 0–10 cm and 10–20 cm. Results of the mixed model t-test for Year∗Tillage, indicating significant differences of the means of each treatment in 2005 and 2008 compared with the corresponding means in 2002.
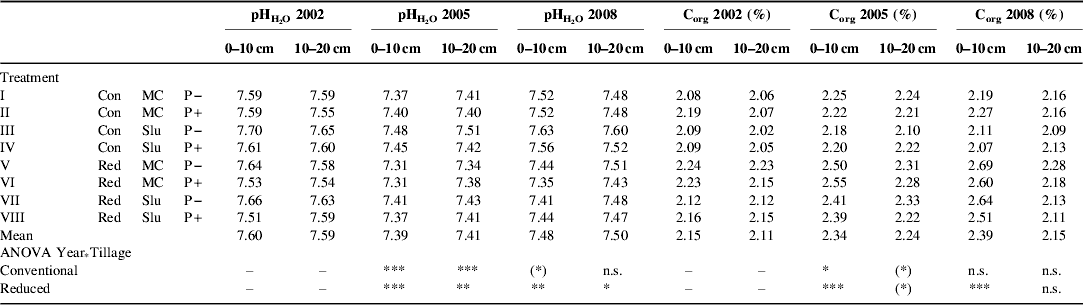
Con, CT; Red, RT; MC, manure compost; Slu, slurry; P−, without preparations; P+, with preparations.
(*) P<0.1; *P<0.05; **P<0.01; ***P<0.001; n.s., not significantly different.
According to RasmussenReference Rasmussen5, soil acidity under RT increases in the long run by 0.2–0.3 units in topsoil, which may be due to an accumulation of organic acids in the superficial layerReference Pronin35. These findings are in agreement with the results of the present experiment. On the other hand, CT may prevent ions from leaching by turning the soil and thus retard acidification of the topsoilReference Friedel, Munch and Fischer36. Seasonal differences causing the lower levels measured in spring 2005 cannot be excluded.
Under RT Corg in the 0–10 cm soil layer in 2008 was 19% higher (P<0.001) than the initial values in 2002. This represents an increase from 2.19% Corg to 2.61% Corg within 6 years. Corg remained constant under CT (Fig. 1). No significant differences were found in the 10–20 cm soil layer and there were no effects of fertilization or preparations.
Corg is considered an important indicator of soil fertility. The increase in Corg in our experiment in the 0–10 cm soil layer under RT measured in 2005Reference Berner, Hildermann, Fliessbach, Pfiffner, Niggli and Mäder26 continued between 2005 and 2008. In a meta-study, Ogle et al.Reference Ogle, Breidt and Paustian37 found Corg increased by 16% in 0–30 cm depth after 20 years of NT in a temperate wet climate. AlvarezReference Alvarez4 found no differences in Corg accumulation between NT and RT. In this meta-study, the amount of Corg integrated over 30 cm soil depth under NT and RT was 14% higher than under CT, if only long-term experiments were taken into account. The increase in Corg took place only in the 0–15 cm soil layer, and no differences were reported below 15 cm, which corresponds to our findings. Our results are in line with those of Pekrun and ClaupeinReference Pekrun and Claupein2, RasmussenReference Rasmussen5, KladivkoReference Kladivko6 and Koch and StockfischReference Koch and Stockfisch7. Under organic farming conditions, EmmerlingReference Emmerling25 reported a relative increase in Corg of 7–10% in the surface layer after 10 years of RT, with no differences below the tilled layer. Other studies found an increase in Corg in the superficial layer but a decrease in the untilled soil layers belowReference Kay and VandenBygaart3, Reference Angers, Bolinder, Carter, Gregorich, Drury, Liang, Voroney, Simard, Donald, Beyaert and Martel39, Reference Angers, N'dayegamiye and Côté40. Insufficient plant material left on the field may be a reason for the failure of RT to enhance Corg. By contrast, input of organic matter via crop rotation and organic fertilizers in the present experiment were high compared to other RT trials (Table 2). This seems to be important, as Baker et al.Reference Baker, Ochsner, Venterea and Griffis8 argue that Corg gains in most cases are based only on near-surface samples (0–30 cm). Changes in Corg disappear when deeper sampling (below 30 cm) is included. Under organic farming conditions, Schulz et al.Reference Schulz, Brock and Leithold24 found no increase in Corg after 12 years of RT but Corg was altered by inducing a ley phase into the crop rotation and with amendment of manure. Many authorsReference Pekrun and Claupein2, Reference Kouwenhoven, Boer and Fortyma41, Reference Drinkwater, Janke and Rossoni-Longnecker42 argue that periodical use of moldboard ploughing may be inevitable in organic farming to control weed problems. However, high losses of Corg have been reported after single-moldboard ploughing in an RT system, proportional to the previous gain under NT or RT in some studiesReference Koch and Stockfisch7, Reference Conant, Easter, Paustian, Swan and Williams43, Reference Pierce, Fortin and Staton44. In other studies, no changes could be observed in Corg after ploughing of NT soilsReference Kettler, Lyon, Doran, Powers and Stroup45–Reference Franzluebbers and Stuedemann47. If periodical intervention is only cultivating or ripping and not ploughing, then most of the previously gained Corg could be prevented from mineralizationReference Conant, Easter, Paustian, Swan and Williams43. Organic fertilizers, especially manure, enhance more stable fractions of CorgReference Christensen48, Reference Wander and Traina49 and thus Corg accumulated under RT in stocked organic farming systems may be more resistant to decomposition after moldboard ploughing than in stockless systems. Peigné et al.Reference Peigné, Ball, Roger-Estrade and David10 think that the combined effect of organic farming and RT could also improve the soil organic matter content and consequently soil nutrient reserves in stockless organic systems and call for further research on this issue.
Soil microbial biomass and activity
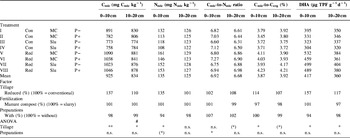
Soil microbial biomass (Cmic, Nmic) and microbial activity (DHA) were highly stratified under RT, whereas they were relatively homogeneously distributed throughout the profile under CT. Soil microbial biomass was greater under RT in the 0–10 cm soil layer, Cmic being 37% (P<0.01) and Nmic 35% (P<0.05) greater than under CT (Table 5). Under RT, Cmic was also greater by 10% (P<0.05) than under CT in the 10–20 cm soil layer, whereas Nmic showed no significant difference between the two tillage treatments.
Means of soil microbial biomass Cmic and Nmic, Cmic-to-Nmic ratio, Cmic-to-Corg (%) and DHA in the soil depth layers 0–10 cm and 10–20 cm in 2008, ANOVA for the main effects Tillage and Fertilization∗Preparations, linear contrasts for fertilization and preparations.

Cmic, soil microbial carbon; Nmic, soil microbial nitrogen; Corg, soil organic carbon; DHA, dehydrogenase activity; TPF, triphenylformazan.
Con, conventional tillage; Red, RT; MC, manure compost; Slu, slurry; P−, without preparations; P+, with preparations.
No statistically significant differences with factor fertilization and no significant interactions between the factors; # ANOVA for Cmic in 10–20 cm depth was calculated with Cmic2-values.
(*) P<0.1; *P<0.05; **P<0.01; ***P<0.001; n.s., not significantly different.
Despite 8% higher average values in the 10–20 cm layer, tillage effects on the Cmic-to-Nmic ratio were not significant. However, a 7% greater Cmic-to-Nmic ratio (P<0.05) was found with the use of biodynamic preparations.
The Cmic-to-Corg ratio, which is considered to be an indicator of biological soil fertilityReference Stockfisch, Forstreuter and Ehlers38, Reference Sparling50, was 14% greater (P<0.05) under RT than under CT in the 0–10 cm soil layer. Microbial activity (DHA) was greater by 57% (P<0.05) under RT compared to CT in the 0–10 cm soil depth. In the 10–20 cm layer, DHA was greater under RT by 17% as compared to CT (P<0.05).
Microbial biomass and activity are considered to be early indicators of changes in soil properties induced by tillage regimesReference Kandeler, Tscherko and Spiegel9. A strong differentiation of the microbial biomass between tilled and untilled layers under RT was found in the present experiment; this corresponds with the results obtained by other authorsReference Kandeler, Tscherko and Spiegel9, Reference Emmerling25, Reference Alvarez, Diaz, Barbero, Santanatoglia and Blotta51, Reference von Lützow, Leifeld, Kainz, Kögel-Knabner and Munch52. While we also found greater microbial biomass C in the 10–20 cm soil layer, others reported no differenceReference Kandeler, Tscherko and Spiegel9 in ATP contentsReference Friedel, Munch and Fischer36 or less microbial biomassReference Emmerling25, Reference Stockfisch, Forstreuter and Ehlers38 in the untilled layer. Microbial biomass is strongly affected by freshly added organic matterReference von Lützow, Leifeld, Kainz, Kögel-Knabner and Munch52. Friedel et al.Reference Friedel, Munch and Fischer36 accordingly found a high dependence of microbial biomass distribution in the soil on the amount of fresh, decomposable organic matter in a tillage experiment. A clear stratification of the microbial biomass depending on the amount of plant residues in different intense silage maize rotation was found by Franzluebbers and BrockReference Franzluebbers and Brock53. The high input of organic matter in the Frick trial (Table 2) combined with the reduction of tillage may be the reason for the high levels of microbial biomass C and N, even in the untilled 10–20 cm soil layer. The application of manure in the present experiment—in contrast to the stockless experiment described by EmmerlingReference Emmerling25, which was also conducted under organic farming conditions with a ley-based crop rotation—may have been a crucial factor in the dynamics of the microbial populations. Heinze et al.Reference Heinze, Raupp and Joergensen54 found enhanced microbial biomass as a result of application of manure.
Diversified crop rotations, reduction of tillage and adoption of organic farming are reported to result in a more fungal-dominated microbial communityReference Six, Frey, Thiet and Batten16. A higher Cmic-to-Nmic ratio in the undisturbed 10–20 cm soil depth layer under RT in our experiment supports these findings as it indicates a higher proportion of fungi and older cells in the total microbial biomass, whereas younger cells and a bacteria-dominated microflora would be reflected in a decrease in the Cmic-to-Nmic ratioReference Joergensen55. Guggenberger et al.Reference Guggenberger, Frey, Six, Paustian and Elliott56 and EmmerlingReference Emmerling25 found an increase in fungi in the upper soil layer under NT and RT. This, however, was not indicated by changes in the Cmic-to-Nmic ratio in 0–10 cm soil depth in our experiment. The regular use of the roto tiller may have prevented the development of fungal biomass in the tilled layer in our experiment. Additionally, in the experiment described by EmmerlingReference Emmerling25, the green fallow and cereal straw were mulched and remained on the field, leaving high amounts of lignin and cellulose as a favorable substrate for the fungal population.
The Cmic-to-Nmic ratio increased in the present experiment with the use of biodynamic preparations in 0–10 cm. In contrast, Fließbach et al.Reference Fließbach, Oberholzer, Gunst and Mäder12 found a lower Cmic-to-Nmic ratio for a treatment with compost and biodynamic preparations compared to a manured conventional system. However, they were unable to say whether this effect was caused by composting or by the biodynamic preparations. Minor effects of biodynamic preparations on soil biology properties were found by Carpenter-Boggs et al.Reference Carpenter-Boggs, Kennedy and Reganold29, when compared with compost without preparations.
The Cmic-to-Corg ratio in 0–10 cm under RT was 14% greater than that under CT. This difference was already apparent after 3 years of our trialReference Berner, Hildermann, Fliessbach, Pfiffner, Niggli and Mäder26 and became smaller than the differentiation by Corg. This confirmed the results obtained by Stockfisch et al.Reference Stockfisch, Forstreuter and Ehlers38, who consider the Cmic-to-Corg ratio to be an early indicator of an enhancement of Corg. Angers et al.Reference Angers, N'dayegamiye and Côté40 found a Cmic-to-Corg ratio three times greater under RT compared to CT in 0–16 cm after 11 years of silage maize rotation and low input of organic matter. An increase in the Cmic-to-Corg ratio of 16% in the superficial layer was also reported by EmmerlingReference Emmerling25.
We measured significantly greater microbial activity (DHA) under RT in both soil layers. EmmerlingReference Emmerling25 found soil respiration and alkaline phosphomonoesterase significantly higher in 0–15 cm under RT but no difference in the soil layer below. Similar results were obtained by von Lützow et al.Reference von Lützow, Leifeld, Kainz, Kögel-Knabner and Munch52 and Kandeler et al.Reference Kandeler, Tscherko and Spiegel9. Von Lützow et al.Reference von Lützow, Leifeld, Kainz, Kögel-Knabner and Munch52 reported higher microbial biomass and activity in clay soils because the conditions for micro-organisms were more stable, although Corg was less accessible to the microbial community.
Phosphorus and potassium
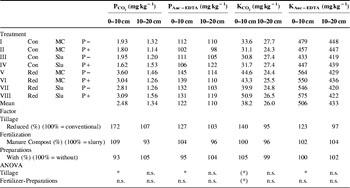
As with Corg, microbial biomass and microbial activity, a clear stratification, especially of soluble PCO2 and KCO2, was found after 6 years under RT. PCO2 in the 0–10 cm soil layer in 2008 was greater by 72% (P<0.05) in RT than in CT plots, while the exchangeable PAac−EDTA was only greater by 27% (P<0.05) (Table 6). KCO2 was greater by 40% (P<0.1) in RT than in CT in the 0–10 cm layer in 2008 and KAac−EDTA was greater by +23% (P<0.05). There were no significant tillage effects in the 10–20 cm soil layer and no effects of fertilization or preparations in both layers.
Means of nutrient contents in the soil depth layers 0–10 cm and 10–20 cm in 2008, ANOVA for the main factors tillage and Fertilization∗Preparations, linear contrasts for fertilization and preparations.

PCO2, CO2-extractable phosphorus; KCO2, CO2-extractable potassium.
PAac−EDTA, ammonium acetate-extractable phosphorus; KAac−EDTA, ammonium acetate-extractable potassium.
Con, CT; Red, RT; MC, manure compost; Slu, slurry; P−, without preparations; P+, with preparations.
No statistically significant differences with factors fertilizer and preparations.
(*) P<0.1; *P<0.05; **P<0.01; ***P<0.001; n.s., not significantly different.
The small differences between the nutrient budgets for P and K in CT and RT cannot be the reason for the high differences in nutrient contents between the two tillage systems. The surplus of K was even greater under CT (Table 7). Yields of forage crops (grass–clover and silage maize) were greater under RT; larger quantities of crop residues and root biomass were also left on the field. RasmussenReference Rasmussen5 reported a significant increase in plant-available P in 0–5 cm soil depth under RT in various studies, while available P in 10–20 cm remained stable or even decreased. A stratification of plant-available P similar to Corg was also found by EmmerlingReference Emmerling57, whereas the total amount of plant-available P remained constant in 0–25 cm depth. Vu et al.Reference Vu, Tang and Armstrong58 found a concentration of plant-available P in 0–10 cm under NT. A high accumulation of Corg was closely related to organic P dynamics, as organic P accumulates only when C availability is highReference Bünemann, Heenan, Marschner and McNeill59. Plant-available K in the top layer was greater under RT, whereas there were no differences between RT and ploughed soil in 10–20 cm5.
Nutrient budgets
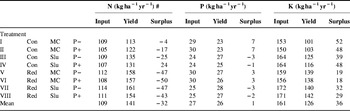
To ensure both short-term productivity and long-term sustainability, achieving a balance between inputs and outputs of nutrients within the farm system is crucialReference Watson, Bengtsson, Ebbesvik, Løes, Myrbeck, Salomon, Schroder and Stockdale17. As nitrogen fixation by legumes was not considered in our calculation, nitrogen budgets were clearly negative for all treatments. The deficit was −17 kg N ha−1 yr−1 in the mean of the CT compared to −47 kg N ha−1 yr−1 in the mean of the RT. P input and removal were balanced, while there was a surplus of K in all treatments over the first crop rotation period (Table 7). K surplus in the conventional treatment (46 kg K ha−1 yr−1) was twice that in the reduced treatment (24 kg K ha−1 yr−1). Removal of N and K under RT was higher, mainly due to the higher yields of grass–clover and silage maizeReference Krauss, Berner, Burger, Wiemken, Niggli and Mäder27.
Nutrient budgets on a field basis for nitrogen (N), phosphorus (P) and potassium (K) for the first crop rotation period (2003–2008).

Values presented are annual means. # Biological nitrogen fixation not considered.
Con, CT; Red, RT; MC, manure compost; Slu, slurry; P−, without preparations; P+, with preparations.
If biological N-fixation was considered, N-surpluses of up to 60 kg N ha−1 yr−1Reference Berry, Stockdale, Sylvester-Bradley, Philipps, Smith, Lord, Watson and Fortune18 could be estimated for organic farms in the UK. In a survey considering 88 European organically managed farms, Watson et al.Reference Watson, Bengtsson, Ebbesvik, Løes, Myrbeck, Salomon, Schroder and Stockdale17 found an average N surplus of 82 kg ha−1 yr−1 for dairy farms.
Stockless organic farms show P-deficits, while farms with livestock can compensate by importing P in additional feed and bedding materialReference Watson, Bengtsson, Ebbesvik, Løes, Myrbeck, Salomon, Schroder and Stockdale17, Reference Berry, Stockdale, Sylvester-Bradley, Philipps, Smith, Lord, Watson and Fortune18. Negative balances of P for organic dairy farms in Norway were reported by Steinshamn et al.Reference Steinshamn, Thuen, Bleken, Brenøe, Ekerholt and Yri60. P deficits were also reported by EmmerlingReference Emmerling57 in a stockless trial with RT under organic farming conditions.
K budgets calculated for organic crop rotations show both surpluses and deficitsReference Watson, Bengtsson, Ebbesvik, Løes, Myrbeck, Salomon, Schroder and Stockdale17. Rotations with large return of manure had K surpluses or balanced K budgets, which is also the case in the present experiment.
To summarize, our results are in agreement with current data in the literature whereby stratification of Corg, microbial biomass, microbial activity and soil nutrients were often observed after the adoption of RT. In the 10–20 cm soil layer, we found no differences in Corg and soil nutrients between the two tillage systems. Interestingly, soil microbial biomass C and microbial activity (DHA) were also higher in the untilled layer of RT. We found no similar results in the literature and assume that comparatively high inputs of organic material via crop rotation and manure were important factors in the present experiment. The goal of our current research is to target the role of soil types, and of clay minerals in particular, and especially the hydraulic dynamics and aeration of tillage systems. The results presented here reflect the situation after 6 years of RT under organic farming conditions. In their review, Kay and VandenBygaartReference Kay and VandenBygaart3 found results of changes in Corg obtained by different investigators to be most consistent when measurements were made more than 15 years after initiating the tillage trial. Further development of soil fertility indicators need to be assessed, also with respect to carbon sequestration in an organic farming system with diversified ley-based crop rotation and organic fertilization, as carbon sequestration of RT systems is still a matter of controversyReference Baker, Ochsner, Venterea and Griffis8. Further research on the combined effects of organic farming and RT on this issue is necessary.
Conclusions
After the first 6-year crop rotation period, only tillage resulted in significant responses in soil fertility indicators. Hardly any effects of the fertilization treatments and the use of biodynamic preparations were observed. We found a strong stratification of Corg, microbial biomass, microbial activity (DHA) and soluble soil nutrients such as P and K in the RT tillage system. Enhancement of these properties in the superficial soil layer under RT, accompanied by 11% higher yields, led to the conclusion that RT is a suitable method for increasing soil fertility in organic farming systems. In conclusion, our RT system has demonstrated its capacity to provide a balanced performance with respect to several ecological services of agro-ecosystems, such as primary production, maintenance of soil fertility and natural resources, and nutrient supplyReference Björklund, Limburg and Rydberg61. It has to be pointed out that these results were obtained on a clayey soil and similar studies are needed under different pedo-climatic conditions. Moreover, because RT organic farming systems protect soil and improve nutrient use efficiency, they may be considered for agricultural policy support actions.
Acknowledgements
We sincerely thank the farmers involved in the project, especially Pius Allemann, Rainer Sax and Daniel Böhler. For technical assistance, we are grateful to Robert Frei and Bruno Nietlispach (both FiBL, Frick). For help concerning statistics, we thank Franco Weibel (FiBL, Frick), Karl Moder and especially Ali Moghaddam (both BOKU, Vienna). We also thank Fredi Strasser for helpful discussions on RT under organic farming conditions and Monika Messmer for comments on the manuscript. This study was funded by the Swiss Federal Office for Agriculture and various foundations: Dutch BD-Vereniging (NL), Stiftung zur Pflege von Mensch, Mitwelt und Erde (CH), Sampo Verein (CH), Software AG-Stiftung (DE) and Evidenzgesellschaft (CH) and Coop Fond für Nachhaltigkeit (CH).